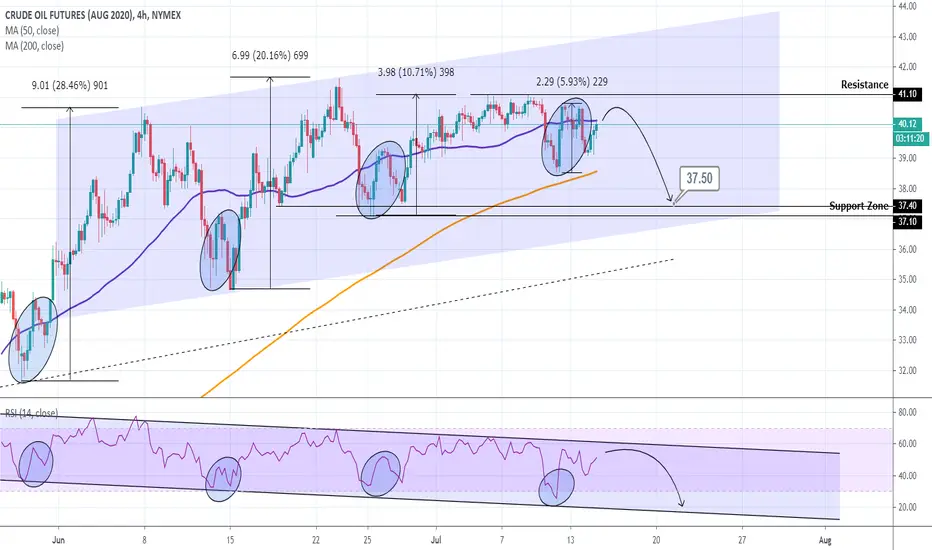
WTI Crude Oil: Channel Up approaching the buy levels.Oil is trading within a Channel Up on the 4H chart (RSI = 47.620, MACD = 0.080, ADX = 19.348) with the price currently testing the Inner Higher Lows trend-line (dashed). This is technically a buy signal based on the candle action since July 10th. If that breaks we will buy on the Channel Up bottom (Higher Low trend-line) aiming at a price near the 42.50 Resistance.
If the 4H MA200 breaks though, we will book the loss and turn bearish towards the 37.50 - 37.00 Support Zone to cover the loss and add profit on top.
Our previous trade:
** If you like our free content follow our profile to get more daily ideas. **
Comments and likes are greatly appreciated.
Wtioil

Trade idea on WTIWTI OIL is in a wedge which should normally break from the bottom.
I'm long on oil until it'll reach 44$ level which is also the top of the wedge. Watch out for possible fake breakout from the top.
If resistance is validated short at 44$ wit targets :
- 41.6 which will be the green support line
- 40$ which is the 4H MA 200
- 34.4$ which is the next big support.
Do not enter the trade if 40$ resistance isn't validated. SL 44.5.

The greatest shakeout in historyOIL had the craziest shakeout with coronavirus leading it to go under 0$ and suppliers paying people to take oil off their hands.
So far we have reversed and looking quite positive, the main price action i will be looking for is a reclaim of the previous support outlined in the white lines/blue zones as the Risk:Reward is good from that area for a trade.

WTI USOil Retrace to 40.8 to Go Long While Trump SpeaksGive it some breathing room to 40.08 but this should take the price up to 43.00. President Trump speaks after the market close so we should see it all take place wround that time.

WTI Crude OilWTI crude oil, the spring is wound (very low volatility in latter days), soon the price will shoot upwards

USoil go long. Divergence + fakeoutOil looks really strong after the fakeout break of the rising wedge.
Lovely divergence to on the 1 hr charts, could go a lot higher. Stop below the divergence

USOIL INTRADAY 40.60 is important level CRUDE WTI OILUSOIL INTRADAY 40.60 is important level
Below 40.60 - 40 - 39.70
Above 40.60 - 40.90 - 41.30

Oil slows downFirstly, please support our work by clicking like button & or following! These really assist us to reach more investors & traders like you!
Prices have remained range bound around $40.00/bbl and with global economic activity struggling to pick the pace, oil is likely to remain
range in the short-term.

Short USoil I Cup Handle reversal/wedgeBad Consumer confidence numbers today.
I shorted at 40.8 and took day trade profits here with the break of the neckline at 40.2. It looks very toppy here though (as do stock indexes) and things may sell of a lot to the lower line of the wedge at least. Stop at high of cup and handle.
Are we looking at the biggest crash in the market??Based on my analysis I believe we are approaching another crash in the market, probably the biggest one yet..
NASDAQ is rising on hopes and dreams, FED are pumping money into it left right and center, and it has reached a new high. There is a considerable amount of divergence on EVERY time frame and yet price has barely gone down.
Dow Jones is approaching its previous highest high where it took a tumble
SP500 is also doing the same as DOW
And now OIL is reaching a point in the market where it previously crashed
I suspect Nasdaq will flutter around and consolidate until DJ30 / US500 and Crude OIL catch up and then everything will crumble at the same time.
I may be wrong but these are my thoughts on this madness

$XAUUSD commodities overviewCommodities are hitting the key level for the continuation reversal. Look at this overview for the key price action levels to watch.

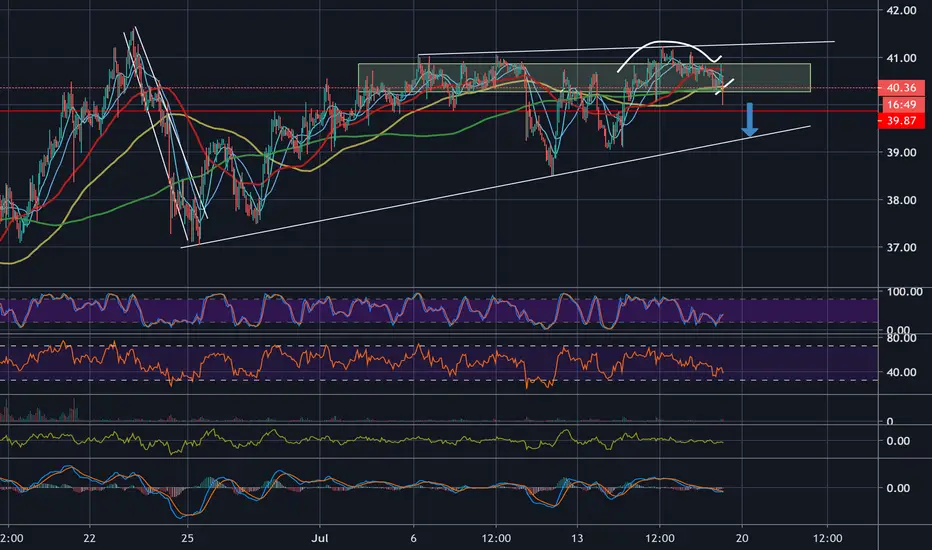
OIL Sell SignalPattern: Channel Up.
Signal: Bearish as the price failed to break the Resistance and th 4H RSI is at the top of its Channel and a similar bearish formation has been seen 4 times previously.
Target: 37.50 (just above the Support Zone).
** Please support this idea with your likes and comments, it is the best way to keep it relevant and support me. **
NYSE:WTI P-Modeling Pt 2. Harmonic Strings of The Illusive CajunWelcome Hyperspace Agent.
This is an analysis of WTI OIL.
In order to understand where we are now, you must see the entire time-series of Part One.
Press Play first.. Then View Snapshots In Order
Then scroll to see Time-Series Snapshots In order. This idea is from Sept 2019.
If you skip the step above.. you won't understand... how i progressed to what I am presenting now.
Or if you simply don't care.. That is perfectly ok! No one is forcing you.
But you prob won't get it either way. And if you do...? well.. gold star for youuu. .
_______________________________________________________________________________________________________
Nothing is placed randomly. The original idea *PART ONE* nailed the targets, but was incorrect on timing. However, once adjusted it can be viewed in Time-Series fashion how the targets were indeed hit quite in an interesting manner. Both Part One and Two are on the same time-frame. The inverted cup and handle was executed. It had a harmonic exit.. so my initial timing was off. This was validated with the snapshots in Part One. But then it deviated after completing the original harmonic goals.. So two propositions began to develop.
Proposition A is in the yellow trend.
Proposition B is in the Red trend.
We inch a tad higher? and Wham..Bam. Slapped down..
Catalyst.. Dropped demand of oil as USA and globe enters Wave Two of Covid-19. or
The idea is we have a second bottom. But a true Bottom. That is outlined in Proposition B. Adam and Eve as they may call it I guess?..
I think we are going to execute Proposition B. Mere Penny's.
However, keep an eye on proposition A and the structure of the chosen fractal vs the actualization of the trending.
It will not be exact... Not always at least. ;)
This is simply an update to see how the rest of the story plays out.
There is def a lot of validity to it. Now let's see if we can refine it further..
Trial and Error.
Failure is a necessary component of success.
Thanks for Pondering the Unknown with Me,
Glitch420

WTI oil price, where next? Hello traders, on Friday we've seen strong buy pressure dove the price up after Thursday prices decrease (could be related to the IEA report release where they expected an increase in demand), however, we can see clearly that the price is ranging in a bullish triangle, any break above the resistance line could take the price higher, the current resistance price level (41-42$) was support level for 4 years ago!
on the other hand, any breakdown of the support trendline could lead to a big price correction.
Your comments are welcome.
Remember this is just my own thoughts, not financial nor investment advice. trading is risky and you should do your own research before engaging in it.

WTI Oil: Made a Top formation on 4H. Two possible rebound pointsWTI Crude Oil is trading within a Channel Up on the 4H chart (RSI = 36.632, MACD = 0.170, ADX = 31.347). The MACD turned flat and as you see on the chart that has been a signal of a top formation on three previous occasions. In two of them the price dropped a little more than -11% and on the other around -15.50%. The Symmetrical Support zone that held on three occasions since June 16th is 37.50 - 37.00. It is possible to see the price rebound either there or a little earlier on the 4H MA200.
** If you like our free content follow our profile to get more daily ideas. **
Comments and likes are greatly appreciated.

US Oil short to 35 maybe lowerHere we can see an awful two bar reversal pattern on the daily with strong divergence on the MACDH. It seems that no sooner did oil fill the long term gap to 41.5 that it immediately sold off. I've been day trading it short since 41, here we can see the full horrible daily picture now.
Looks like a lot more bearishness to come, even more so perhaps once the 4 and 1 hr moving averages have turned properly negative.


WTI Crude Oil: Bullish on the short-term.WTI is trading within a Channel Up on the 4H chart (RSI = 56.026, MACD = 0.100, ADX = 22.319) having successfully crossed the 4H MA50. This has been typically a bullish extension sign since May 28th. We are bullish aiming at 41.50 - 42.00.
** If you like our free content follow our profile to get more daily ideas. **
Comments and likes are greatly appreciated.


WTI OIL Buy SignalPattern: Channel Up on 4H.
Signal: Bullish as a bottoming fractal has been formed after the price bounced near the Higher Lows trend-line since May 27 and the RSI bounced near the Lower Low trend-line of its Channel Down.
Target: 42.00 (just below the Higher High of the Channel Up).
** Please support this idea with your likes and comments, it is the best way to keep it relevant and support me. **
Previous WTI signal:


US Crude, buy at support gap fill to 41Nice bounce of support. Should see some buy pressure around here. We still need to fill the breakaway gap from a few months ago to around 41.
