WTI OIL - 4H Bullish AgainBLACKBULL:WTI has shown signs of completing its recent correction phase, setting the stage for a potential bullish move. Technically, after a strong upward surge driven by bullish momentum, TVC:USOIL entered a two-leg correction that appears to have found support. This could suggest that the price is ready to continue its upward trajectory from the current support zone.
Fundamentally, oil prices have been supported by several factors over the past week. Ongoing supply cuts from OPEC+, especially from Saudi Arabia, have tightened the global oil market. Additionally, expectations of increased demand, fueled by economic resilience in key markets like the US and China, have contributed to upward pressure on prices. These combined factors could further bolster WTI’s next move to the upside.
Wtioil

WTI recovered after hitting a 2-week low TVC:USOIL prices recovered after hitting a nearly two-week low after a surge in U.S. refining activity last week pushed gasoline and crude inventories down more than expected.
US crude inventories fell 3.4 million barrels in the week ended July 5 to 445.1 million barrels, far exceeding market expectations for a decline of 1.3 million barrels.
Gasoline inventories fell 2 million barrels to 229.7 million barrels, much higher than market expectations of a decline of 600,000 barrels during the July 4 holiday week.
EIA data showed distillate inventories, which include diesel and heating oil, rose 4.9 million barrels to 124.6 million barrels, compared with forecasts for an increase of 800,000 barrels.
EIA said crude inventories at the Cushing, Oklahoma distribution center fell by 702,000 barrels last week.
EIA said refinery processing capacity increased by 317,000 barrels per day last week and capacity utilization increased by 1.9%. Gulf Coast refinery capacity utilization reached its highest level since June 2023.
Federal Reserve Chairman Jerome Powell said he is not ready to declare inflation defeated, but he believes the US is still on track to achieve stable prices and low unemployment.
The Federal Reserve will make interest rate decisions "as needed," downplaying suggestions that a September rate cut could be seen as a political move ahead of the presidential election in the fall.
Investors are betting on an interest rate cut in September, which could boost economic growth and oil demand. Expectations that the Fed will cut interest rates by 25 basis points in September rose to 74% from about 70% on Tuesday and 45% a month ago, according to CME FedWatch data.
OPEC on Wednesday maintained its forecast for relatively strong global oil demand growth this year and next, saying resilient economic growth and air travel would support summer fuel use.
However, news about the geopolitical situation can still put pressure on oil prices. The Israeli delegation arrived in Doha to hold four-party negotiations on a ceasefire in Gaza.
This trading day will focus on changes in the US CPI and initial jobless claims in June, as well as speeches from Federal Reserve officials and news related to the geopolitical situation.
The general market focus still revolves around macro data, inflation, Fed, interest rates, and geopolitical situation.
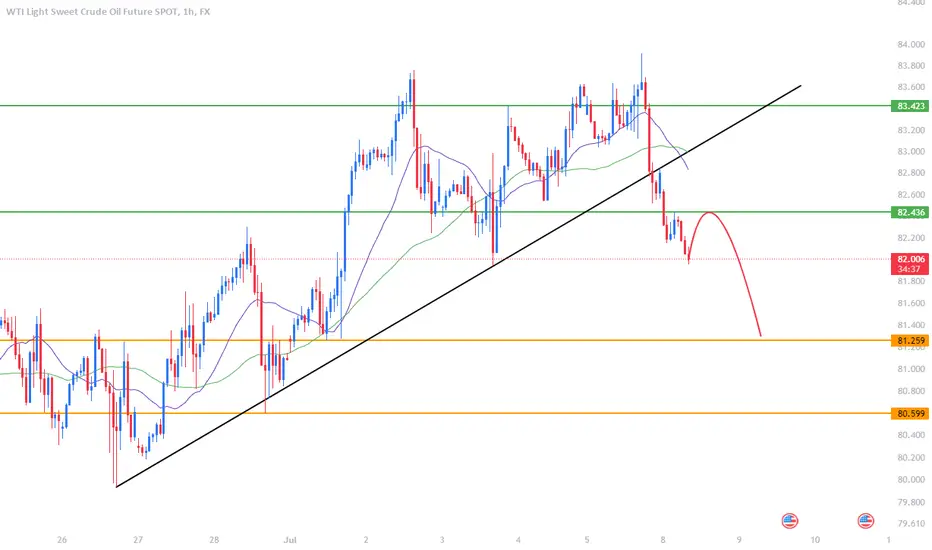
Technical outlook analysis of TVC:USOIL
On the daily chart, after WTI crude oil corrected to the downside, it took support from the 21-day moving average (EMA21) to rebound, and the upside recovery is also being limited by the Fibonacci retracement level. retreat 0.236%.
If WTI crude oil can continue to recover to take price action above the 0.236% Fibonacci retracement level, it has the conditions to continue to increase in price with a target level then around 84.43USD in the short term.
Meanwhile, as long as WTI crude oil remains within the price channel and above the EMA21, it still has a bullish technical outlook. For the bearish case, WTI crude oil sold off below the 0.382% Fibonacci level, this also confirmed the trend price channel was broken to give way to a downtrend with a target of around 77.70USD.
During the day, the technical trend of WTI crude oil is bullish with notable technical levels listed as follows.
Support: 81.24 – 80.04USD
Resistance: 82.94 – 84.43USD

Factors supporting WTI crude oil, weekly outlook analysisThis week, the crude oil market, especially WTI crude oil, experienced a series of fluctuations, ultimately ending the weekend trading session with a slight decrease in WTI crude oil futures prices. Despite pressure from a stronger US Dollar, growing US oil demand and falling fuel inventories supported crude markets, while geopolitical tensions added to market uncertainty.
The strength of the US Dollar has had a significant impact on the crude oil market. The dollar hit a seven-week high against major currencies, making dollar-denominated crude more expensive for holders of other currencies, potentially curbing oil demand. Global.
However, strong US economic activity, especially business activity hitting a 26-month high in June, has provided some support to oil demand.
WTI crude oil increased 3.23% this week to 80.52 USD/barrel. Brent crude oil increased 2.53% this week to $84.18/barrel.
Supply and demand dynamics:
Data from the US Energy Information Administration (EIA) showed that total petroleum product supply increased significantly last week to 21.1 million barrels per day, indicating that the US oil market is tightening. The arrival of the summer driving season, along with falling inventories, has pushed U.S. gasoline futures higher, reflecting growing demand.
Geopolitical factors:
Geopolitical tensions, especially the conflict between Israel and Lebanon and Houthi attacks in the Red Sea, have added pressure on crude oil markets. These events have raised concerns about supply disruptions, which could pressure oil prices.
General opinion:
Rising oil demand over the summer and rising geopolitical tensions in the Middle East are likely to be key factors that continue to drive crude oil markets, especially WTI crude. In addition, readers also need to pay attention to outstanding developments in the Fed's monetary policy because it will also affect oil prices because crude oil is priced in US Dollars.
Technical outlook analysis of TVC:USOIL
On the daily chart, WTI crude oil is gaining important upside potential with an uptrend formed and noticed by the price channel.
On the other hand, WTI crude oil is still stable above the 0.382% Fibonacci level, showing the possibility that it will continue towards the next Fibonacci level at 0.236% in the near future. Along with that is support from the EMA21 moving average.
In the short term, as long as WTI crude oil remains within the price channel, above the EMA21, and the RSI has not reached overbought levels, it still has a bullish technical outlook.
Notable levels will be listed again as follows.
Support: 80.04 – 77.70USD
Resistance: 82.94USD

Texas Oil to continue in the downward move at market price?WTI - 24h expiry
Our short term bias remains negative.
Our bespoke support of 77.06 has been clearly broken.
Previous support at 77.50 now becomes resistance.
We look for a temporary move higher.
We look for losses to be extended today.
We look to Sell at 77.50 (stop at 78.30)
Our profit targets will be 75.50 and 75.15
Resistance: 77.13 / 77.50 / 78.00
Support: 76.60 / 75.80 / 75.4
Risk Disclaimer
The trade ideas beyond this page are for informational purposes only and do not constitute investment advice or a solicitation to trade. This information is provided by Signal Centre, a third-party unaffiliated with OANDA, and is intended for general circulation only. OANDA does not guarantee the accuracy of this information and assumes no responsibilities for the information provided by the third party. The information does not take into account the specific investment objectives, financial situation, or particular needs of any particular person. You should take into account your specific investment objectives, financial situation, and particular needs before making a commitment to trade, including seeking advice from an independent financial adviser regarding the suitability of the investment, under a separate engagement, as you deem fit.
You accept that you assume all risks in independently viewing the contents and selecting a chosen strategy.
Where the research is distributed in Singapore to a person who is not an Accredited Investor, Expert Investor or an Institutional Investor, Oanda Asia Pacific Pte Ltd (“OAP“) accepts legal responsibility for the contents of the report to such persons only to the extent required by law. Singapore customers should contact OAP at 6579 8289 for matters arising from, or in connection with, the information/research distributed.

next sell opportunityI consider this scenario and will look for confirmation at indicated levels to short

WTI Oil - 4HWTI oil completed its second bullish leg and has now formed a reversal setup. The price action shows that WTI missed the ascending channel support and is currently consolidating below the previous support zone, which has now turned into a resistance level. This suggests a potential bearish outlook as the price struggles to regain upward momentum.
With the recent break of the ascending channel, it is expected that WTI may continue its downward trajectory. The consolidation under the new resistance zone indicates seller strength, and further declines could be seen if the price fails to break back above this resistance. Traders should watch for key support levels around $81 and $78 for potential buy signals or continuation of the bearish trend.

WTIThe general trend of oil is currently downward and every high is worth selling!
Pay attention to the limits beforehand and check in a small time frame

WTI Crude Oil Bearish Heist Plan to make moneyMy Dear Robbers / Traders,
This is our master plan to Heist WTI Crude Oil Market based on Thief Trading style Technical Analysis.. kindly please follow the plan I have mentioned in the chart focus on Short entry. Our target is Green Zone that is High risk Dangerous level, market is oversold / Consolidation / Trend Reversal at the level Bullish Robbers / Traders gain the strength. Be safe and be careful and Be rich.
Note: If you've got a lot of money you can get out right away otherwise you can join with a swing trade robbers and continue the heist plan, Use Trailing SL to protect our money.
Stop Loss : Recent Swing High using 4h timeframe
Warning : Fundamental Analysis comes against our robbery plan. our plan will be ruined smash the Stop Loss. Don't Enter the market at the news update.
Loot and escape on the target 🎯 Swing Traders Plz Book the partial sum of money and wait for next breakout of dynamic level / Order block, Once it is cleared we can continue our heist plan to next new target.
support our robbery plan we can easily make money & take money 💰💵 Join your hands with US. Loot Everything in this market everyday make money easily with Thief Trading Style.

Crude Oil Analysis and Trading Signals UpdatesCrude oil technical analysis
Daily resistance 83.4, support below 80.62-79
Four-hour resistance 83.4-82.5, support below 81.2
Crude oil operation suggestions: Crude oil fluctuated and consolidated in a narrow range at a high level last Friday. The overall price continued the recent high-level fluctuation and consolidation rhythm. Today, the upper pressure continues to focus on 82.5-83.4. The intraday rebound continues to short at this position. The lower support focuses on the 82 mark. The short-term crude oil strong dividing line focuses on the 82.5 mark. Before the daily level stabilizes at 83.4, continue to sell at a high price around 83.4.
SELL:80.7near
SELL:82.5near
SELL:83.4near
Technical analysis only provides trading direction!
Long Opportunity
I consider this szenario to open my LONG position with several Stops on the move towards 84 or even 85. Volume Profile and Neck Line support this idea.

WTI OIL Rejected on the 9-month Resistance. Still good to sell.Last week (July 02, see chart below) we called for a short-term correction upon a potential Lower Highs rejection on WTI Oil (USOIL):
As you can see, the strong rejection was materialized last Friday on that 9-month Resistance, and the long-term Triangle pattern is technically looking for a 0.618 Fibonacci retracement level test.
Zooming out on the 1W time-frame, we can see even more relevant info. During the previous two 0.618 Fibonacci pull-backs, the price also hit the 1W MA200 (orange trend-line), which has served as Oil's long-term Support in the last 3.5 years (since February 01 2021). The only time it closed a 1W candle below the 1W MA200 during this time span was recently on the week of June 03 2024.
As a result, besides the 0.618 Fib, we expect the 1W MA200 to be tested also, so depending on the decline's strength, we may have to move our 77.00 Target a bit higher (e.g. 78.00). It has to be mentioned though that the decline to the 0.618 Fib during the past 2 corrections has been dealt within a week. So technically we should be expecting an aggressive move this week.
-------------------------------------------------------------------------------
** Please LIKE 👍, FOLLOW ✅, SHARE 🙌 and COMMENT ✍ if you enjoy this idea! Also share your ideas and charts in the comments section below! This is best way to keep it relevant, support us, keep the content here free and allow the idea to reach as many people as possible. **
-------------------------------------------------------------------------------
💸💸💸💸💸💸
👇 👇 👇 👇 👇 👇

WTI - 1H Bullish SignsBased on the previous 15-minute analysis and the current 1-hour chart, WTI Crude Oil is showing strong support around the $83.00 zone. This area has acted as a significant support level, and the price has bounced off it, indicating a potential buy opportunity.
On the 15-minute chart, the price had a brief consolidation phase within the support zone before showing signs of upward momentum. This aligns with the 1-hour chart, where the price is currently attempting to rise from the same support area. The consistency in this support zone across different timeframes strengthens the bullish outlook.
Currently, WTI Crude Oil is poised to continue its upward movement from the support level, targeting higher resistance levels. Traders should look for confirmation of this bullish trend with potential higher highs and higher lows forming on the 1-hour chart. If the price maintains its support above $83.00, it could provide a favorable risk-reward ratio for long positions, aiming for the next resistance levels around $84.00 and beyond.
In summary, the support zone around $83.00 has held well, and the current bullish momentum suggests a buying opportunity in WTI Crude Oil, with an eye on higher resistance levels in the near term.

WTI Crude Oil - 4H Still BullishWTI Crude Oil shows promising bullish momentum as it consolidates above a key static support zone, indicating potential for further gains. The price action demonstrates two major bullish legs, with the current position in the middle of the second major leg, suggesting continued upward movement.
Additionally, the presence of a second minor leg forming suggests that the bullish momentum might lead to a breakout, propelling prices to higher targets. Traders should monitor the minor leg’s completion and potential further advances in the price of oil, taking advantage of the bullish trend.

WTI support continues to attract buyers.WTI - 24h expiry
Bespoke support is located at 80.70.
Offers ample risk/reward to buy at the market.
Our short term bias remains positive.
50 4hour EMA is at 80.73.
80.59 has been pivotal.
We look to Buy at 80.75 (stop at 79.95)
Our profit targets will be 82.75 and 83.25
Resistance: 81.50 / 82.24 / 83.00
Support: 80.50 / 79.50 / 79.00
Risk Disclaimer
The trade ideas beyond this page are for informational purposes only and do not constitute investment advice or a solicitation to trade. This information is provided by Signal Centre, a third-party unaffiliated with OANDA, and is intended for general circulation only. OANDA does not guarantee the accuracy of this information and assumes no responsibilities for the information provided by the third party. The information does not take into account the specific investment objectives, financial situation, or particular needs of any particular person. You should take into account your specific investment objectives, financial situation, and particular needs before making a commitment to trade, including seeking advice from an independent financial adviser regarding the suitability of the investment, under a separate engagement, as you deem fit.
You accept that you assume all risks in independently viewing the contents and selecting a chosen strategy.
Where the research is distributed in Singapore to a person who is not an Accredited Investor, Expert Investor or an Institutional Investor, Oanda Asia Pacific Pte Ltd (“OAP“) accepts legal responsibility for the contents of the report to such persons only to the extent required by law. Singapore customers should contact OAP at 6579 8289 for matters arising from, or in connection with, the information/research distributed.

USOILOil analysis
4-hour and 1-hour time frames
The price is near the 4 and 1 hour supply area and we expect it to start correcting after hitting the area.

USOIL(WTI), SHORTUSOIL(WTI) in the early month of June made gains in a localized ascending channel since 4th Jume from $72.497 to $78.98 but the $79 price remains a strong resistance to the price ascension.
As long as $79 and $78.55 remains resistance, USOIL (WTI) could fall to the $76.5 with potential further extension of the losses to $75 in the coming days.
Resistance 1: 78.95
Resistance 2: 78.54
Support 1 : 77.3
Support 2 : 76.5
Support 3: 75.0

Crude oil eyes $80, but resistance loomsWTI is on track for a bullish engulfing week to snap a 3-week losing streak. And as it fell over 17% from the April high, it could pave the way for further gains in the coming weeks. However, there are plenty of resistance levels around the $80 that could spur bears from the side lines.
The May VPOC and VAH sit around Wednesday's high, and the monthly R1 and weekly R2 near the May high. So whilst another crack at $80 seems more likely than note, the $80 area could be an interesting area to fade into.
Strong support sits around $75.50, making it a viable target for bears and area for bulls to reconsider entering for an anticipated move above $80.

WTI Oil - 4H Sell OpportunityThe WTI Oil chart shows a compelling setup for a short position. The price has rallied into a significant resistance zone around $79, coinciding with a strong downward trend line that has been respected multiple times. This area acts as a confluence of resistance, providing a high-probability entry for selling.
Given the persistent bearish trend, this resistance zone is likely to hold, reinforcing the potential for a downward move. The chart indicates that selling WTI Oil at this juncture offers a good risk-to-reward opportunity, aiming for a decline towards lower support levels as shown by the red arrows.

WTIin the pic u see that our downtrend was broken with good impulsive move out
after that i stay like snake to hunt it
the price come to my zone
now if i see good confirmation i will long wti

CRUDE OIL (WTI): Your Trading Plan For Next Week
WTI Crude Oil is trading in a bearish trend on a daily.
For the entire month of May, the market is consolidating within a horizontal range.
I believe that a bearish trend will continue after a violation of the support of the range.
I am waiting for its breakout to sell the market.
A daily candle close below 75.5 will confirm a violation.
A bearish wave will be anticipated at least to 72.5 level then.
❤️Please, support my work with like, thank you!❤️

OIL (WTI) - 4H Three PushThe WTI Oil 4H chart displays a classic bullish reversal pattern, often referred to as the "three pushes" or "three drives" pattern. This pattern is characterized by three distinct attempts by the market to push lower, each attempt being met with increasing buying interest. The current setup shows that after three downward pushes, the price has started to rebound, indicating a potential shift in momentum from bearish to bullish.
The price action has recently broken above the upper boundary of the descending wedge, which suggests a weakening bearish trend and the possibility of a new bullish phase. The target for this bullish movement could be around the $84 level, where previous resistance lies. Traders should watch for continued higher highs and higher lows to confirm the upward trajectory, and consider long positions as the price action aligns with this bullish reversal signal.

Crude Oil / Brent Oil Robbery Plan in Bullish SideMy Dear Robbers / Traders,
This is our master plan to Heist Crude Oil based on Thief Trading style Technical Analysis.. kindly please follow the plan I have mentioned in the chart. Our target is Red Zone that is High risk Dangerous level Police Force is waiting for our arrival, Market is overbought / Consolidation / Trend Reversal at the level Bearish Robbers / Traders gain the strength. Be safe and be careful and Be rich.
Note: If you've got a lot of money you can get out right away otherwise you can join with a swing trade robbers and continue the heist plan,
Loot and escape on the target 🎯 Swing Traders Plz Book the partial sum of money Use Trailing Stop To Protect Looted Money and wait for next breakout of dynamic level / Order Block, Once it is cleared we can continue our heist plan to next new target it will update after the Breakouts.
support our robbery plan we can easily make money & take money 💰💵 Join your hands with US. Loot Everything in this market everyday.
