WTI OIL Consolidation before rise to $91.50.WTI Oil (USOIL) is trading within a Channel Up pattern since the January 28 High supported by the 4H MA50 (blue trend-line) - 4H MA200 (orange trend-line) Zone. The Bullish Legs have so far recorded rises within a +8.24% to +10.24% range.
Right now it appears that Oil has finished the latest Bullish Leg as the 4H RSI made its standard Peak formation and declined. According to the previous RSI patterns, this decline is the most optimal buy entry.
Now we should be expecting a consolidation around the 4H MA50 and not lower than the 4H MA200 before the next rally. Taking the lowest +8.24% rise scenario, we are targeting for a minimum Higher High at 91.50.
-------------------------------------------------------------------------------
** Please LIKE 👍, FOLLOW ✅, SHARE 🙌 and COMMENT ✍ if you enjoy this idea! Also share your ideas and charts in the comments section below! This is best way to keep it relevant, support us, keep the content here free and allow the idea to reach as many people as possible. **
-------------------------------------------------------------------------------
💸💸💸💸💸💸
👇 👇 👇 👇 👇 👇
Wtioil

WTI OIL Big rally ahead unless it breaks below the 1W MA100.WTI Oil (USOIL) hit our long-term 82.50 Target last week, a call made early this year (January 12, see chart below) when the price was still at $74.33:
At the moment, the price sits above the 1W MA100 (green trend-line) for the first time since the week of October 23 2023, as the week opened above it. This calls for an upward extension similar to the September 04 2023 1W MA100 bullish break-out.
As long as the 1W candles close above the 1W MA100, we will stay bullish, targeting the 18-month Resistance Zone (red) at 92.50. If Oil closes a 1W candle below the 1W MA100 though, we will take the loss and open a short instead, targeting the 1W MA50 (blue trend-line) and Higher Lows trend-line at 79.00.
-------------------------------------------------------------------------------
** Please LIKE 👍, FOLLOW ✅, SHARE 🙌 and COMMENT ✍ if you enjoy this idea! Also share your ideas and charts in the comments section below! This is best way to keep it relevant, support us, keep the content here free and allow the idea to reach as many people as possible. **
-------------------------------------------------------------------------------
💸💸💸💸💸💸
👇 👇 👇 👇 👇 👇

WTI CRUDE OIL Sell signal at the top of the Channel Up.WTI Crude Oil reached the top of the December 2023 Channel Up as well as the dashed Channel Up that started after it crossed over the MA50 (1d).
This is a double sell opportunity.
Trading Plan:
1. Sell on the current market price.
2. Sell again if the price closes a (1d) candle under the dashed Channel Up.
Targets:
1. 82.00 (bottom of dashed Channel Up).
2. 79.00 (bottom of long term Channel Up).
Tips:
1. The RSI (1d) crossed into the overbought zone (above 70.00). That is an additional reason for a technical correction.
Please like, follow and comment!!
Notes:
Past trading plan:

WTICO Outperforms BCO on US Oil Production RiseWTICO (West Texas Intermediate Crude Oil) has recently been outperforming BCO (Brent Crude Oil). This trend coincides with an increase in US-produced oil replacing sanctioned Indian refined oil.
Potential Opportunity in WTICO
The shift in market dynamics could present an opportunity for traders considering long positions in WTICO. However, as always, it's important to conduct your own research and consider factors like:
• Market Volatility: Oil prices can fluctuate significantly due to various factors.
• Global Oil Production: Changes in global oil production can impact WTICO's price.
• Your Investment Strategy: This trade should align with your overall risk tolerance and investment goals.
Stay Informed, Make Informed Decisions
We recommend staying updated on market developments before making any investment decisions.
We're Here to Help
Please don't hesitate to contact us if you have any questions or would like to discuss this further within the comments.

US OIL (WTI) MARKET ANALYSE. (READ CAPTION)Technical Analysis:
Incorporate key trading indicators such as the double line resistance breakout, pullback support, and demand zone analysis to assess price movements in the US Oil market. Identify channels and trendlines to spot potential breakout or breakdown points, confirming with volume and momentum indicators like relative strength index (RSI) and moving average convergence divergence (MACD). Additionally, monitor the US Dollar Index (DXY) for its impact on oil prices, considering its inverse correlation. Stay vigilant for opportunities at support and demand zones, utilizing these levels for entry and exit points in your trading strategy.
If you like this idea please support with boost comment and follow thanks for with us.

U.S. oil prices will continue to rise on March 14th.
As the four major inventories continue to decrease. U.S. oil continues to rise. WTI quotation as of closing: 79.153
U.S. API crude oil inventories for the week to March 8 (10,000 barrels)
(-5.221 million barrels)
U.S. EIA Cushing, Oklahoma crude oil inventories for the week to March 8 (-1.536 million barrels)
EIA crude oil inventories in the United States for the week to March 8 (-220,000 barrels)
EIA Cushing, Oklahoma crude oil inventories in the United States for the week to March 8 (596,000 barrels)
BLACKBULL:WTI FPMARKETS:WTI BLACKBULL:WTI NYMEX:WTI1! MATBAROFEX:WTI1!
There are good motivations for the rise in oil prices. At the beginning of the Asian market, oil was stable above 79. Judging from short-term trends, market demand continues to increase due to the spread of geopolitics. It is expected to continue to rise above 80. At the same time, OPEC countries have also decided to reduce production. If there is no physical fall below 79 in the short term, you can directly buy. If the body falls sharply and falls below 79. We can buy near 78.6 in the second position
personal suggestion:
79.-79.3 buy. sl78.TP80.6
The transaction price is based on the real-time price of TradingView. When you are not a member and follow the above operations, remember to control risks.

WTI Crude Oil Price Analysis: Trends, Tensions, and TurnaroundsThe WTI light crude oil benchmark is currently navigating a complex landscape, trading around $83.50 amidst a convergence of factors influencing its trajectory. At present, the market finds itself within a critical juncture, characterized by the interplay of supply dynamics, geopolitical tensions, and currency movements.
Recent market movements have seen WTI prices facing downward pressure, largely attributed to the resurgence of the US Dollar (USD) and unexpected increases in US crude and gasoline inventories. The hawkish remarks from US Federal Reserve Governor Christopher Waller have bolstered the Greenback, signaling a cautious approach towards interest rate adjustments. Consequently, a stronger USD renders dollar-denominated oil more expensive for foreign investors, thereby curbing demand and exerting downward pressure on WTI prices.
Moreover, the Energy Information Administration's (EIA) report revealing a surprising build-up in US crude inventories further compounded the bearish sentiment surrounding WTI prices. This unexpected uptick in stockpiles added to the downward pressure on prices, reflecting a delicate balance between supply and demand dynamics in the market.
Despite these bearish indicators, the geopolitical landscape presents a contrasting narrative. Escalating tensions in the Middle East and the ongoing conflict between Russia and Ukraine have injected a degree of uncertainty into global oil markets. The intensified attacks on Russia's oil infrastructure by Ukraine, coupled with ongoing geopolitical unrest, have the potential to disrupt global supply chains and mitigate the downward pressure on WTI prices.
Amidst this backdrop, market analysts are closely monitoring key technical indicators for potential market reversals. The presence of an H4 supply area, coupled with the formation of a possible Double Top pattern and overbought conditions signaled by the Relative Strength Index (RSI), suggests the possibility of a reversal in WTI prices. However, the outcome remains uncertain, contingent upon the interplay of market forces and geopolitical developments in the coming days.
In conclusion, the WTI crude oil market is navigating a complex web of factors, encompassing supply dynamics, geopolitical tensions, and currency fluctuations. While bearish indicators weigh on prices, geopolitical uncertainties and technical signals hint at the potential for a market reversal. As market participants continue to monitor developments, the future trajectory of WTI prices remains subject to ongoing market dynamics and geopolitical events.

WTI - UPDATE - 28 - 03 - 2024"Investors are eyeing an opportunity with a target price (TP) set at 82,800, coupled with a stop-loss point at 80,300, indicating a strategic approach to managing risk and maximizing returns in the market. This vision suggests a calculated investment strategy, where traders are aiming to capitalize on potential gains while mitigating losses. The decision to buy is influenced by not only technical price levels but also the fundamental strength of the asset, possibly reflected in its price-to-earnings (PE) ratio. This approach reflects a blend of technical analysis and fundamental research, highlighting a comprehensive approach to trading or investing."

WTI OIL Strong sell aheadWTI Oil (USOIL) eventually held the short-term uptrend within the Bullish Leg of the Channel Up and hit our 81.85 Target, as explained on our last idea (March 14 2024, see chart below):
Moving out to the 1D time-frame, we can see that the price has started to pull-back after reaching the top (Higher Highs trend-line) of the long-term Channel Up pattern. In addition, it was rejected on the 1W MA100 (yellow trend-line).
As the 1D MACD formed a Bearish Cross, selling may start to gain momentum and transition into the new Bearish Leg. The previous one hit the bottom (Higher Lows trend-line) of the Channel Up on the 0.618 Fibonacci retracement level from the top. It also made the last contact with the 1W MA200 (red trend-line), which has been Oil's multi-year Support.
As a result, we are now turning bearish on WTI, targeting the 0.618 Fib at 76.00.
-------------------------------------------------------------------------------
** Please LIKE 👍, FOLLOW ✅, SHARE 🙌 and COMMENT ✍ if you enjoy this idea! Also share your ideas and charts in the comments section below! This is best way to keep it relevant, support us, keep the content here free and allow the idea to reach as many people as possible. **
-------------------------------------------------------------------------------
💸💸💸💸💸💸
👇 👇 👇 👇 👇 👇

WTI Next Vision - 26 - 03 - 2024HeIIo AII
I hope this emaiI finds you weII
In my next vision for WTI (West Texas Intermediate), I see a target price of 84.800 as the initial take profit (TP). However, there's a twist in the tale. (SL) at 81.400. Additionally, there's a crucial waiting game tied to the price-to-earnings ratio (PE), where action is anticipated once it hits 82.000. { Wait tiII it hit 82 }
Good Luck have a good day

A Renko Trading Strategy with Multiple IndicatorsThis study will walk through several concepts in analyzing crude oil. The primary chart type will be a Renko chart with the block size (ticks) set to 25 (0.25 in TV) and with a timeframe set to 15 minutes. The significance of timeframe is that in TV, it will take this amount of time for the price to maintain a full block change (25 cents) in order for it to be ‘printed’. In times of high volatility, a 15-minute window can allow for more than one block to print at the same time. While this may be a disadvantage in trading CL futures either day or swing trading, it helps filter out noise in the type of trading I do. The basic strategy I’m wanting to establish using this setup is the buying of options, either puts or calls, that are as near to the market as possible and to limit risk to a % of the value of the purchase price of the option. So, for example, if I pay $2,500.00 USD for a CLQ24 85 Call, I will limit my loss to 10% of that price should the market go against what I had expected.
The chart setups and scenarios in this study will be based on Renko charts along with various indicators that will be discussed (for the most part individually).
A view of 2024 based on the Renko setup.
I will start with this basic view that has the Renko chart configured as outlined above with two linear regression drawings manually drawn on it. There is an indicator for LR which will follow each block change and change accordingly based on the lookback configuration. With the drawing tool, you can start and end the LR based on your strategy. In mine, I want to base the LR on price from a major low to a major high and then adjust based on if a new high or low is obtained. In this chart, I picked the low as that of late December (the first long black arrow). As an exercise, you can hit the new highs from this point to see how the LR adjusted and how future price flowed within it. There are two LR drawings on this chart; one with an upper and lower deviation set to 2/-2 and the second with a upper and lower deviation set to 1/-1 (these are the ones with dots for a boundary). In this specific chart, I’ve started with the latest high to be that on 01-March and with the LRs both extended to the right, you can see the price movement against these LR into the future. As price broke through the top of the LR recently, a new high was put in on 24-March and the adjustment of the LR will be shown next.
With this new high confirmed, the LRs are both move to end at this high while keeping the original starting point the same. In this view, price pulled back to the top of the LR 1std and close here. With the LR extended, you can see where the mean is and a potential price target if just considering the LR itself.
An expanded view of above:
Next, I’ll introduce the DEMA and simple MA on the chart. There are two DEMAs added to the chart with one set to a period of 12 and one set to a period of 20. The significance of the two is that when the 12 (black on this chart) is above the 20 (red on this chart), then the trend is bullish and when the opposite, the trend is bearish. I use these two more for confirmation than for timing. If you study these, you’ll see that they lag for the most part but there are key times that they will provide insight to the direction of a market during times of consolidation.
The next two indicators that I’ll introduce are the Stochastic and Directional Movement Index (DMI with the ADX). The experience of using these indicators on a Renko chart is like that on a candle chart except that the period is not for time but the number of bars that have been printed or committed. There are two Stochs used (5,3,3 and 25,3,3). The intent of the 5,3,3 is to provide a fast-moving change in momentum while the 25,3,3 is designed to provide insight to the momentum of the longer trend. Insight as to timing the entry and exit of trades may be possible with an in-depth understanding of the crossover of the 25,3,3 between the %k and the %d.
The DMI can be used like it is against a candle chart but with settings at 5,5. This provides a faster moving indicator and, with some study, can determine the importance of the interactions between the 3 lines. There is one key aspect of this indicator with the Renko that works similar to the candle and that is of identifying pending consolidation of the market. In a traditional setup of the DMI on a candle chart, the settings are 14,14 and the line of 20 in the indicator is traditionally the line of strength. Meaning that when the ADX falling at or below the 20 line, then the trends are weak and the market is entering consolidation. During this time, the guidance from various sources is to look for patterns on the market and signs of a breakout. For the Renko charts, the are to watch for trend strength and consolidation is between the 35 and 20 area based on the analysis I’ve done. On the following chart, I’ve highlighted some of these areas of consolidation.
Additionally, there is a notion of a high-swap of the +/-Dis which is when price has started moving strongly in one direction and then pivots to change direction and build into a strong trend from this. While in hindsight these look compelling, they can be difficult to trade in real-time, it’s difficult to differentiate between a high-swap and a future degradation of the trend that leads to consolidation. I think that the more reliable setup is finding the longer points of consolidation and prepare to trade in the breakout direction. As you can see on the close Friday, price has moved off of a new recent high and could now be trending down into a period of consolidation (if one were to use just the combination of the DMI and ADX).
If you’ve not read “Secrets of a Pivot Boss” by Franklin O. Ochoa, I would encourage you to do so as it has many extremely valuable and innovative ideas in trading off volume, value, and pivots. The following discussions will be based on concepts from this book.
The first covered will be that of volume area. I will not dig into the specifics of this but to just show one of the many indicators available in TradingView for these concepts. The volume indicators will work with Renko charts and the specific one I’m using allows me to set the increment of volume based on rows or ticks. I’ve chosen ticks and set the number to 5. With a 25 tick Renko chart, this will allow for a granularity of 5 rows per block for displaying the volume profile. In the chart below, I’ve highlighted a concept outlined in the book of the volume area that is extended out to the next trading day and is what forms the basis for 2-day volume area analysis. There are 6 scenarios that go with this analysis and the pink channels on the chart are intended to enable this view. The volume profile I’ve picked in the indicator is for the week so the analysis I do is for the week and not daily. One of the key setups from the book is an ‘inside day’ which you can see at the black arrow. An inside day is a day to watch for breakout (in this case it would be an inside week) and, after support was found, the price went higher.
The last set of indicators that I’ll cover is the Camarilla Pivots. These too are covered in depth in the book referenced above as well as a wealth of details on the web. These pivots do not work on Renko charts so I will create a candle chart with an 8hr setting and then set up the monthly and yearly pivots on it. From this chart, I’ll copy key lines over to the Renko chart.
This first chart is a view of the 25 tick, 15 minute chart going back to the beginning of 2024. I’ve labeled some of the key lines on this chart for both the year 2024 and the month of March.
This is zoomed into the month of March.
I believe a key concept that makes these pivots on the Renko with the timeframe powerful is the ability to see the tests that happen around the various pivots for both support and resistance. There is an entire trading strategy that is outlined in the book referenced above. The current price action seems to imply that price should come back to either the March R3 or the 2024 R3 (which is also the top of the value area for 2023). If price action does come back to these lines, careful attention should be paid to how support plays out and if a buying or selling opportunity arises from it.
Next, I’ll provide a view with all of the reviewed items in one view.
I’m standing aside on trading this for now until the current price action plays out and a cleaning view of potential trade comes into focus. Some observations considering what’s been discussed individually in this study:
The DEMA is currently swapped to the bearish trend.
The -DI is over the +DI which is a bearish trend. However, The ADX has been dropping to the 35 line but has not dropped in the 35 to 20 range to indicate a consolidation phase.
The Stoch has not completely bottomed out long term and could see more downward movement.
While price is at the top of the 1std of the LR, it could drop further.
A drop and hold of the 2024 R3, March R3, top of the 2023 volume area, and the median of the current LR (all would be within proximity of each other) could be a strong buy setup. A break below these lines with an ensuing test from the bottom could be a strong sell setup.
The relationship of the past two weeks’ volume area is bullish.

USOIL WTI Trade IdeaUSOIL is exhibiting a strong bullish trend on the 4-hour timeframe, marked by clear higher highs and higher lows. We'll are watching the 50-61.8% Fibonacci level for a potential entry point. However, this trend is advanced, and a bearish reversal could occur at any time. Trade cautiously, prioritize risk management, and remember – this is not financial advice.

Crude Oil Price Analysis: Implications of Recent EventsIn the H4 timeframe, US Crude Oil prices started the week with a bearish candle, contrasting with the strong gains seen in the previous week. This bearish sentiment seems to be influenced by multiple factors, including technical indicators such as the 61.8% Fibonacci level and overbought stochastic conditions, particularly around the $81.50 mark.
The recent disturbances, including Houthi attacks in the Red Sea and increased drone strikes on Russian oil refineries by Ukraine, have added volatility to the market. Additionally, Israeli Prime Minister Benjamin Netanyahu's announcement to push into Gaza's Rafah enclave has further fueled concerns.
Despite these geopolitical tensions, the decision by OPEC+ members to extend production cuts of 2.2 million barrels per day through the second quarter has contributed to worries about a tight global supply. This has acted as a catalyst for Crude Oil prices.
Looking ahead, the market is closely monitoring the Federal Reserve's stance on interest rates. Expectations that the Fed will maintain higher rates for an extended period may dampen economic activity and fuel demand, potentially impacting Crude Oil prices. However, the overall fundamental backdrop remains supportive for bullish traders, suggesting that any corrective pullbacks could be viewed as buying opportunities.
In conclusion, while the opening bearish sentiment in US Crude Oil prices raises questions about short-term direction, the broader outlook remains bullish. Investors should remain vigilant for potential buying opportunities amid the prevailing geopolitical tensions and supply concerns.
Daily setup:

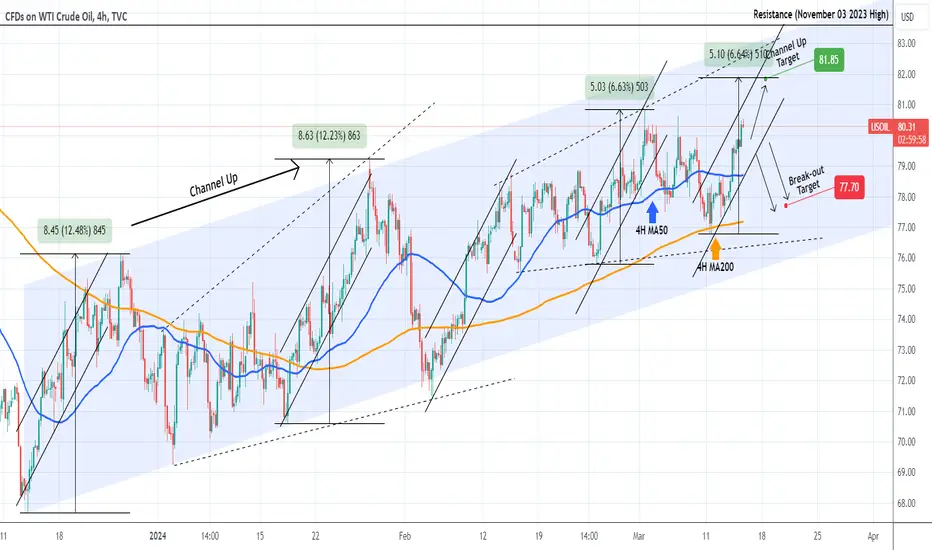
WTI OIL Trade according to this Channel Up.WTI Oil (USOIL) is trading within a short-term Channel Up on the 4H time-frame, with the wider pattern still a Channel Up since the December 13 2023 market bottom. As long as the price keeps closing the 4H candles within the Channel Up, we remain bullish, targeting 81.85 (+6.64%, which is the rise of the previous Bullish Leg of the dashed Rising Megaphone).
If a 4H candle is closed below it, we will take the loss and open a sell aimed at the 4H MA200 (orange trend-line) at 77.70.
-------------------------------------------------------------------------------
** Please LIKE 👍, FOLLOW ✅, SHARE 🙌 and COMMENT ✍ if you enjoy this idea! Also share your ideas and charts in the comments section below! This is best way to keep it relevant, support us, keep the content here free and allow the idea to reach as many people as possible. **
-------------------------------------------------------------------------------
💸💸💸💸💸💸
👇 👇 👇 👇 👇 👇
WTI CRUDE OIL Potential rejection on a Falling Resistance.WTI Crude Oil is close to making a 3rd contact on the Falling Resistance, which last time ended in a 4hour MA200 test.
Along with the Rising Support, this pattern resembles December-January, which later broke upwards to a new High.
Until it does, sell and target the 1day MA200 again at 77.50.
Follow us, like the idea and leave a comment below!!

Oil 4HA lower ceiling occurred on the daily time frame
The trend was broken in four hours
And there are two scenarios for descent
1- Go down from here
2- First it reaches the upper range and then it descends

WTI CRUDE OIL: Huge sell long term and this is why.WTI Crude Oil is neutral on its technical outlook across the three different long term timeframes 1D, 1W and 1M (RSI = 50.461, MACD = 2.330, ADX = 15.020). The latter is the timeframe that we are looking at on this chart and as you can see, Oil is inside a Triangle pattern, which inside the 17 year Channel Down is the pattern that consolidates the price before a major selloff to its bottom.
The similarities on the RSI sequences is further proof, so on the long term we are bearish on WTI (TP = 10.00), whose upside is limited to the 95.50 Resistance.
## If you like our free content follow our profile to get more daily ideas. ##
## Comments and likes are greatly appreciated. ##

WTI OIL (USOIL) Technical AnalysisUpon examining the WTI (West Texas Intermediate) crude oil chart, we observe a robust bullish trend, accompanied by a retracement to the 78.6% Fibonacci level. This significant pullback warrants attention, as price action appears poised for a deeper correction.
In our analysis, we consider historical price swings, taking into account seasonality patterns from previous years at the same time. By doing so, we explore the likelihood that institutional players may be positioning themselves to drive prices lower, targeting liquidity zones below previous support levels. Additionally, an imbalance is evident on the 4-hour timeframe.
Disclaimer: This technical analysis serves as an opinion and should not be construed as financial advice. Traders and investors should conduct their due diligence and seek professional counsel before making any trading decisions.

WTI (OIL)Texas oil prices are rising (as well as North Sea Brent). Considering the current global risks, the possibility of oil price increase is still standing. (This is a personal opinion)

WTI OIL: Bearish more likely long term.WTI Oil is neutral on the 1W technical outlook (RSI = 51.426, MACD = -0.040, ADX = 21.884) as it is about to close the third straight week trading sideways on the 1W MA50. On this long term chart, we can clearly see that the price hasn't crossed over the R1 level (79.75) since November 13 2023. As long as it keeps closing the 1W candle under it, we are bearish aiming at the 1W MA200 (TP = 73.50), which has been the ultimate Support in tha past few years, closing all 1W candles above it (see the circles). If on the other hand the 1W candle closes over the R1 level, expect a 83.50 test of the Symmetrical Resistance and 1W MA100, which is a Resistance level only crossed once since December 2022.
The 1W RSI trend looks like October 2022 (over the RSI's MA), which was a pattern that was followed by a strong decline. Consequently, we will sell one more time if the 1W candle closes under the 1W MA200 and target near the S1 Zone (TP = 65.00).
## If you like our free content follow our profile to get more daily ideas. ##
## Comments and likes are greatly appreciated. ##

A Renko Trading Strategy - A Look at a ChartThis is a current view of CL and some details on the consolidation that is showing up on the 50 and 25 tick charts. February resistance levels are getting tested again. The 10-tick short-term chart has shown some strength but now showing divergence as price hits the larger blocks resistance levels.
10-tick chart
25-tick chart
50-tick chart

A Renko Trading Strategy - Part 7Part 7: Some Examples of Analysis with Indicators
First, let’s look at some of the key indicators that are included in the charts. Regardless of the brick size (10,25, or 50), all charts will have the same configuration.
DEMA (12-period and 20-period) : These moving averages are designed to react more quickly to price changes than a traditional simple moving average (SMA). The 12-period DEMA is black, and the 20-period DEMA is red. We would look for the 12-period DEMA to cross above the 20-period as a potential bullish signal and below as a bearish signal. As you examine the charts going forward, pay close attention to these two when comparing them to the dynamics of the brick patterns.
SMA (20-period) with Blue Dots : This moving average is plotted with blue dots and provides a visual indication of the longer-term trend. It's smoother and slower to react to price changes compared to the DEMA.
WMA (9-period) on the 20-period SMA (Purple Line) : The WMA is used to confirm trends and reversals. When the WMA is above the SMA, it may indicate an uptrend, and vice versa for a downtrend.
In terms of support and resistance, Renko bricks make it easier to spot these levels as they smooth out minor price fluctuations. Support and resistance would be identified by areas where the price has repeatedly reversed direction.
When comparing the 12 and 20-period DEMA to the Renko bricks, look for areas where the DEMAs act as dynamic support or resistance to the price action indicated by the bricks. Similarly, the 20-period SMA and the 9-period WMA would be assessed for their interaction with the Renko bricks.
For breakout patterns, we would look for a consolidation of Renko bricks, indicated by a tight clustering of bricks without clear direction, followed by a breakout above or below this consolidation with a corresponding move in the moving averages.
Let’s identify any notable patterns or signals on the chart. We will look for:
Crossovers between the DEMAs
The relationship between the DEMAs and the Renko bricks
Potential support and resistance levels
Any consolidation patterns that might indicate breakout points
The Average Directional Index (ADX) is used to determine the strength of a trend. The value of 35 that is used is higher than the standard 20 or 25, which implies the reduced noise in Renko charts.
Here’s how you might interpret the ADX in conjunction with the DI lines:
Consolidation : If the ADX is dropping and has crossed below the 35 level, it may indicate that the trend strength is weakening, suggesting a period of consolidation or range-bound market.
ADX Below DI Lines : When the ADX drops below both the +DI (positive directional indicator) and -DI (negative directional indicator), it further suggests that neither buyers nor sellers are in control, reinforcing the consolidation signal.
Watching for a Trend Change : If after dropping, the ADX starts to turn upward while below the DI lines, it could be an early sign that a new trend is starting to form. The direction of the trend would be indicated by which DI line the ADX crosses. If it crosses the +DI, it may signal the start of an uptrend; if it crosses the -DI, a downtrend might be beginning.
To apply this to your Renko chart, you would look for periods where the ADX dips below 35 and pay attention to its direction relative to the DI lines. You'd also consider the brick color change on the Renko chart for confirmation of trend direction if the ADX starts to rise after the dip.
Keep in mind that technical indicators should not be used in isolation; they are more effective when used in conjunction with other analysis tools and techniques. Renko charts themselves filter out smaller price movements, so the ADX on a Renko chart might not react the same way as it would on a traditional candlestick chart.
Here's some ideas on how to analyze and correlate the given indicators to price action:
Renko Bricks : Renko charts focus on price changes that meet a minimum amount and filter out minor price movements, thus highlighting the trend over time. A 50-tick Renko chart will only print a new brick when the price moves by 50 ticks, thereby smoothing out minor fluctuations and making trends easier to spot. The 1-hour timeframe means that each brick represents an hour's worth of price movement.
Linear Regression Channel (1st and 2nd degree) : This tool is used to identify potential support and resistance levels and the overall trend direction. The 1st degree (linear) regression trendlines show the mean price movement, while the 2nd degree could show a parabolic trend which accounts for acceleration in price movement. The price often oscillates around the mean trendline, and deviations can be used to identify overbought or oversold conditions.
Double Exponential Moving Average (DEMA) 12 and 20 : The DEMA is a faster-moving average that reduces lag time compared to traditional moving averages. In your setup, the DEMA 12 would be more reactive to price changes, potentially serving as a short-term trend indicator, while the DEMA 20 could be used to confirm medium-term trends.
Simple Moving Average (SMA) 20 with 9 period Weighted Moving Average (WMA) : The SMA 20 is a common indicator for medium-term trend direction. When combined with the 9-period WMA, which gives more weight to recent prices, you could use crossovers between the two as potential buy/sell signals.
Stochastic Oscillators (5,3,3 and 50,3,3) : Stochastic oscillators compare the closing price of a commodity to its price range over a certain period. The 5,3,3 stochastic is a fast indicator that can signal short-term overbought or oversold conditions. The 50,3,3 stochastic, being much slower, could be used to assess the longer-term momentum of the market.
Average Directional Index (ADX) with the Directional Movement Index (DMI) : The ADX is used to measure the strength of a trend, whether up or down. The DMI includes both the Positive Directional Indicator (+DI) and Negative Directional Indicator (-DI), which help determine the trend direction. A rising ADX indicates a strong trend, while a falling ADX suggests a weakening trend.
When analyzing the chart, consider the following correlations and insights:
Renko and Regression Channel : Look for periods when the Renko bricks consistently stay on one side of the mean regression line. This could indicate a strong trend. If the price breaks through the regression channel, it might signal a potential reversal or a breakout.
DEMA, SMA, and WMA : Watch for crossovers between these moving averages. A crossover of the DEMA 12 above the SMA 20 and WMA might indicate a bullish short-term momentum, while a crossover below could signal bearish momentum.
Stochastic Oscillators : Look for divergence between the price and the stochastic oscillators. If the price makes new highs/lows but the stochastic does not confirm (known as a divergence), it could indicate a weakening trend.
ADX and DMI : If the ADX is rising and the +DI is above the -DI, the uptrend is strong; if the -DI is above the +DI, the downtrend is strong. If the ADX is falling, the trend is considered weak or the market may be ranging.
For trade setups, you might consider the following:
Long Entry : A new Renko brick in the direction of the trend, a bullish crossover in moving averages, the stochastic coming out of oversold territory, and a rising ADX with +DI above -DI.
Short Entry : A new Renko brick opposite the trend direction, a bearish crossover in moving averages, the stochastic coming out of overbought territory, and a rising ADX with -DI above +DI.
It's crucial to back test these indicators and their correlations with historical price data to validate their predictive power. Additionally, always manage risk appropriately, as indicators are not foolproof and should be used in conjunction with other forms of analysis and sound trading principles.
Part 8: Working Through Some Examples
to-follow

A Renko Trading Strategy - Part 6Part 6: How to Incorporate a Stop/Loss Strategy
Incorporating stop-loss strategies into trading using Renko charts and options involves careful consideration of market dynamics, the specific characteristics of options trading, and the unique aspects of Renko charts. Here are some approaches tailored to this trading strategy:
1. Setting Stop Losses Based on Renko Chart Reversal
Renko Brick Reversals : Since Renko charts are designed to filter out minor price movements, a reversal (change in brick color) can be a significant indicator. For options trading, consider setting a stop-loss order if there's a reversal that contradicts your position. For instance, if trading calls based on an uptrend indicated by Renko charts, a stop-loss could be triggered by the appearance of a certain number (e.g., two or three) of consecutive red bricks, signaling a potential downtrend.
Percentage of Option Value : Determine a percentage loss of the option's value that you're willing to tolerate (e.g., 30-50% of the premium paid). This approach requires monitoring the option's value relative to market movements and Renko chart signals.
2. Volatility-Based Stop Losses
Average True Range (ATR) Adjustments : Although traditional Renko charts do not incorporate time or volume, you can use an additional indicator like the Average True Range (ATR) of the underlying futures contract to set volatility-adjusted stop losses. This method involves setting a stop loss at a point where the option's underlying asset moves against your position by an amount that is significant based on recent volatility, indicating the trend might not be as strong as anticipated.
3. Time-Based Exits
Option Time Decay : For options, time decay (theta) is an important consideration. You might set a time-based stop-loss strategy where positions are evaluated for potential exit if there hasn't been favorable movement within a certain timeframe, considering the decay's impact on your option's value, especially as it approaches expiration.
4. Technical and Fundamental Stop Losses
Renko Chart Patterns : If your Renko charts show pattern breakouts or breakdowns (e.g., failure of a breakout pattern you traded on), use these as a basis for stop-loss orders.
Fundamental News: For commodities like crude oil, fundamental news (e.g., geopolitical events, supply changes) can dramatically impact prices. If such events occur and are likely to adversely affect your position, consider them as triggers for your stop-loss strategy.
5. Dynamic Stop Losses
Adjust According to Market Conditions: As market conditions change, regularly review and adjust your stop-loss levels. This dynamic approach ensures that your strategy remains aligned with the current market environment and Renko chart developments.
6. Mental Stop Losses
Disciplined Execution : While physical stop-loss orders placed with a broker are automatic, mental stop losses rely on the trader's discipline to execute a trade when certain conditions are met. This approach allows for flexibility in response to market conditions but requires strict adherence to predetermined exit criteria to be effective.
Conclusion
Creating stop-loss strategies for options trading based on Renko charts involves a blend of technical analysis, understanding of options' characteristics, and disciplined risk management. By combining Renko chart reversals, volatility adjustments, time-based considerations, and both technical and fundamental factors, traders can develop a comprehensive stop-loss strategy that protects against undue losses while allowing room for the natural ebb and flow of the markets. Regular review and adjustment of these strategies in response to market changes are crucial for maintaining their effectiveness.
Part 7: Some Examples of Analysis
to-follow
