WTI- Can it reach 50?After a few days of consolidation between 39 and 42, Oil broke above resistance and also above the recent 43 high and looks determined to continue higher.
The chart looks very constructive and with this new "vaccine" and wave of optimism crude oil could find strong bids that can drive the price to 50 old support now resistance.
As long as the price is above 43 on a daily close basis I'm bullish
Wtisignals

WTI outlookAlthough the price of Oil remains elevated, it doesn't convince me...
Rises are very well capped around 42.50-43 zone and I expect the price to tumble sooner or later.
A daily close under 41 would be the signal for bears and, considering the economic outlook, 35usd/Baril would not surprise me at all
WTI- I maintain my 37 targetWTI had a short-lived spike above resistance and this rise proved to be a false break.
Now Oil is trading just in rising trendline support and a break here should accelerate losses towards at least 37.

WTI OIL high chances to break its bearish channelPattern: Channel Down on 4H.
Signal: Buy if the Lower Highs trend-line of the Channel Down breaks (practically if the 0.786 Fib breaks), as this time the price broke the 4H MA200 (as opposed to September 18) while the MACD is on a Bullish Cross.
Target: 43.00 (the 0.918 Fib, last Resistance before a full recovery).
Most recent WTI OIL signal:
** Please support this idea with your likes and comments, it is the best way to keep it relevant and support me. **
--------------------------------------------------------------------------------------------------------
!! Donations via TradingView coins also help me a great deal at posting more free trading content and signals here !!
🎉 👍 Shout-out to TradingShot's 💰 top TradingView Coin donor 💰 this week ==> TradingSafely
--------------------------------------------------------------------------------------------------------


Are we looking at the biggest crash in the market??Based on my analysis I believe we are approaching another crash in the market, probably the biggest one yet..
NASDAQ is rising on hopes and dreams, FED are pumping money into it left right and center, and it has reached a new high. There is a considerable amount of divergence on EVERY time frame and yet price has barely gone down.
Dow Jones is approaching its previous highest high where it took a tumble
SP500 is also doing the same as DOW
And now OIL is reaching a point in the market where it previously crashed
I suspect Nasdaq will flutter around and consolidate until DJ30 / US500 and Crude OIL catch up and then everything will crumble at the same time.
I may be wrong but these are my thoughts on this madness

Oil ( WTI ) Bulls are slowing down.The bull run in WTI is definitely losing momentum.
It is evident from the fact that negative divergence is coming in play between the price structure and MACD, after the 5 legs impulsive movement.
Now the price is stuck between the key support at 34.86 and the critical resistance zone from 39.60 to 42.00 above.
I have marked the two possible scenarios:
1. The bulls giving up immediately from the current levels ( marked in yellow )
2. It may get one more push higher to the critical zone and then start the correction towards 33.60/30.30/28.40 & 24 based on the Fibo levels.

USOIL range still in playAs the API report yesterday was worse than anticipated, a small drop followed. However we can expect huge movement this week leaning towards the EOW.
Once in the range, boolinger bands can be a decent indicator amid the swings within the range. But i would advise to take precaution as the channel has been holding for over a week now signifying a move is awaiting. under 24.6 we can expect downward action with targets 23.5 & 22 and 20. upwards we can target 28.8 > 30. lets see what this range brings us and remember to use stop loss!
Check for yourself if the risk is worth the reward youre looking for and good luck out there!
Comment/ like if you appreciate the post and let me know if you are interested in short/long term views in USOIL.

WTI US OIL Outlook : High chance of a SHORT OPPORTUNITYHELLO EVERYONE, FEEL FREE TO LIKE AND FOLLOW IF YOU LIKE MY IDEAS!
First of, H1 Time frame, shows a recent bearish double top pattern that lead to a sell off to the nearest support level @ 25.00. This is followed by a SHARP REJECTION at the resistance line @ 27.70, proving to be a tough barrier to break through.
WTI is now fighting in the 25.00 - 26.00 range
Possible Opportunities:
- An hourly candle CLOSE ABOVE 26.00 followed by bullish confirmation would see WTI retest the resistance of @ 27.70, giving us a possible LONG opportunity to 27.70
- A BREAKDOWN BELOW 24.50-25.00 area of support would see us a SHORT opportunity to TP1 @ 20.60, an area of major support
As always, remember to place your stop losses and good luck!
Regards,
Gol D Roger


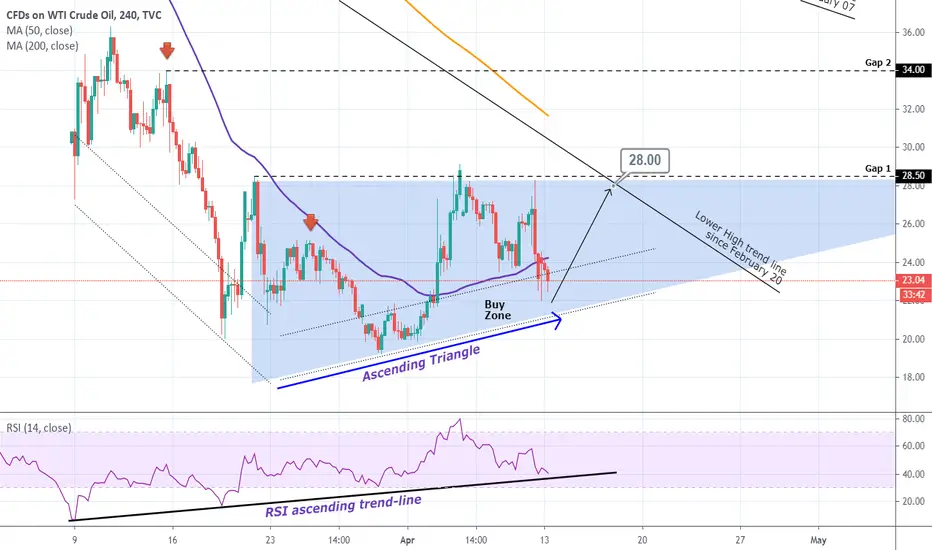
USOIL Buy SignalPattern: Ascending Triangle on 4H.
Signal: Bullish as the price has entered the Buy Zone and the RSI has been ascending since March 9.
Target: 28.00 (contact with the Lower High trend-line since February 20.
USOIL Buy SignalPattern: 1H Channel Up.
Signal: Bullish as both the Lower High resistance since March 13 and 1H MA50 broke.
Target: 27.00 (just below the 27.30 March 9 Low and symmetrical Resistance now).

USOIL Buy SignalPattern: Channel Down on 1H.
Signal: Bullish as the pattern made a Lower Low.
Target: 31.30 the current level of the 1H MA50 as per the last Lower High.
Previous signal:

USOIL Buy SignalPattern: Channel Up on 1H.
Signal: Bullish as the MACD made a bullish reversal and the price a Higher Low on the pattern.
Target: 33.80 (+9.20% based on a similar fractal).

WTI Crude Oil - updated entryThe USOil is now finding a strong support level under the previous demand area $51.
Already creating a double bottom formation, we now expect a break upwards.
The uptrend should start to form now with prices bouncing above the 50-100 EMA's.
On the retest of the $ 52 level, we can put our pending buy orders. The target is $ 59. We might close part of positions at the 200 EMA. We will monitor price action and update the idea as usual.
Traders, If you find this complete analysis on point, please subscribe for more free market analysis to come.

USOIL Buy signalPattern: Channel Down on 1D.
Signal: Bullish as the RSI is forming a bullish reversal on the 1D chart, bouncing on the 7 month Support.
Target: 59.50 (symmetrical with the last Lower High of the pattern).

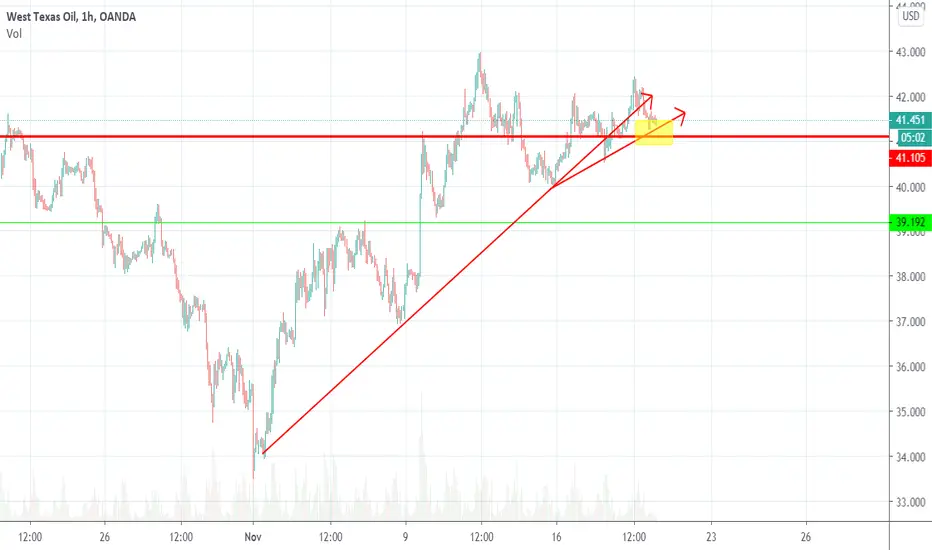
WTIUSD - LongSince 1st Nov 2019 until now, there were 3 times price bouncing regarding the RSI(14) at level of 45.
There is a potential that the price possibly bounce this time. Besides, the price is above MA200, basically we are following the trend.
Trade with care, this is just my opinion sharing to you guys !
Cheers

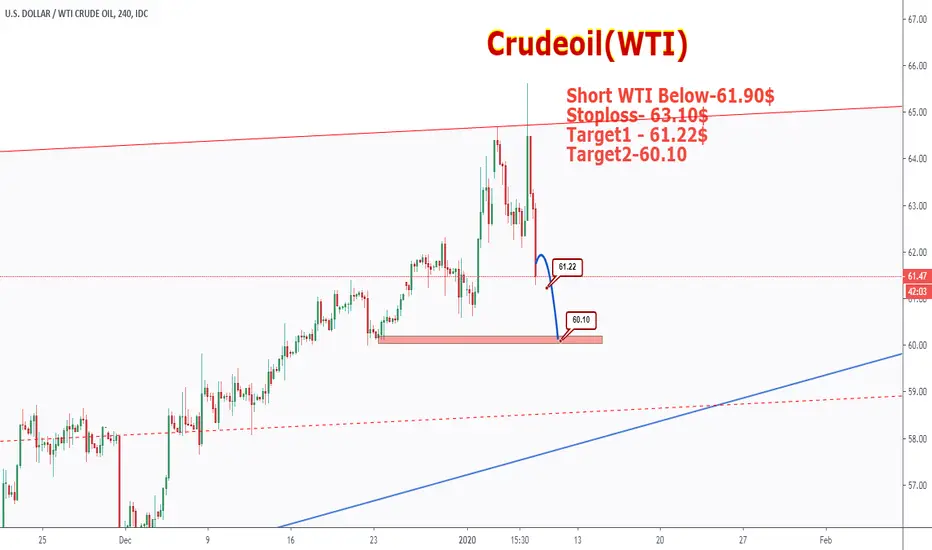
WTI OIL Buy SignalPattern: 1D Channel Up.
Signal: Bullish as group of parameters is fulfilled: 1. Reached the Higher Low of the pattern, 2. Made contact with the 1D MA50, 3. Hit the 1.3 Fibonacci retracement level after the Iran attacks, 4. The RSI is on a 3 month support level.
Target: 64.00 (Higher High trend line of the pattern) and in extension (depending on the geopolitics at the time) 66.00 (just below the 1W Resistance).
See how accurate this pattern with Supports and symmetrical Resistance levels has been in the past: