USDCAD H4 - Short SetupUSDCAD H4
Bit of a long-term forecast projection here... However, CAD seems to be gaining in strength due to recent WTI demand. Market correlation right there.
We also have DXY at a key resistance price (weekly/daily resistance), from here we can expect rejections like we have already mentioned, especially after seeing the D1 close break.
Lots of data coming up this week to start the week, but eyes peeled for something like the above. The perks are, we need the break and retest for confirmation purposes. Without this, we can't take the trade, and thus can't lose money...
Wtiusd

usdwti short for a small profit enter short in oil
with a heavy resistance above it will try to fall below today
feel free to share your thoughts in the comments

Crude Oil Price D1Here is my view for Crude Oil Price WTIUSD on D1. The price should go up, you can put a pending order on the Order block or find an entry on LTF within OB Zone. Trade Safe and happy new year!

go long in wti usd started forming a support in trend line and tryig to hold in trend line,
good place to consider buy

LONG WTIUSDLong WTIUSD, Trending up, flag Pattern,
Entry - MACD Cross
Exit - MACD Cross
Stoploss - 200EMA

WTI Crude Oil Forecast: Price Captures 50-Day EMAThe West Texas Intermediate Crude Oil market rallied on Friday to capture the 50-day EMA. That is a very good sign and it looks as if we are ready to break out. That being said, we will have to see how this plays out due to the fact that there are a lot of questions as to whether or not the lockdowns are going to be an issue. At this point, it does not seem to be as big of an issue, so the question now is did we see the massive selloff due to fears of the omicron variant, or are there are concerns about slowing growth in general?
When you look at the chart, you can see that the $73 level had offered quite a bit of resistance, and now that we have broken above there, it does suggest that we are ready to continue going higher. At this point, I would anticipate a move towards the $79 level, which is where the wipeout candle came into play several weeks ago. Getting to the top of that would be a very bullish turn of events for the crude oil market, and it certainly looks as if we could make that move based upon the fact that there really is not much in the way of resistance between here and there other than the 50 day EMA where we are currently sitting. That is only psychological at best, so it is very likely that we are going to continue grinding away to the upside.
If we do pull back from here, I think that the $73 level should offer a certain amount of support as it had been previous resistance, so “market memory” could come into play. If we turn around and break down below the $73 level, then we may have to reset at much lower levels, but right now that does not look like it is the most likely of outcomes. Looking at this chart, it looks to me like the recovery has been very strong, and I think the momentum will continue to pick up. Over the next couple of days, I would anticipate more of a back-and-forth type of situation, but by the time we get back to work in January, we could go much higher.

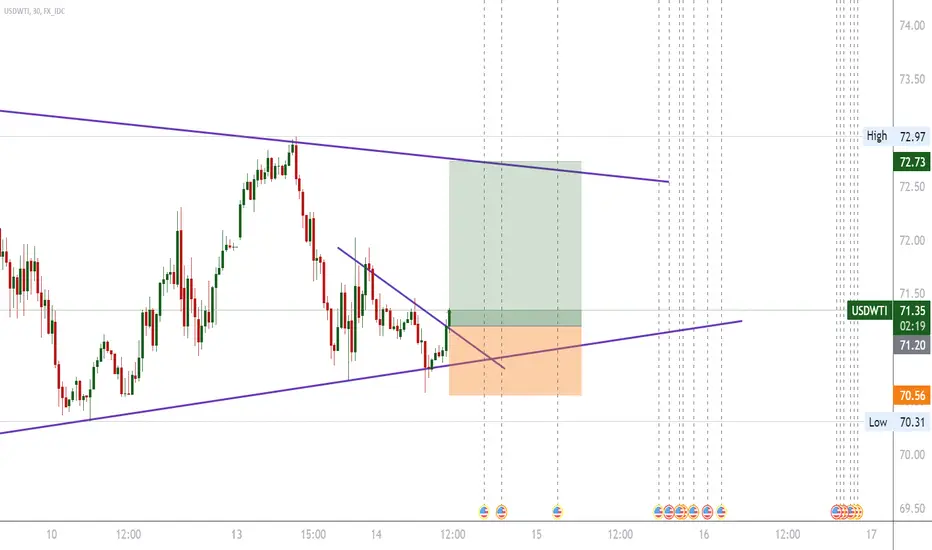
USDWTI H4 - Short SetupUSDWTI H4
Still in that lower low lower high sequence as highlighted in the above rundown.
The first trading zone offered just 1R, enough to bullet-proof and eliminate risk. Price pushed beyond resistance and we are now back on that 71.50/b.
If we see rejections from here, we could trade back down towards sub 70/b and respectively 65.

USOIL LongHey Traders, in tomorrow's trading session we are monitoring USOIL for a buying opportunity around 70.3 zone. USOIL have formed a bullish flag. Once we will receive any bullish confirmation the trade will be executed.
Trade Safe, Joe.

USDWTI H4 - Short SetupUSDWTI H4
This setup is still valid, we are still within that latest lower low and lower high sequence, we just popped higher above our H4 trading zone.
Looking for a break of 71.00 and subsequent retest of 71.50 on the hourly to allow for the break and retest play on the hourly timeframe.

OIL will ranging, and after will broke resistance for the upside(2 ideas on chart)
Wait for FOMC and enter LONG only after you see an uptrend
Targets on chart
StopLoss for Longs, must be at sell zone
Stoploss for shorts, must be at buy zone.
Be carefull, patient and discipline.
This post does not provide financial advice. It is for educational purposes only! You can use the information from the post to make your own trading plan for the market.
But you must do your own research and use it as the priority. Trading is risky, and it is not suitable for everyone. Only you can be responsible for your trading.
Good trades to All.

Crude Oil Price on H4Here is my view for WTIUSD / Crude Oil Price on H4. The price should go down, you can put a pending order on the Order block or find an entry on LTF within OB Zone. Trade Safe!

OILOl on a small correction, soon will be for upside again.
Targets on chart
Be carefull, patient and discipline.
This post does not provide financial advice. It is for educational purposes only! You can use the information from the post to make your own trading plan for the market.
But you must do your own research and use it as the priority. Trading is risky, and it is not suitable for everyone. Only you can be responsible for your trading.
Good trades to All.

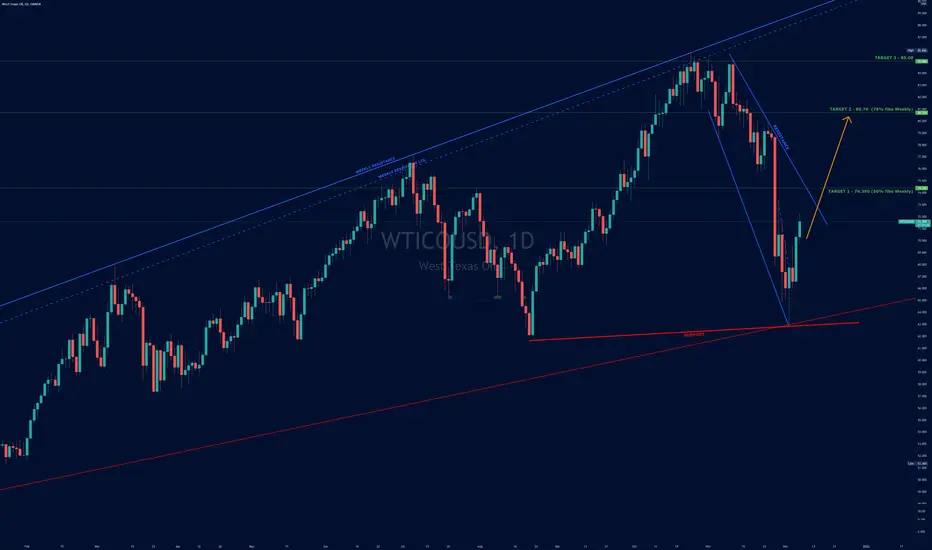
WTI Oil can rise above 80 (again)From 25th October's high at around 85, Oil has started to correct and dropped to strong demand zone between 62 and 65.
Now, this correction seems to be over and we can have a leg up above 80 again.
I'm bullish as long as the price is above 65 and, in my opinion, dips should be bought

WTIUSD Idea On M15Here is my idea for WTIUSD on M15. The price should go down, you can put a pending order on the Order Block. Trade Safe!

Oil BullishOil Still Bullish after MA200 Daily broke.
Targets on chart
Be carefull, patient and discipline.
This post does not provide financial advice. It is for educational purposes only! You can use the information from the post to make your own trading plan for the market.
But you must do your own research and use it as the priority. Trading is risky, and it is not suitable for everyone. Only you can be responsible for your trading.
Good trades to All.
USOILHey Traders, above is a technical overview on USOIL and the most important zones to take in consideration.
Trade safe, Joe.

Crude Oil ForecastHere is my view for Crude Oil on H1. The price should go up, you can put a pending order on the Order block or find an entry on LTF. Trade Safe!


WTIUSD Pattern on H1Here's my idea for WTTIUSD. It should be going bullish. When reaching Order Block, it's your area to look out for. You can take 10R. Safe Trade!


USOIL Bearish retracement on the daily time frameUSOIL is ultimately bullish however, I believe that we will see a retracement to $72.61 a barrel due to it's previous pullbacks to the bullish trendline as we have experienced in the past few months
Please catch the live analysis here.

