US OIL (WTI/USD) – Week 14 – Medium-term bearish.On Thursday, the OPEC+ alliance decided to gradually increase the production starting from May in order to keep crude oil prices in check.
Last week, WTI corrected and almost reached the resistance target that we forecasted in our previous analysis.
Next week, we expect the price to reach the resistance area highlighted on the chart, before falling towards to support area located in the mid-’50s.
Trade with care.
Best regards,
Financial Flagship
Disclaimer: The analysis provided is purely informative and it should not be used as financial advice. Remember that you need a plan before you start trading; so, take this knowledge and use it as a guidebook that will ultimately help you understand the market and easily predict your next move.
Wtiusd

WTI 1h Trading IdeasThankyou for reading this :)
1° Operation:
Long Idea
Entry Level: 59.66$
TP: 63.30$
SL: 59.03$
2° Operation:
Short Idea
EntryLevel: 63.30$
TP: 60.16$
SL: 64.87$

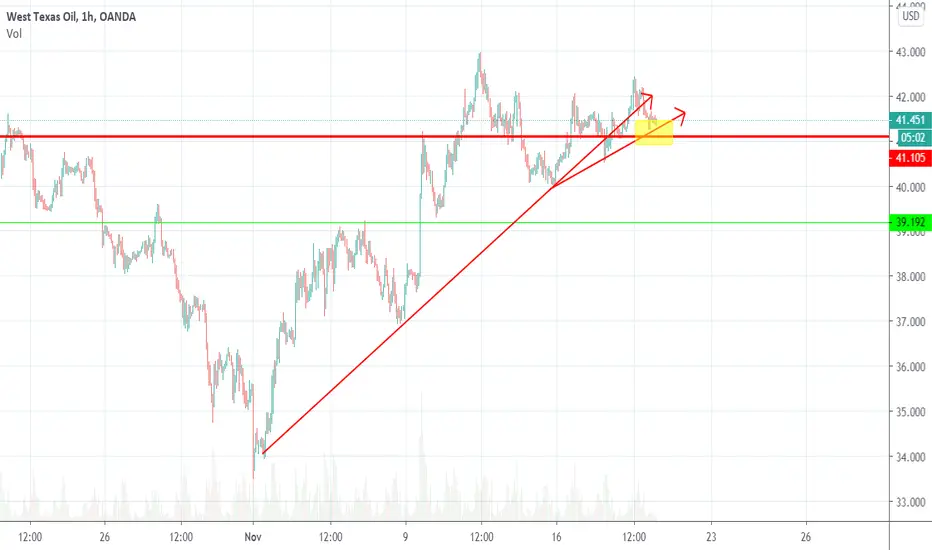
OIL on an uptrendOIL on an uptrend
Good luck for your trades.
This post does not provide financial advice. It is for educational purposes only! You can use the information from the post to make your own trading plan for the market.
But you must do your own research and use it as the priority. Trading is risky, and it is not suitable for everyone. Only you can be responsible for your trading.

WTI on the verge of a reversal?The rally of black gold in the form of the oil price, especially the WTI grade, peaked at the beginning of the month in the direction of the USD 70.00 mark. The appreciation, which became increasingly pronounced with the breakout at the end of 2020, ended just before this. The support level around USD 59.00 per barrel was fiercely contested these days. However, with yesterday's price weakness, after the impulse recovery from the talk, WTI oil is again at a stalemate. If new lows can be prevented, there could be a rapid upward movement to USD 62.00 and beyond to USD 66.00 as part of the defence of the upward trend line since December. The USD 70.00 mark would be within reach again.
Below USD 57.40, on the other hand, a further downward wave to the next support at USD 52.00 would have to be expected. A dip below this would be critical. Contrary to the actually bullish seasonality, there could then be further declines to 48.00 and 46.00 USD.
If you liked the analysis, we would be pleased if you liked or subscribed to it. You will be supporting our work enormously!
Notice:
Despite careful analysis, Global Investa assumes no responsibility for the content, timeliness, accuracy or completeness of the information provided. In particular, the information provided does not constitute investment advice, a recommendation to buy or investment brokerage and can in no way replace investor- and investment-appropriate advice from a professional investment advisor who takes into account the client's individual economic circumstances and level of experience.

US OIL (WTI/USD) – Week 12 – Bigger degree correction.WTI dropped nearly 10% as short-term demand concerns and a rising dollar clashed to cause the biggest intraday plunge since October.
For this week we expect a corrective move towards the resistance area highlighted on our chart, before resuming the downtrend and breaking the trendline.
The bigger degree correction that we were expecting for a few weeks has started and we expect the price to continue dropping into the mid 50’s.
Trade with care.
Best regards,
Financial Flagship
Disclaimer: The analysis provided is purely informative and it should not be used as financial advice. Remember that you need a plan before you start trading; so, take this knowledge and use it as a guidebook that will ultimately help you understand the market and easily predict your next move.

US OIL (WTI/USD) – Week 11 – Support zone targeted.Nothing much has changed in regards to our previous analysis for Oil. The price dropped at the start of last week, before gaining some bullish strength.
For this week we expect the price to test the support zone highlighted on our chart, before gaining more bullish momentum. Medium-term, due to the fact that we are in a very bullish trend that started in April 2021, we anticipate that a bigger degree correction will soon take place.
From a technical perspective, the price reached a strong weekly resistance area and we anticipate it to hang around this area for a while, entering a corrective phase that can drive the value of this commodity towards the $62 area.
We recommend focusing on other instruments for now, as the bullish momentum is still strong and the price may continue to rise.
Trade with care.
Best regards,
Financial Flagship
Disclaimer: The analysis provided is purely informative and it should not be used as financial advice. Remember that you need a plan before you start trading; so, take this knowledge and use it as a guidebook that will ultimately help you understand the market and easily predict your next move.


Oil Production Held Largely SteadyOPEC-JMMC meeting expected to conclude with oil production hike.
Oil prices in February celebrated Saudi Arabia’s voluntary cut of oil production in February and March by 1 million barrels-per-day (bpd), climbing to a 13-month high. However, oil prices started this month with a retracement just days before the OPEC-JMMC meeting. With oil prices rising back to the pre-Covid levels, the market was expecting Saudi Arabia to end its voluntary cut, with the OPEC potentially increasing production by up to 1.3 million bpd starting from April. Furthermore, the OPEC+ was expected to increase production by 500,000 bpd.
A surprise from OPEC+.
To the surprise of the market, Saudi Arabia held its 1 million bpd of voluntary oil production cut into April. Most of the OPEC+ members agreed to continue at the current production level except for Russia and Kazakhstan, where they will be allowed to increase production by 130,000 and 20,000 bpd respectively. As a result, oil prices soared.
Despite the progress made in the recovery of the oil market, the OPEC and its allies are well aware of the existing uncertainties surrounding the demand. The recent discovery of a new variant of the COVID-19 virus that led to the resumption of lockdown measures in certain parts of the world proved how the demand of oil can be easily impacted. Just two weeks before the March’s meeting, Saudi Arabia warned members of the oil alliance against complacency as uncertainty is very high and that extreme caution is necessary.
U.S. shale not a threat to oil prices.
For several months now, Russia has been trying to persuade Saudi Arabia to increase oil production, worrying that a continued rise in oil prices will impact its affordability, thus causing a switchover in demand from oil to U.S. shale. However, during the recent OPEC-JMMC meeting, Saudi Energy Minister Prince Abdulaziz bin Salman expressed confidence that the rise in oil prices now will not bring back the glory days of U.S. shale that transformed the global energy industry. If that is the case, the OPEC+ will be able to take oil prices to a higher level and take control of a major market share. However, if the Energy Minister is wrong about the U.S. shale, then the consequence of a reduced demand will potentially lead to a collapse in oil prices.

CRUDE OIL (WTI/USD) – Week 8 – Bulls not letting go.Last week, Oil fell the most in nearly a month, suffering from a deep market selloff in sync with the current energy crisis in the U.S. that will likely keep refineries shut for another week, lowering the demand.
In the past few weeks, our technical perspective inclined towards a bearish move and it looks like it has been finally triggered. At the moment we are consolidating underneath the trendline and we expect the selloff to continue in the coming days.
Trade with care.
Best regards,
Financial Flagship
Disclaimer: The analysis provided is purely informative and it should not be used as financial advice. Remember that you need a plan before you start trading; so, take this knowledge and use it as a guidebook that will ultimately help you understand the market and easily predict your next move.

WTIUSD correction takes longer.WTIUSD correction takes longer. Continuing the previous analysis, the correction movement forecast needs to be modified. The long-term uptrend has not changed, but the decline on Friday last week predicts a further fall. My assumption is that the correction persists up to the lower ATR axis (white dotted line). You can turn north again by touching this axis. This level can be 55.67usd. However, due to the increased correction distance, as the ATR also increased in the meantime, the target price will also increase. Therefore, the rise after the correction motion is completed increases from 67usd to 72usd. So at the new target price: 72,062usd.

CRUDE OIL (WTI/USD) – Week 7 – Bulls not letting go.WTI gained $1.23 to settle at $59.60 a barrel, rising the most from the beginning of the year. The sign of inventories declining in the U.S. and around the world point to the success that the OPEC+ has had in draining an oversupply left in the wake of a historic demand drop due to the COVID-19 pandemic.
We will cautiously monitor this pair as we still expect a deeper bearish consolidation that can drop the price towards our trendline.
We kindly recommend for this week that you concentrate on other instruments since we don’t have any confirmation that the bearish move will start.
Trade with care.
Best regards,
Financial Flagship
Disclaimer: The analysis provided is purely informative and it should not be used as financial advice. Remember that you need a plan before you start trading; so, take this knowledge and use it as a guidebook that will ultimately help you understand the market and easily predict your next move.

CRUDE OIL - Detailed Video Top-Down AnalysisHello everyone, if you like the idea, do not forget to support with a like and follow.
Here is the top-down analysis for CRUDE OIL, feel free to request any pair/instrument or ask any questions in the comment section below.
Best of luck!

USOIL WTIUSD Crude Technical Analysis & Trade IdeaCrude oil has traded into major resistance, it's fairly overextended and we could be looking at a possible trend reversal or at least more consolidation and a decent retrace in my opinion. I'm looking at building shorts around 57-58 with the aim of taking 2/3 of my position off the table fairly early and leaving a third of my position to run to see if we gain some distance to the down side. Video explains all.

WTIUSD minor correction expected.WTIUSD minor correction expected. My analysis assumes that the correction that has just begun will continue. The correction may decrease to the D1ATR50% level. Then I expect another rise. Target price: 66.35 usd


WTIUSD or Crude Oil or USOil Long IdeaWTIUSD or Crude Oil or USOil Long Idea from our strong Support Level.
Trading Levels : »53-52 | 51-50 »Risk=0.5point | TP = 54.5
Fundamental Imp—As predicted more stimulus talk $1.9 Trillion by Biden push OIL in bull mode from our levels, next TP=54.50/56.00
PREVIOUS RESULT—Enjoy PRECISE LEVEL1=52.2 to 53.8=1.6point gain=24hrs

OIL WTI Targets $50 Next? Watch Video!Where is OIL WTI headed next?
Our previous tradingview analysis on OIL has offered us and our followers a highly profitable low risk swing trade. Watch the video to learn more about the next trade we will be taking in this market.
If you'd like to learn a trading approach with edge that will help you be consistently profitable, make sure you give us a 'like' and 'follow' so you don't miss any upcoming analysis.

Oil outlookOil made a new high post negative territory above 45usd/barrel and for 2 weeks now is staling in this zone.
I think at least a correction is just around the corner and WTI could fall to 43, to say the least.
A confirmation for sellers comes with a break under 45.
I'm looking to sell it


An important point for oilThis week will be important for WTI. From a fundamental point of view, we expect news related to production.
Technically, we expect a break in the current consolidation and the break will determine the direction of entry.
At the moment, the more probable scenario seems to be a break of the support at 44.66 and a continuation of 43.30!
In order to confirm the trade, it is recommended to look for an entry after the break!
If the resistance breaks, we would expect the upward movement to continue.
If you have questions about how to trade this or another situation, contact us!
To support us, like and comment!

Usoil - looking for a long entrywaiting for a retest of the major support line and looking for entries on any bullish candles.

WTI- Can it reach 50?After a few days of consolidation between 39 and 42, Oil broke above resistance and also above the recent 43 high and looks determined to continue higher.
The chart looks very constructive and with this new "vaccine" and wave of optimism crude oil could find strong bids that can drive the price to 50 old support now resistance.
As long as the price is above 43 on a daily close basis I'm bullish

WTI outlookAlthough the price of Oil remains elevated, it doesn't convince me...
Rises are very well capped around 42.50-43 zone and I expect the price to tumble sooner or later.
A daily close under 41 would be the signal for bears and, considering the economic outlook, 35usd/Baril would not surprise me at all