CRUDE OIL video top-down AnalysisHello everyone, here is the top-down analysis for CRUDE OIL, feel free to request any pair/instrument or ask any questions in the comment section below.
Best of luck!
Wtiusd

Us crude Oil ( WTIUSD) ANALYSIS 27 OCT 2020Hi Assalam-o-Alaikum , Dear GooD Afternoon Hope you are well and enjoing your trading , i'm here with my new analysis of WTIUSD
US Crude Oil (WTIUSD ) Current price is 3921.7
Current Resistence level is 3927.4
Current Support level is 3843.3
If Market Breaksout the Resistence level and Close on above this level we can enter in Buy Trade as Case 1 in Chart , Alternatively if Market Breaksout the Support level we can enter in sell here as case 2 in Chart
I hope my analysis will help you in your trading best of luck
share your point of view about WTIUSD in comments , Thanks

WTI- Sell rallies above 40From the beginning of September, WTI is trading in a range between 36 support and 41.50 resistance.
At this point, Oil is trading on the upper side of the range and we have a nice opportunity to enter short for a 400 pips profit target.
In my opinion prices above 40 should be sold and only a daily close above 42 would change my bearish opinion

USOIL BullishChart analysis suggests double bottom formation and trend continual, there fore it's short term bullish and beneficial for day traders.

WTI outlookAfter correcting to 37 zone, WTI has entered in a range with a top above 41.50 and a bottom at 37 zone.
Now oil is traded near the top of the range and we could have a nice selling opportunity with a R:R of more than 1:3

DOUBLE BOTTOM IN OIL + EMA resistancesGood day friends..Give us a thumbs up if you like our idea.Follow my profile to get new ideas and trade setups everyday
OIL
Due to the weaker demand in the Global market Oil felled towards the 36.12 which is the September low and then its formed a triangle pattern and went bullish up to 41.43 and traded in a range from September 17 to October 01 and again felled towards 36.63 and formed a dissimilar double bottom
Currently the 200 EMA is acting as resistance for the bull and 50,100 EMA is acting as support for the bull. And my bias is towards the bullish side and the primary target would be around 43.00 which is a swing high area stop lose may placed below the 38.45 price action level
OIL is currently in a consolidation phase if the price well above the 39.50 psychological level we can buy the oil.
Disclaimer
Its a forecast of the next expected moves Not a financial advice


WTI OIL ANALYSIS - HOW TO PREDICT THE NEXT BIG MOVESTake a look at our previous Oil ideas and how precisely the levels have been working for us.
If you want analysis on other assets you can feel free to contact us.
FXPROFESSOR

USOIL Retesting the Lower Boundary
Welcome!
What's up traders! Thanks for Jumping back on my Analysis, 👨💻 Trader champ is here behind the charts, Hit the thumbs up 👍 and support the work
Follow the trade plans and notes. Sketch up your own trade setup and make sure you meet with the required confirmations first, before you make your move!
________________________________________________
Traders Disclaimer: Non of our analysis or trade setups which is shared here on trading view is a trading advice. As we keep on weekly updates with our predictions and expectations. We may take them as a trades only if trade setups meets the required criteria ( Confirmations ). We will never make a move or look back if trade setup invalidates with price action or future economical movements. Understanding the markets is the key behind all success stories. So never miscalculate under estimate anything which is out of your bounds. Take them at your own risk as trading is highly risky and you may loss your investments.

WTI CRUDE Next Move , Dont miss this !Hi Traders, here is the full UPDATED Analysis / Breakdown for WTI / USOIL.
HIT THAT LIKE AND FOLLOW BUTTON!
A like & a Follow or comment is a Free way to Show your support!
Conditions -
1.Wait for confirmation(Wait For Price Action Confirmation / Market Environment Change )
2 .Use Risk Management (Risk 1% of your capital)
3.Do your Own analysis!
4.Follow for more Analysis like this!
Your Support is Appreciated!
See You in the next Educational Video / Analysis
#likeandfollow

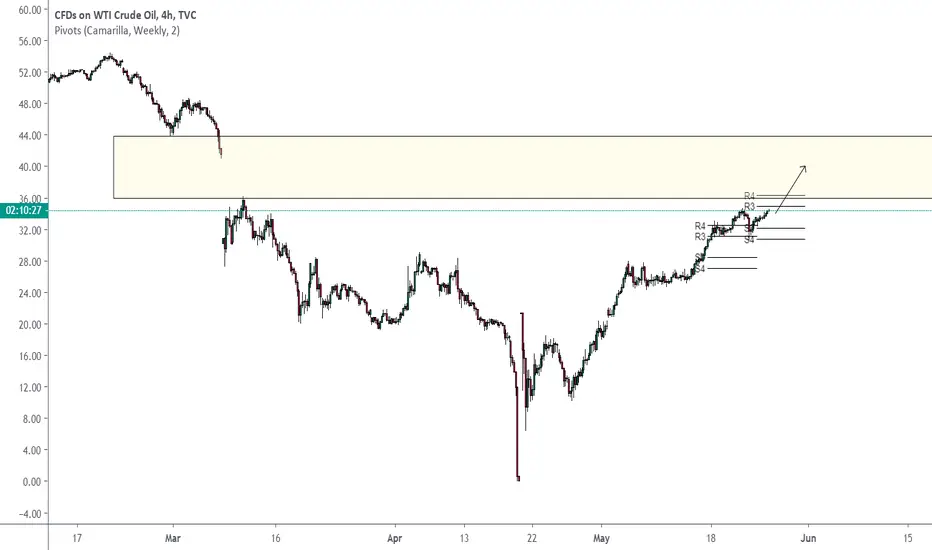
Liftoff!! 🛫Crude oil prices continue to rise after reaching our target area (marked in yellow).
After the Joint Ministerial Monitoring Committee (JMMC) of the OPEC+ met on Thursday, Saudi Arabia made a strong appeal to members of the OPEC+ oil consortium. Saudi Oil Minister Prince Abdulaziz bin Salman warned that "full compliance is not an act of charity" and noted that any attempt at overproduction was "doomed to failure".
As long as the bulls hold above $38.45, we continue to be bullish and see the next target in the range of $42.90.
The alternative scenario has a probability of 30% and needs to be included in all trading decisions as long as WTI stays below $43.80. Above the resistance zone, the alternative scenario is neutralized. Which, at the same time, paves the way towards the next target, around $50.
🤞 Feel free to comment and share your opinion. 🤞🏿


USDWTI Market Structure AnalysisNote the high pressure from sellers!
If it is useful for you, support that with your likes/comments and if you have your market view, please share it in comments
also, you can ask me questions...
Have a great day everyone!

Gap closureCrude oil is likely to move somewhat higher to close the gap to ca. 40.
For educational purposes only.

WTI . Weekly Technical Analysis UpdateMidterm forecast:
While the price is below the resistance 43.60, beginning of downtrend is expected.
We make sure when the support at 30.85 breaks.
If the resistance at 43.60 is broken, the short-term forecast -beginning of downtrend- will be invalid.
Technical analysis:
There is a divergence in RSI and price between the peak at 40.565 on 2020-06-08 and the peak at 43.595 on 2020-08-05, the probability of uptrend continuation is decreased and the probability of beginning of downtrend is increased.
While the RSI support #1 at 52 is not broken, the probability of price decrease would be too low.
A peak is formed in daily chart at 43.60 on 08/05/2020, so more losses to support(s) 42.30, 38.85, 37.15 and minimum to Major Support (30.85) is expected.
Price is above WEMA21, if price drops more, this line can act as dynamic support against more losses.
Relative strength index (RSI) is 60.
❤️ If you find this helpful and want more FREE forecasts in TradingView
. . . . . Please show your support back,
. . . . . . . . Hit the 👍 LIKE button,
. . . . . . . . . . Drop some feedback below in the comment!
❤️ Your Support is very much 🙏 appreciated!❤️
💎 Want us to help you become a better Forex trader?
Now, It's your turn!
Be sure to leave a comment let us know how do you see this opportunity and forecast.
Trade well, ❤️
ForecastCity English Support Team ❤️

WTI . Important Technical Analysis UpdateMidterm forecast:
. While the price is below the resistance 43.60, beginning of downtrend is expected.
. We make sure when the support at 30.85 breaks.
. If the resistance at 43.60 is broken, the short-term forecast -beginning of downtrend- will be invalid.
Technical analysis:
. There is a divergence in RSI and price between the peak at 40.565 on 2020-06-08 and the peak at 43.595 on 2020-08-05, the probability of uptrend continuation is decreased and the . probability of beginning of downtrend is increased.
. While the RSI support #1 at 52 is not broken, the probability of price decrease would be too low.
. A peak is formed in daily chart at 43.60 on 08/05/2020, so more losses to support(s) 38.85, 37.15, 34.60 and minimum to Major Support (30.85) is expected.
. Price is above WEMA21, if price drops more, this line can act as dynamic support against more losses.
. Relative strength index (RSI) is 58.
❤️ If you find this helpful and want more FREE forecasts in TradingView
. . . . . Please show your support back,
. . . . . . . . Hit the 👍 LIKE button,
. . . . . . . . . . . Drop some feedback below in the comment!
❤️ Your Support is very much 🙏 appreciated!❤️
💎 Want us to help you become a better Forex trader?
Now, It's your turn!
Be sure to leave a comment let us know how do you see this opportunity and forecast.
Trade well, ❤️
ForecastCity English Support Team ❤️
WTI . Important Technical Analysis Update


CRUDE - heading to an interesting SHORT Zoneis this the final excess on CRUDE before the first major correction since the run ? Lets see if we get a TOP around 45 ! no confirmation yet
no financial advise, only my idea !

WTI OIL / BULLFrom what I can see price is still bullish, we have bullish divergence on a 4H and price has broken through resistance
It is now testing a trend line on the 4H and once it breaks, i am looking for a retest before buying to the level where it plummeted previously

WTI OIL- to dive to 35?For 2 months now, Crude Oil is trading in a rising wedge with tops very close to each other.
I believe that Oil will take a dive to 35 soon and I favor short positions as long as the price stays under 43

Crude Oil Long (WTI)After price spkiked down it immediatly yanked up. NOw price is coming to fill this area before making a move up.
