Short crude oil when reboundingBecause the market is vigilant about frequent and more substantial interest rate increases by the Federal Reserve, concerns about the global recession have increased, and the global stock market has generally weakened, which has dragged down oil prices.
On the daily chart, oil prices continued to weaken in the short term, and fell back after the rebound in the previous trading day was blocked, suggesting strong selling pressure above.From the technical structure point of view, oil prices have still been in a wide fluctuation trend in recent months, and at the same time, they have also formed a short-term wedge-shaped consolidation trend to make a transitional market before the direction is chosen.The current support and strong support for oil prices are the 74.3 line on the wedge-shaped extension cord and the 72.3 line on the extension cord of the shock box below. The resistance above the short period is at the 76.5 line, and the stronger resistance is at the 77.6 line at the intersection of the short-period moving average and the Bollinger band.
In order to facilitate everyone to continue to follow up on my analysis and sharing, you can like and follow me; in addition, I will share the daily real-time strategy in the channel. If you can't follow up in real time, you may make operational errors.You can use the following methods to enter my channel for free to follow the latest news and follow up on market trends in real time.
Wtiusd

Oil prices have stopped falling, and the bulls are back?Crude oil was suppressed by fundamentals and high pressure. Yesterday, the daily line fell all the way, and finally the daily line closed the negative line. Crude oil currently continues to maintain a wide range of oscillations on the daily line. The 4-hour level trend is also after a continuous decline. The current deviation rate is slightly too large, and the technical patterns on the small-cycle trend are also beginning to be gradually repaired, and there is a high probability that there will be some room for rebound and repair in the short-term trend.On the news side, short-term attention will be paid to Powell's further remarks and EIA data within the day.
Operationally, crude oil is recommended to be short at 78.3, below the target of 76.6.
In order to facilitate you to continue to follow up on my analysis and sharing, you can like and follow me. In addition, you can enter my channel for free in the following ways to follow real-time views and operational strategies.
TVC:USOIL TVC:GOLD FOREXCOM:XAUUSD

The morale of crude Oil bulls is strong, breakthrough!Fundamentals:
On Tuesday (March 7), international oil prices tended to fluctuate.Previously, the UAE's withdrawal from the Organization of Petroleum Exporting Countries was proved to be untrue, and there was a need for technical correction after the surge in oil prices.And cautious investors are waiting for Fed Chairman Powell's upcoming testimony later this week.However, signs of China's economic rebound have prompted Saudi Arabia to continue to increase its prices in Asia, bringing support to the oil market.
Technical aspects:
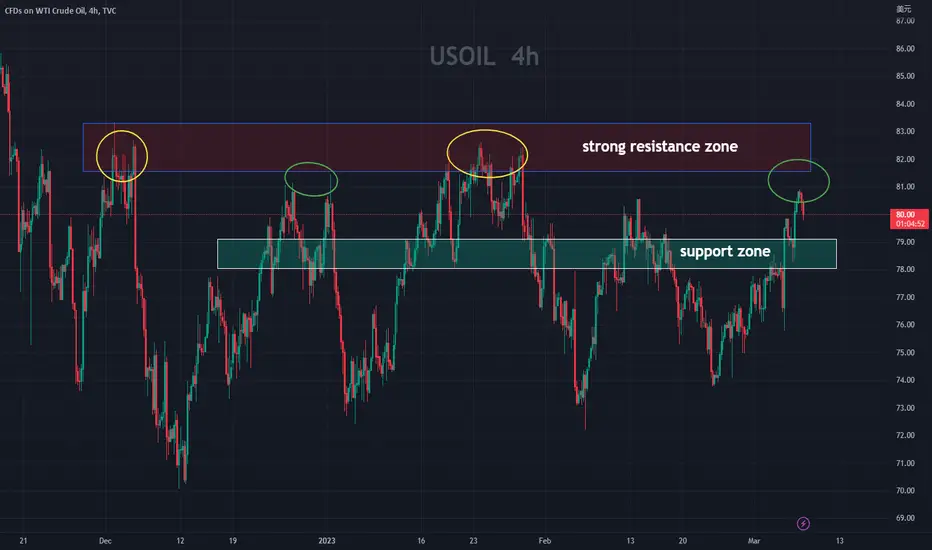
At the daily level, after oil prices have risen for five consecutive trading days, oil prices have initially stood above the 80 integer mark. The daily line has gotten rid of the downward trend channel, and the opening of the technical indicator Bollinger band continues upward. MACD golden fork, KD stochastic indicator golden fork, technical bullish signal continues, if it can withstand the short-term pullback pressure, it is expected to continue to oscillate higher, the initial resistance is near the Bollinger band rail 82; further strong resistance is near 83, which is where the top of the box that has oscillated extensively since the end of November is located. If it breaks further, it will increase the medium- and long-term bullish signal.
At the 4-hour level, oil prices as a whole are still in the channel of rebounding upward trend, but they are still suppressed by the short-term moving average, and the KD stochastic indicator sends a short-term overbought signal. It is still necessary to beware of the risk of short-term oil prices falling back.However, the short-term volatility here is still within the normal range, which is a technical repair to the short-term rally, and the 79 position of the 20-day moving average below has been transformed into a preliminary support position. If this position is lost, it can be judged to weaken the bullish signal in the future.
Taken together, today's short-term crude oil operation ideas are mainly based on stepping back and lower, supplemented by rebounding high altitude, which can be done at the 79 position and the target position is 80.5

Oil: Go long on this range.
After analyzing the 4-hour chart of crude oil, it is found that yesterday's market first fell and then rose, rebounding after reaching support near 78. In the short term, it has broken through resistance at 79 and 80 and now support has formed around 78 and 79. If there is a substantial breakthrough and stabilization around 81.5, there is a high probability of further rising towards the strong resistance level near 83. However, the market currently needs further consolidation and momentum to complete the potential breakthrough, so we recommend shorting at higher levels and going long at lower levels.
The specific recommendations are as follows:
short around 81-80, long around 79-78, with a stop loss of 70 points and a take profit of 200 points for each.
OIL shaping upOil spot is looking promising for a short term buy into a short position at the top of the range. ill be looking for a impulse and continuation pattern to get involved long, whereas the short position will need a strong rejection and break down. Risk management and patience are king!

WTI: Safety net 🧗Although the Oil might need a little persuasion, we're expecting the course to drop below the support line at $70.08 to continue with the downwards slope of the blue wave within the green target zone. Once completed, the blue wave should pump the course back up, before it ultimately hits the corrective low of the green wave .

USOil | New perspective for the week | Follow-up detailThis is a follow-up video to last week's analysis as we were able to scoop over 1,200 pips profit (see link below for reference purposes). Thursday's data showed that U.S. CPI inflation eased in December 2022 and this data appears to be firing a bullish momentum as risk appetite for the Oil appears to have been bolstered. Last week's trading session witnessed a rise of approximately 7.00% to close the week around the $80 zone - a good sign of recovery. So, from a technical standpoint; the $80 Level shall be our yardstick for trading activities this week and this video gives a detailed illustration of what to look out for to either buy or sell the USOil for this week.
Disclaimer:
Margin trading in the foreign exchange market (including commodity trading, CFDs, stocks etc.) has a high risk and is not suitable for all investors. The content of this speculation (including all data) is organized and published by me for the sole purpose of education and assistance in making independent investment decisions. All information herein is for your reference only and I take no responsibility.
You are hereby advised to carefully consider your investment experience, financial situation, investment objective, risk tolerance level, and consult your independent financial adviser as to the suitability of your situation prior to making any investment.
I do not guarantee its accuracy and is not liable for any loss or damage which may result directly or indirectly from such content or the receipt of any instruction or notification therewith.
Past performance is not necessarily indicative of future results.

Going short on West Texas Crude OilThe commodity just broke its major support trend line, additionally the formation of lower high and divergence support an upcoming bearish rally.

USOil | New perspective for the new year | Follow-up detailThe prices of US Oil witnessed an unstable swing in 2022; climbing on tight supplies amid the war in Ukraine, then rapidly sliding during the later part of the year on weaker demand from top importer - China and worries of an economic contraction, but closed the year on Friday with a second straight annual gain a little above the $80 (as against $75 in 2021). This video is an illustrative dissection of the chart from a technical standpoint where the $80 mark will serve as a guide for trading activities in the new year.
00:20 USOil Technical analysis on Weekly chart
02:40 USOil Technical analysis on Daily chart
08:30 USOil Technical analysis on 4H Timeframe against next week
10:00 Conclusion on next week's expectation for the USOil
Disclaimer:
Margin trading in the foreign exchange market (including commodity trading, CFDs, stocks etc.) has a high risk and is not suitable for all investors. The content of this speculation (including all data) is organized and published by me for the sole purpose of education and assistance in making independent investment decisions. All information herein is for your reference only and I take no responsibility.
You are hereby advised to carefully consider your investment experience, financial situation, investment objective, risk tolerance level, and consult your independent financial adviser as to the suitability of your situation prior to making any investment.
I do not guarantee its accuracy and is not liable for any loss or damage which may result directly or indirectly from such content or the receipt of any instruction or notification therewith.
Past performance is not necessarily indicative of future results.

Selling West Texas Crude OilThe security shows continuation of it's bearish trend after a sharp bounce from its bearish trend line. Sellers can seek the opportunity to sell on the dip till the next respected trend-line support of 67.7.
(please note: the energy is formed a falling wedge pattern and might change its trend into bullish, so be mindful).

Bearish Projection on WTI After breaking of an ascending wedge pattern, the prices are likely to remain bearish until the projected price of 77.23.

Going Short in WTI USDHello Traders
WTI USD CFD Forexcom.
Trend Analysis: Downward
Formation : Double Tops (AE)
Possibility : Bearish Continuation
Probability to hit tragedy: 69.00%
Trade Plan.
Long / Buy Trade.
Entry Level on the break of the Pattern NECK line at FIB support blue line @ 7580.0
Take Profit @ Pattern Projection @ 6433.0
Stop Loss @ Daily Support Level / FIB 0 % Level 7848.00
Lot Size :
Portfolio Size 10000
Risk to Reward 1 : 1
Lot size 32 units @ 5% Risk
TP = Total PIPS in gain = 1407 Profit 15.59 %
Total PIPS in Stoploss = 8 Loss 2.79%

USOIL - LongThe current chart pattern show confluence of:
-Dow Theory (higher low)
-Bullish engulfing pattern
-Bounce back from C retracement in ABCD harmonics (0.46 fib retracement level)

WTI BEARISH OUTLOOKCrude Oil benchmark WTI broke its previous established support at 81.75 and continued its downtrend through Wednesday after G7 talk for implementing a price cap on Russian supply. The mark cap of 65-70 USD per barrel was higher than the market expected, which elevate some of the fears of supply distribution of the oil. Another positive news for the global oil supply is that Chervon Corp. might expand operations in Venezuela.
Both MACD and RSI technical indicators are confirming the downtrend with MACD histogram below the 0 line and RSI below the 50 neutral line.
If the trend continues the price might try to reach levels of 73.65 or even 70.47 In the opposite scenario, the price might revert and test its resistance at 81.75
Risk Disclosure: Trading Foreign Exchange (Forex) and Contracts of Difference (CFD's) carries a high level of risk. By registering and signing up, any client affirms their understanding of their own personal accountability for all transactions performed within their account and recognizes the risks associated with trading on such markets and on such sites. Furthermore, one understands that the company carries zero influence over transactions, markets, and trading signals, therefore, cannot be held liable nor guarantee any profits or losses.

USOIL - ABCD Harmonics West Texas Crude Oil shows strong bounce back from 0.46 fib retracement levels, and a possible formation of C-retracement pattern of the bearish ABCD harmonics. Buyers are advised to wait for the formation of first higher low and long.

WTIUSD Breaks Resistance Level.WTIUSD Breaks Resistance Level.
With the Confluence of Candlesticks Formation and SnR Lines.
We'll took entry on Resistance 1 as morning doji star on major support level.
HAPPY TRADING FOLKS!

USOIL forecast Double Top pattern formed and I think it will retest the resistance in the 90-91.7 area where the smart money waiting there to dump it

XAU/USD ANALYSISHello Traders
we have analysed gold and we have seen two movements
either it will go up from here from the level of 1763
or it will go down from 1767 to 1752 then went up till 1792

WTIUSD| Monthly BiasOverall bias on WTIUSD / Us oil.
Expecting price to trade higher into a premium PD-array and after that sell off into the sellside liquidity below on the overall

WTIUSD| USOil ON A BULLISH ASSIGNMENT US oil finally repriced to go higher...
Confluences:
A sweep of liquidity below a weekly low
smartmoney Trapping retail bullish orders on the weekly with a failure swing
expansion to the upside creating a bullish mss / smartmoney institutional price swing/ Bullish Open float
Price traded I to the discount of the price swing and expanded to create equal highs.
smart money traded lower to trapped retail resistance traders
The smartmoney engineered liquidity below a short term low to take the price higher to a HTF premium array which is the draw on liquidity highlighted in the chart above.
Expectation :
Us oils will be price higher by the smart money to draw to the draw on liquidity.
Conclusion :
we have a bullish bias for this week and beyond

US OIL TRADING IDEAAs its clear from chart,
us oil has broken the blue down trend / bull flag and got a nice push up side,
As dollar index is in corrective mode and we can see some more pullback in dollar index,
We are looking oil as a long opportunity, any pullback around 90.70 -90.80, will be a long opportunity targeting 97.50 -97.80.
The idea will be considered as invalidated if it get backs inside to broken bull flag.

WTI CRUDE OIL SEEM SELL CORRECTION THEN BUY....
Hello Traders, here is the full analysis for this pair,
let me know in the comment section below if you have any questions,
the entry will be taken only if all rules of the strategies will be
satisfied. I suggest you keep this pair on your watch list and see if
the rules of your strategy are satisfied.
Dear Traders,
If you like this idea, do not forget to support with a like and follow.
PLZ! LIKE COMMAND AND SUBSCRIBE.

GBPJPY ANALYSIS WE ARE HPOING it to go to sell from the point of 168.600 till 600 pips down if it gets rested there is the momentum of this trade will go on making the higher highs then it will go up till 350 pips
