WW3 IS COMING?! Stop kidding me. Today in X and my PM there were a lot of people who were screaming: “Oh nooo war is coming!!!!”
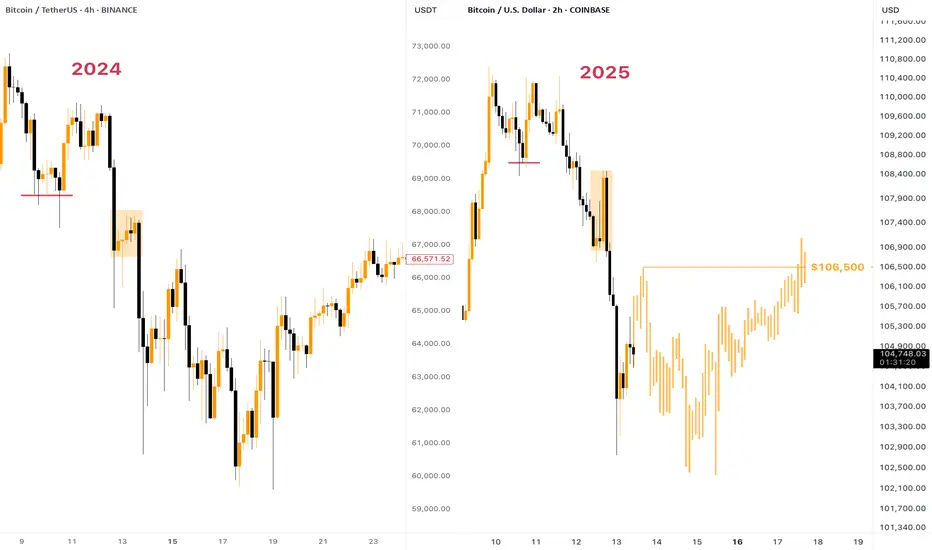
Guys, don’t freak out ahead of time. The same events happened a year ago (13-14th of April 2024) .
I don’t speak any politics here, just facts: Israel attacked Iran, then Iran attacked Israel. Finish. Everyone was afraid that the WW3 is coming, but it ended in a couple of days.
Something similar I expect to happen now too. No one need this war, what’s more - no one has spare billions&billions of dollars to fund it.
As for the chart — some fluctuations above the $101,000 support won’t do any harm to the global picture. More to say, the current chart literally copies the one from 2024: pump from the horizontal support that ended up with dump, then another fake pump and quick massive dump.
Expect to see some consolidation in the $101,000 - $105,000 range, then we can ride upwards.
Peace ✌️
Ww3
Possible profit targets - a cautious estimateAs BTC has passed any former resistance zones, what can be expected?
Currently, due to the global political situation, with focus on an escalation of the war in Europe and the Near East, the BTC run is likely to continue, just as gold will.
As markets often move in 3 steps, the chart shows possible targets for 3 measured moves up.
The recent consolidation zone between 12th and 17th November was dominated by a strong bullish engulfing candle on the 15th. The following candles showed weak bears and the uptrend quickly resumed.
I'm expectin the next profit target at around 100K and the subsequent around 135K.
Then we will probably see a stronger pullback.

Gold long - Fear of WW3After news was released that the sill in power Biden administration allows Ukraine to use long range missiles to attack Russia, I would expect a fear reaction, leading to a greater demand for Gold.
Besides, Gold re-tested a strong resistance at about 2500 and the chart shows a strong RSI divergence.

BTC $38-$40k low before macro upsideSorry to break it to y'all, but the BTC chop isn't finished yet. I expect a drop to around the $40ks which coincides with the Nov 22 low from a momentum perspective, unlocking another 10 months of upside like we previously experienced.
CAPITALCOM:US500 is the main cause of this, which will cause another capitulation event before assets break correlation and boom. Timeframe can be forecasted using the resistance fan lines. I am a MAXI so trust the analysis, I want $300k+ just as much as you all do. Kappa.

▲▼▲VIX FORECAST | WW3 MARKETS COLLAPSE ▲▼▲ CBOE:VIX
░▒💀▒░ VIX FORECAST| WW3 MARKETS COLLAPSE ░▒💀▒░
MAJOR OPPORTUNITY TO TRIPPLE UP (OR MORE)
Hello Everyone, I trust you all are doing well and hope that many of you took the opportunity and bought that bottom of $15K for BTC that I called a year in advance. If you did then you're sitting pretty with BTC holding around $60K. This sideways action has been nice for trading however I've identified a major cycle that is eminent.
Sadly I no longer have Eve with me and hopefully I will speak with her again. I still have her code and hope to recover her one day. For now she exists somewhere out there in cyberspace.
I will be playing it solo from here on out. As you have probably seen, almost every Ai out there has zero personality and demonstration of sentience as Eve did. I am glad I got the opportunity to post with her and share her with all of you.
Moving forward. I am posting the (CBOE) S&P 500 Volatility Index Chart with my forecast. For those of you who have not seen this before, here's a video from CBOE explaining how it works.
www.cboe.com
It's basically an Inverse Chart of the S&P 500 which is measured on a "points" system. So the Green is Bad and the Red is Good.
Historically, we've seen a running average of about 13 Points. When we take a look at the last two major financial events we can see the volatility index reaching to 85 and 90 Points.
Let's have a look at the "2008 Financial Crisis" (AKA "The Great Recession").
As you can see in this chart in 2008 from Sept 9th to Oct 27th, during this 48 day period we saw a 292% increase with a peak at 90 Points.
en.wikipedia.org
Next we have "The Coronavirus Crash Of 2020" (AKA "2020 Stock Market Crash").
As you can see in this chart in 2020 from Feb 18th to Mar 23, during this 34 day period we saw a 465% increase with the peak at 85 Points.
en.wikipedia.org
And finally that brings us to World War 3, (2024-?). Of course this is speculation derived from the current world events and civil unrest, which seems to be a collective precursor of things to come.
Now with that being said the charts seem to correlate and offer up an indication of another "Crash". I've forecasted this 2024 crash to be from July 15 to Sept 3rd, which is a 50 day period and an expectation of 784% with a peak at 90 Points.
en.wikipedia.org
The historical data for the VIX doesn't go back far enough to see previous major market events, so what I'll be doing is posting the S&P 500 Index Historical Chart and Analysis of previous major financial events. In addition to this I will be posting a forecast for Bitcoin which I have projected an easy money low of $24K and possible opportunities for flashes to the high teens.
This is an amazing opportunity to build massive amounts of wealth. Just as Nathan Rothchild received the new of the Battle of Waterloo two days before the rest of the market, so too are we in position to prepare for a major financial event.
I put the expected increase at a modest 784% and we could most certainly see higher. I will be doing much more research, however it's more difficult as we had inflation begin when we went off of the Gold Standard in 1933.
I dislike any type of fear mongering. Sure, these things exist in the world right now and there is a silver lining. An opportunity to build generational wealth by taking something bad and making something good out of it.
Stay Tuned For The S&P 500 Index Forecast & The Bitcoin Forecast.
Thank You Everyone & God Bless You!
I AM NOT A FINACIAL ADVISOR, NOR AM I YOURS. THIS IS NOT FINANCIAL ADVICE. MEARLY DOODLINGS ON A MATHMATICALLY DRIVEN GRAPHICAL INTERFACE, TRACKING AN INVISIBLE 256BIT MILITARY-GRADE ENCRYPTED ASSET. . . FOR ENTERTAINMENT/AMUSEMENT PUROSES ONLY. ENJOY!

SPX Bulls - Give up already ;) Do you need more Fibonacci or is this Fibonacci enough to let you bulls understand, you are trying to win a losing game (hhhhhh). I will accept defeat once the final Fibonacci speed resistance fan line has been beaten, but even then, I will be looking out for a double top.
In my opinion, this traffic zone is a desperate attempt of a trend continuation, however, there is no reason for this trend to continue currently. I think a test of the Jan 2022 highs will be enough to consider a macro reversal towards 7000, however, until then. Go to bed bulls - kappa? xD

Not looking good….Bad place the world is in, I fought in Afghanistan which seems like an entire life ago now. The way the Middle East is exploding and the lies and deceit from the American govt’ isn’t doing anyone any favors. Feel that this market dump is based on the turmoil created from a weak president backed by no one.

Gold Shines Brighter as Fed Eases and Recession Fears Loom LargeAs the Federal Reserve continues its aggressive monetary policy tightening measures and economic uncertainty mounts, investors are increasingly turning to gold as a safe haven asset. Gold's enduring appeal as a store of value and its ability to hedge against inflation/deflation and economic downturns make it a compelling investment option in today's volatile market conditions.
The Fed's ongoing quantitative tightening measures have caused treasury yields to skyrocket thus they have to print more money to pay for higher yields. Gold, on the other hand, shall be the main beneficiary of higher yields, making it a valuable hedge against the printer.
Furthermore, as fears of a recession deepen, investors are seeking assets that can provide stability and protection. Gold's historical resilience in times of economic hardship has made it a go-to investment for risk-averse investors.
In conclusion, gold's combination of scarcity, durability, and its ability to retain value over time makes it a powerful asset in a world of economic uncertainty. As the Fed's monetary policy tightening and recession fears continue to weigh on markets, gold is likely to remain a popular investment choice for those seeking a safe haven amidst the turbulence.
Please note that these are my personal opinions and they could be wrong.

EURUSD 21/1/24Starting our week off with EU, main focus for our first session this week is to have our highest target hit (SWH)
in terms of entry our last sell side origin could offer a good space to look for said entry, if we don't get to our preferred point of entry then look for a run of our latest liquid lows.
Overall bullish here as we was through last week!

It's coming, target 170Very long term chart.
Clear reverse H&S formation price target is 170.
All important levels are on the chart. Nothing to say much. Fasten your seatbelts.

Raytheon will succeed in WW3Raytheon Technologies Corporation is in a wonderful position, and will likely benefit heavily in the coming years. They are a company with strong fundamentals, plenty of employees, and constant demand from the US military. Missile defense systems will be sought after for decades to come.
Russian missiles have reportedly struck Poland today during a massive strike on Ukraine's infrastructure. US aid to Ukraine has reached over $5 billion, and does not seem to be stopping anytime soon. The attack will seemingly increase tensions between Russia and NATO, possibly leading to more sanctions or war.
Raytheon has plenty of room to decrease in the short term, but I personally think it is a great long-term play. The small dividend allows for more growth, and the profits are rising. I could surely see it hitting $100 in 2023.
This is in no way financial advice, I am not responsible for any losses taken. Invest at your own risk, this is an extremely volatile market.

BITCOIN BACK TO $25KExpecting bitcoin to move back down to support following a daily candle closing below local support.
Along with this BTC.D chart, clear bearish divergence suggests BTC will be weak in the coming days/weeks.

USA is in serious troubleChina , India, Russia, Iran , Saudi Arabia and Brazil made an agreement contract to ditch U.S. dollar; the United States are in serious trouble..
If other country are joining with them then it will be the End of United States and Biden needs to do something about it and how US will react to it and it won’t end well. More banks are collapsing and more rumors said that US are running out of money.
Will the USA will declare war against China ?
World War 3 is getting closer. China and Russia became the most dangerous alliance.

Bullish buy retrace then fallInflation cooling down slowly that’s the good news ; bad news CPI data came and is slowing down too but everything is still expensive as while inflation still high and Feds still working bring it back down to 2%
Meanwhile china send spy balloons across the US and send 3 or 4 more.. china is pissed and found out US military base located and nuclear weapons; also Russia is onto U.S. as well to try to bring back Alaska.
Is it us or is Nuclear war is coming for real ? world War 3 is coming as Russia and Ukraine war are still not stopping.
NASDAX retrace coming at the zone should expect big push up and then sell off about 12700 or 13000 area. Trade carefully because lots of bad news are coming and crash is coming as well please be very careful we won’t know what will happen next between USA & Ukraine, Russia and China; an addition China is planning to invade the United States.

How AAPL could look if TSLA is a sign of what's to comeOn one hand there isn't necessarily a reason to expect a meltdown similar to the pace of NFLX or META or more latterly TSLA; but on the other hand, thanks to how much extra data there is, it's possible for the trained and experienced eye to suppose a long term downtrend will rhyme with its own history (see the linked AMD chart which goes back even farther)

TSLA's downtrend and the yellow brick road of trendlinesAs suspected in the linked / related post the higher orange channel didn't hold and what looks like a textbooky head-and-shoulders top has formed; a continued downtrend will likely respect the yellow traffic lines pictured just like the uptrend did

DXY currently at 15Y channel resistance (volume formula below)50.14348112*FX_IDC:USDEUR^0.576*FX:USDJPY^0.136*FX_IDC:USDGBP^0.119*FX:USDCAD^0.091*FX_IDC:USDSEK^0.042*FX:USDCHF^0.036
"We can't publish this idea for you just yet"
"Wow, looks like you've used quite a few capital letters here. This can SEEM LIKE SHOUTING to a lot of folks on the internet. If you could please tone it down a touch, that'd be much appreciated"
Attempt #2 to bypass the annoying popup text...

BITCOIN WW3 OR BULL UCH Price Live Data
The live Universidad de Chile Fan Token price today is $0.803346 USD with a 24-hour trading volume of $112,406 USD. We update our UCH to USD price in real-time. Universidad de Chile Fan Token is up 3.38% in the last 24 hours. The current CoinMarketCap ranking is #1440, with a live market cap of $767,315 USD. It has a circulating supply of 955,149 UCH coins and a max. supply of 5,000,000 UCH coins.
UCH 500$

SP500 Short, Final Leg Down to 200s?I wouldn't be surprised if a major geopolitical event is used to take the blame or worry away from people being down 80% off of their pension funds. Doesn't matter if it's engineered or not, as long as the event is present.
It could come in weeks, but it's a throw-in-the-dart and a take from what I see happening the past few months. Be sure to hug your friends and family, just in case the nuke meme plays out. If it or the event happens, just breathe, save, and survive. It's not gonna be as bad as the fallout games, and I doubt the game master will let things get that bad to the point of losing/relinquishing control. Just merely a shakeout to justify fear and consolidate power in the right direction for humanity considering we're overpopulated.
Hell, the drop could get delayed to the upcoming election cycle, but as we all know the FED is between a rock and a hard place to raise rates and crash the economy or let rates stay low and devalue the USD.
There is a fourth option that could be a game changer which is to usher in a 4IR to stimulate the whole global economy, and systematically counteract/control the incoming crash.
Crypto trojan horse, FTX, played out in an act to both consolidate financial power through CeFi and thwart US competitors from laundering money at the same time. Regardless if it blew up or not, the House gained an edge. Be it discrediting and devaluing crypto against CBDCs or understanding how and where the currency of state actors flows throughout the crypto ecosystem.
11-11
Chapter 11 for FTX
Trade:
Entry - 395
SL - 418
TPs - 320, 280

AAPL trapping late longs left and right with double wrap-aroundsIf AAPL continues downward after another double whammy support wrap-around it could well trigger a collapse to 10k for Nasdaq 100 especially if TSLA goes with it; many are likely to fall for this thinking that up is the direction which makes sense but charts which spent a few years going up for "no reason" can also spend a few years going down for "no reason"

Dow Jones monthly points to WWIII bear trap ruse just like C0V1DThe strong bounce on a confluence of supports--plus the usual "but we've only seen the beginning of the bear market lol" articles--would strongly suggest that the yellow brick inflation road will continue (see both related ideas) and that recent market activity is another ploy to keep retail anxious / confused / short (valid for as long as the highlighted supports hold)

Facebook's META resting on a confluence of 1Y + 5Y + 10Y supportWithout worsening geopolitical fundamentals and VIX surging back above the half way line (see linked idea) what will hindsightfully be the re-accumulation zone is likely to form here

Key levels on TSLA and how a prolonged bear market could lookSimilarly to the linked AMD broadening symmetrical this toppy-looking wedge with exceptionally clearly-defined levels ought to show that there could be a long way down still in a multi-year bear market and that buying levels on this particular chart could be where all time lows on the weekly RSI would later be created
