STLA 1H Swing Long Aggressive CounterTrend TradeAggressive CounterTrend Trade
- short impulse
+ biggest volume T1
+ biggest volume Sp?
+ weak test closed 2 ticks below support level
+ first bullish bar closed entry
- resistance level
Calculated affordable stop limit
1 to 2 R/R take profit
Daily countertrend
"- short impulse
+ volumed TE/T1 level
+ support level"
Monthly trend
"+ long impulse
+ T2 level
+ 1/2 correction
+ support level"
STLA @NYSE
Sell Limit 17.40, GTC
Sell Stop 16.53 LMT 16.84, GTC
Wyckoff

[Daily Bias] Gold - Fri 082312024 - Ranging or dropThe market may range or drop to the naked Point of Control (POC) today.

[Daily Bias] Gold - Wed 082212024 - Looking forward continue upWe have two possible scenarios today:
Strong support with high volume and TPO PoC holding the price.
If support fails, the price could move down to the next support level.

[Daily Bias] Gold - Wed 08212024 - Ranging Between HVAsThere’s a strong chance that today’s price will remain within the range of two key high-volume areas

BTC 42K?Unbelievable! What Would Richard Wyckoff Do if He Saw the Bitcoin Chart Today? BINANCE:BTCUSD About to Repeat History? Is the Price About to Return to the Beginning of the Year Levels?
Levels> 44k-42k$

BTC re-AccumulationCurrent PA present itself as Model-2 re-Accumulation. Still could evolve into Model-1.
Overall targeting ATH. In case of decent closes above each mark levels.
Could turn into Distribution. Targeting 48k.
Range high would be a crucial point imo.

MBMR GOING FOR MARK UP
In the background of plummeting KLCI (Bursa Index), this stock rising above
Classic Type 1 Re-Accmulation
Price succesfully overcome the suply on 5/8/24 (red arrow)
-Wyckoffian call it 'COMPOSITE OPERATOR ROTATION'
Plus, with the 'Spring' !
I put my trust on the setup
position as attached
PureWyckoff
Anything can happen

[Daily Bias] Gold - Tue 08202024 - Reject By dOpen Or Sweep LiqBias sell today with 2 scenarios
Price got rejection on day open & drop
Price sweep high liquidity, create UTAD & drop

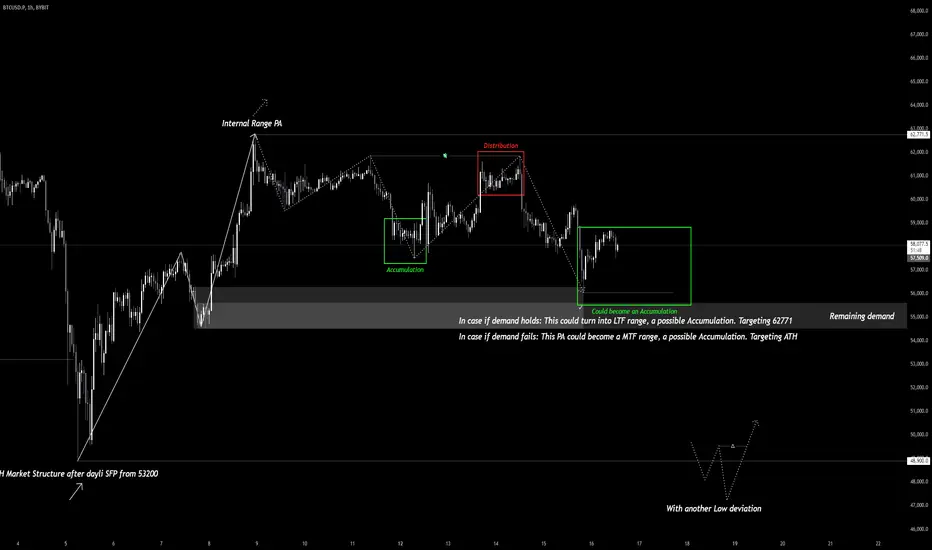
BTC PA IdeasPrice tapped into crucial demand IMO.
If we hold it, a 4h MS remains bullish, after a dayli SFP.
Possible LTF Accumulation could happen here. Targeting 62700
If demand fails. High chanches to take HTF range Low one more time.
Possible MTF Accumulation cound happen. If price SFP and break some MS. Targeting ATH
TGT D1 Long Aggressive Investment TradeAggressive Trade
- short impulse
+ biggest volume T1
+ support level
+ volumed 2Sp+
+ weak test
Monthly context:
"+ long impulse
+ SOS level
+ support level
+ close to 1/2 correction"
Will run 50% to 2R and the rest to Monthly T1

Look for Wyckoff in the right places.Since my partner @Mayfair_Ventures started talking bearish about BTC in March 2021, and also talking about Wyckoff theory, a lot of commentators picked up on it and made Wyckoff more widely known.
Most likely they read up on it quickly and got some kind of understanding, but unless you have been using it for a while in anger, as in, making real trading decisions based on it, it's not that easy to use.
There is ALWAYS a bigger picture to look at. Also, you rarely get a perfect Wyckoff.
One person's spring is another's confirmation that this is a distribution. Like all trading, there is a combination of signs.
Take this accumulation from Summer 2021. It only proved it was accumulation when it exited the ranger to the upside. You had to wait for the retest to get a sensible trade. Even then, the overall risk reward was at best mediocre, and no one in the crypto space had the patience to wait almost 7 weeks for it, instead getting rinsed at $50k and likely stopped out.
And also remember the narrative was around the Elliott Wave that we'd outlined, because you can't just rely on Wyckoff, or any one thing , if you want a sensible trading strategy.
Right now, for a number of sensible logical reasons outlined in the attached posts and videos, I am looking for Wyckoff Distribution. My bias is downward. If you want to know why, look at the other posts, I'm not re-hashing it all again here. The important thing is the pattern I expect to see, involving a significant break of the consolidation structure to the downside and then a retest of the zone.
Hmmm....
I spoke in earlier posts about there being a chance of a final upthrust above the ATH, just to sucker the last few in. I think he chances of this are reduced to about 5-10% now, given recent price action. The middle of the consolidation ($66K) seems like the top for now. If it retests and fails, then it may be time to pull the trigger.
Please bear in mind that BTC is now a mature instrument, and the days of exponential prices are gone.
Good luck, because it's better to be lucky than good, most of the time!

LLY 1H Long Swing Aggressive trend tradeAggressive trend trade
- short impulse
+ biggest volume T1
+ biggest volume manipulation
Calculated affordable stop limit
1 to 2 R/R take profit after 1/2!!!
Daily context
"+ long impulse
+ 1/2 correction"
Monthly context
"+ long impulse
- neutral zone"
LLY @NYSE
Sell Stop 901.82 LMT 905.94, GTC
Sell Limit 913.63, GTC

GEHC 1H Long Swing Aggressive Trend TradeAggressive Trend Trade
- short impulse
+ volumed T1
+ support level
+ volumed 2Sp-
+ weak test
+ first bullish bar closed entry
Calculated affordable stop limit
1 to 2 R/R take profit
Daily Trend
"+ long impulse
+ T2 level
+ 1/2 correction
+ support level
+ volumed 2Sp-
- independent approach"
Monthly trend
"+ long impulse
+ SOS test level
+ 1/2 correction
+ support level
+ volumed 2Sp+
+ weak test"
GEHC @NASDAQ.NMS
Sell Stop 79.68 LMT 81.40, GTC
Sell Limit 84.76, GTC

NLMK 1H Long Swing Aggressive CounterTrend TradeAggressive CounterTrend Trade
- short impulse
- unvolumed TE / T1 level
+ support level
+ biggest volume 2Sp-
+ weak test
+ first bullish bar closed entry
Calculated affordable stop limit
1 to 2 R/R take profit
Daily CounterTrend
"- short impulse
+ volumed TE / T1
+ support level
+ volumed manipulation"
Monthly CounterTrend
"+ long impulse
+ T2 level
+ support level"

Yay or Nay?It's decision time. Critical point here. BONK failed to break and close above the upper resistance from the last ATH to pump to fresh new highs.
Do we gonna go straight up, sideways to create a strong base or down to major support?

Lululemon: Downward Dog Days Ahead? - A Wyckoff Distr AnalysisINTRO
I have been sitting on this idea for a while and finally decided to put the pen to the pad. For the past three years, there have been signs that Lululemon's stock may be destined for a decline. This trade idea will explore the potential for a downtrend using Wyckoff analysis, a technical analysis pattern used to identify trends within a market cycle.
The Wyckoff Distribution theory suggests that large institutions subtly distribute their holdings and initiate short positions before a significant price decline. This distribution unfolds in five distinct phases, each with its own characteristics. In this article, I'll describe these phases and analyze how they might be seen in Lululemon's case.
For reference, this is the schematic I will be comparing my LULU case to.
The Setup
The company's story began in 2008 with its founding. Like most companies, it was affected by the 2008 financial crisis and faced challenges in its performance. However, it recovered strongly over the next 3 years, with its stock price increasing by almost 3,700% from its low in 2009 to its high in 2012. From 2012 to 2018, the stock underperformed as its valuation took some time to catch up. During this period, LULU steadily improved its financial performance, attracting the attention of smart investors who began accumulating shares.
Phase A
The distribution phase marks the end of the prior uptrend. Up to this point, buyers have been dominant, but now we see evidence of institutional selling with the preliminary supply (PSY) and the buying climax (BC). The BC indicates the end of the uptrend as institutions freely unload shares. The low created after the BC is called the automatic reaction (AR). This low is important because it represents the lowest price at which institutions are willing to sell their shares. The AR and BC form our distribution channel, and there will be secondary tests (ST) of these ranges.
Phase B
Phase B functions to create momentum in preparation for a new downtrend. During this phase, institutions and large professional interests sell off their holdings and start taking short positions. This is typically marked by low-volume rallies and high-volume declines. Additionally, we may witness signs of weakness (SOW) and upthrusts (UT), which are further tests of supply and demand as institutions assess interest. Note the volume as the stock price advances and declines.
Phase C
Phase C is an optional phase that primarily serves as a test of the remaining demand. You can identify it by the UpThrust After Distribution (UTAD), which is a price move above the trading channel resistance that quickly reverses and closes back within the channel. It is a bull trap – it appears to signal the resumption of the uptrend but in reality, it is intended to trick uninformed break-out traders. It is used to snag additional shares short at elevated prices before a decline. Note the volume spike to create the UTAD and the volume spike to take it away.
Phase D
In Phase D, there is growing evidence that the uptrend is coming to an end. Sellers take control, leading to a clear break of support or a decline below the midpoint of the trading channel after a UT or UTAD. During this phase, there are typically several weak rallies, each marked by the last point of supply (LPSY).
Phase E
The final phase of the cycle is Phase E. It depicts the unfolding of the downtrend; the stock leaves the channel to the downside and supply is in control. This represents a high-probability opportunity to sell short. Subsequent rallies during the newly formed downtrend are quickly washed with selling.
We haven't entered Phase E yet, but the chart is currently aligning well with our expectations. Given that the pattern has taken 3 years to form, it will likely result in a longer-term short. I believe that targeting the 150s is reasonable if the analysis is accurate. I would appreciate hearing your thoughts on this.

NLMK Daytrade 5M Conservative CounterTrend TradeConservative CounterTrend Trade
+ long impulse
+ SOS level
- strong approach
+ volumed 2Sp-
+ weak test?
+ first bullish bar closed entry
Calculated affordable virtual stop limit
1 to 2 R/R take profit
Hourly CounterTrend
"- short impulse
- unvolumed TE / T1 level
+ support level
+ biggest volume 2Sp-"
Daily CounterTrend
"- short impulse
+ volumed TE / T1
+ support level
+ volumed manipulation"
Monthly Trend
"+ long impulse
+ T2 level
+ support level"


Sell BitcoinBitcoin once again is doing a Lower high in the daily chart, now price is in the resistance now I have some doubts because all the momentum on the bitcoin but I think can be a good time to open a short position, hoping price can travel to the Botton of the range around 54K once again
Opened a short position at 69050


BTC Possible AccumulationVolume decrasing. PA trying to accumulate
Seems reasonable to take curling liquidity and mitigate frontrunned 2h Demand as 2nd Tap.
Ordrerflow to atleast take local highs, Possible reverse up to ATH

BTC Possible PO3Accumulation failed. 2nd Tap w/o proper internal MS w/o SFP
Seems like a break.
PA have slight chances to turn into Po3 play.

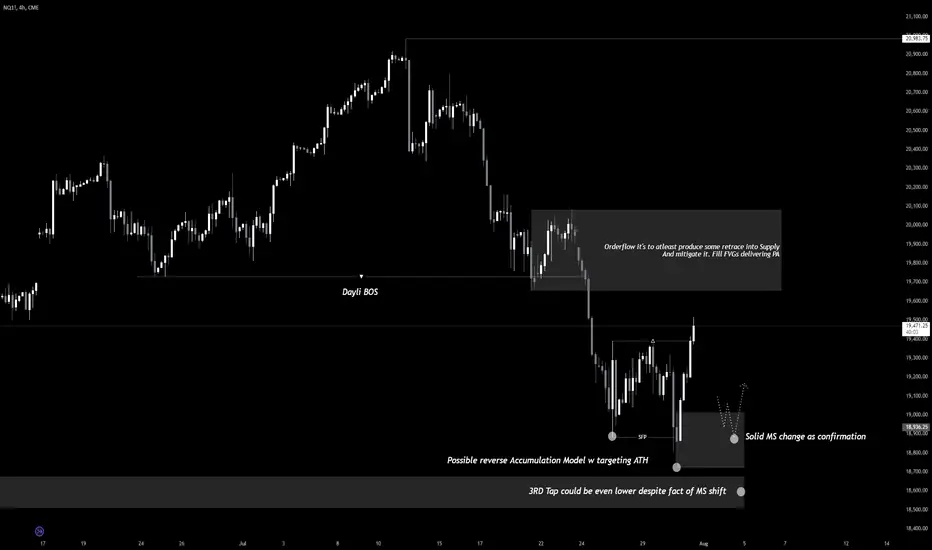
NASDAQ AccumulationOrderflow of this accumulation it is to at least produce retrace after Dayli BOS.
Could turn into reverse Model. aiming highs. Making Dayli break - false