Lululemon: Downward Dog Days Ahead? - A Wyckoff Distr AnalysisINTRO
I have been sitting on this idea for a while and finally decided to put the pen to the pad. For the past three years, there have been signs that Lululemon's stock may be destined for a decline. This trade idea will explore the potential for a downtrend using Wyckoff analysis, a technical analysis pattern used to identify trends within a market cycle.
The Wyckoff Distribution theory suggests that large institutions subtly distribute their holdings and initiate short positions before a significant price decline. This distribution unfolds in five distinct phases, each with its own characteristics. In this article, I'll describe these phases and analyze how they might be seen in Lululemon's case.
For reference, this is the schematic I will be comparing my LULU case to.
The Setup
The company's story began in 2008 with its founding. Like most companies, it was affected by the 2008 financial crisis and faced challenges in its performance. However, it recovered strongly over the next 3 years, with its stock price increasing by almost 3,700% from its low in 2009 to its high in 2012. From 2012 to 2018, the stock underperformed as its valuation took some time to catch up. During this period, LULU steadily improved its financial performance, attracting the attention of smart investors who began accumulating shares.
Phase A
The distribution phase marks the end of the prior uptrend. Up to this point, buyers have been dominant, but now we see evidence of institutional selling with the preliminary supply (PSY) and the buying climax (BC). The BC indicates the end of the uptrend as institutions freely unload shares. The low created after the BC is called the automatic reaction (AR). This low is important because it represents the lowest price at which institutions are willing to sell their shares. The AR and BC form our distribution channel, and there will be secondary tests (ST) of these ranges.
Phase B
Phase B functions to create momentum in preparation for a new downtrend. During this phase, institutions and large professional interests sell off their holdings and start taking short positions. This is typically marked by low-volume rallies and high-volume declines. Additionally, we may witness signs of weakness (SOW) and upthrusts (UT), which are further tests of supply and demand as institutions assess interest. Note the volume as the stock price advances and declines.
Phase C
Phase C is an optional phase that primarily serves as a test of the remaining demand. You can identify it by the UpThrust After Distribution (UTAD), which is a price move above the trading channel resistance that quickly reverses and closes back within the channel. It is a bull trap – it appears to signal the resumption of the uptrend but in reality, it is intended to trick uninformed break-out traders. It is used to snag additional shares short at elevated prices before a decline. Note the volume spike to create the UTAD and the volume spike to take it away.
Phase D
In Phase D, there is growing evidence that the uptrend is coming to an end. Sellers take control, leading to a clear break of support or a decline below the midpoint of the trading channel after a UT or UTAD. During this phase, there are typically several weak rallies, each marked by the last point of supply (LPSY).
Phase E
The final phase of the cycle is Phase E. It depicts the unfolding of the downtrend; the stock leaves the channel to the downside and supply is in control. This represents a high-probability opportunity to sell short. Subsequent rallies during the newly formed downtrend are quickly washed with selling.
We haven't entered Phase E yet, but the chart is currently aligning well with our expectations. Given that the pattern has taken 3 years to form, it will likely result in a longer-term short. I believe that targeting the 150s is reasonable if the analysis is accurate. I would appreciate hearing your thoughts on this.
Wyckoff

NLMK Daytrade 5M Conservative CounterTrend TradeConservative CounterTrend Trade
+ long impulse
+ SOS level
- strong approach
+ volumed 2Sp-
+ weak test?
+ first bullish bar closed entry
Calculated affordable virtual stop limit
1 to 2 R/R take profit
Hourly CounterTrend
"- short impulse
- unvolumed TE / T1 level
+ support level
+ biggest volume 2Sp-"
Daily CounterTrend
"- short impulse
+ volumed TE / T1
+ support level
+ volumed manipulation"
Monthly Trend
"+ long impulse
+ T2 level
+ support level"


Sell BitcoinBitcoin once again is doing a Lower high in the daily chart, now price is in the resistance now I have some doubts because all the momentum on the bitcoin but I think can be a good time to open a short position, hoping price can travel to the Botton of the range around 54K once again
Opened a short position at 69050


BTC Possible AccumulationVolume decrasing. PA trying to accumulate
Seems reasonable to take curling liquidity and mitigate frontrunned 2h Demand as 2nd Tap.
Ordrerflow to atleast take local highs, Possible reverse up to ATH

BTC Possible PO3Accumulation failed. 2nd Tap w/o proper internal MS w/o SFP
Seems like a break.
PA have slight chances to turn into Po3 play.

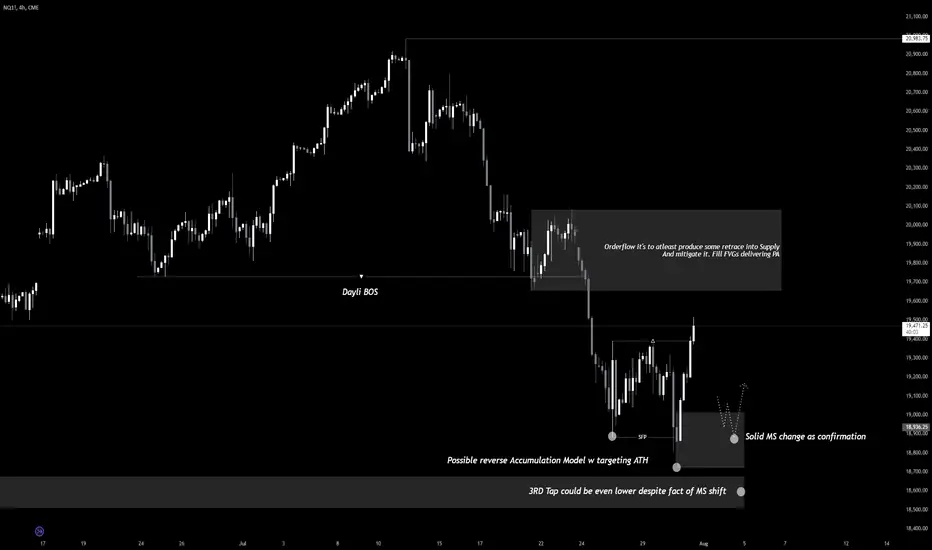
NASDAQ AccumulationOrderflow of this accumulation it is to at least produce retrace after Dayli BOS.
Could turn into reverse Model. aiming highs. Making Dayli break - false
GOLD Distribution Model-1GOLD Distribution Model-1
30m MS shift in leg up could lead price up to Range Low and possible even lower.
Confirmate HFT Distribution

STLA Long Swing 1H Aggressive CounterTrend TradeAggressive CounterTrend Trade
- short impulse
- unvolumed TE / T1
+ support level
+ biggest volume Sp
Calculated affordable stop limit
1 to 2 R/R take profit
Daily CounterTrend
"- short impulse
+ volumed TE/T1 level
+ support level
- 1 bar reversal?
Monthly trend
"+ long impulse
+ T2 level
+ 1/2 correction
+ support level"
STLA @NYSE
Sell Limit 17.00, GTC
Sell Stop 16.61 LMT 16.75, GTC
I don't want to run it more than 1 to 2 R/R since 1 bar reversal on daily.

Less is more...If you don't know me, I have been a trader a very long time. Nearly 25 years to be exact.
Over the years, I have spent a lot of time studying a wide array of techniques, tools, patterns and market sentiment. Lucky enough, the markets have also been very kind to me.
I've been fortunate enough to have two trading books published by large traditional publishing companies. So it's safe to say, I live and breathe trading.
I am going to do a series of posts here covering a couple of key educational topics - starting with Elliott Wave theory.
When it comes to Elliott Wave theory, there seems to be a love hate relationship for many people. Some get it, some see it as not relevant. To be honest, both are correct.
Now before you jump on the high horse "it doesn't work for crypto" - let me start by saying, this is not a lesson on how to use Elliott Theory. I covered that in these posts below;
And step two;
In terms of using Elliott, it's not as simple as trying to figure out each and every move. (this is often why, it does not work.) Instead the benefit of Elliott, is to accept it as a bias tool that aids in understanding the current market sentiment.
We often see posts online about things like the Wall Street cheat sheet. I also covered this in another post here on @TradingView
Where the theory has any real value, is simply to obtain a bias. The market is always searching for liquidity. In order to obtain liquidity, the market needs to attract players for the game.
Now, you have probably entered a trade and felt almost immediately that the market has pushed against you, it's out to get you and the brokers are playing 1 vs 1 against you.
This is where sentiment really comes in.
As a retail trader you have likely been exposed to tools such as RSI, MACD or even dabbled with Elliott and Wyckoff. But the reason the market does, what the market does, is not to get you as an individual, instead it's there to collect liquidity from a crowd.
Elliott wave theory isn't a technical tool, it's a sentiment tool.
So instead of trying to guess every internal and nested swing, you can make an awful lot of money by simply giving a directional bias.
I wrote an article in 2021 here -
About the emotions, I used the Simpsons to get the point across. The general idea is to understand where liquidity is likely to be and use that to make informed trading decisions.
If you have any specific questions, even topics you would like covered, leave a comment below. I'll add to this in another post as part of this series.
Stay safe and wish you all the best.
Disclaimer
This idea does not constitute as financial advice. It is for educational purposes only, our principle trader has over 20 years’ experience in stocks, ETF’s, and Forex. Hence each trade setup might have different hold times, entry or exit conditions, and will vary from the post/idea shared here. You can use the information from this post to make your own trading plan for the instrument discussed. Trading carries a risk; a high percentage of retail traders lose money. Please keep this in mind when entering any trade. Stay safe.

GEHC 1H Swing Long Aggressive Trend TradeAggressive Trend Trade
- short impulse
- unvolumed T1 level
+ biggest volume 2Sp+
+ weak test
+ first bullish bar closed entry
Calculated affordable stop limit
Take profit:
- 60% 1 to 2 R/R
- 40% daily T1
Daily context
"- short impulse
- unvolumed T1 level
+ biggest volume 2Sp+
+ weak test
+ first bullish bar closed entry"
Monthly context
"+ long impulse
+ T2 level
+ 1/2 correction
+ support level
+ volumed manipulation"
GEHC @NASDAQ.NMS
Sell Limit 83.59, GTC
Sell Stop 79.59 LMT 80.69, GTC
GEHC @NASDAQ.NMS
Sell Limit 82.85, GTC
GEHC @NASDAQ.NMS
Sell Stop 79.59 LMT 80.69, GTC

#BTC #Bitcoin #Update #Setup 14 #Eddy#BTC #Bitcoin #Update #Setup 14 #Eddy
I had to give an update because many people still don't understand that this is a selling area and not a buying area.
According to the chart of gold, dollar and Dominance Tether, and from Vaykov's point of view, supply and demand, and even ICT, this area and the entry point of 70,000 is suitable for a short position.
Related Analysis & Setups of Bitcoin : (( BTC/USD )) : Check Link :

#XAU #XAUUSD #GOLD #Update #Short #ShortSetup #Eddy#XAU #XAUUSD #GOLD #Update #Short #ShortSetup #Eddy
According to the specific structure of the distribution, it is in the final phase and soon gold will fall to the specified level. (( This analysis is based on supply and demand style as well as Wyckoff and Dow theory. ))
Related Analysis of Gold : (( XAU/USD )) : Check Link :
My Analysis of Dollar : (( XAU/USD )) : Check Link :

MCD 1H Swing / Investment Conservative Trend TradeConservative Trend Trade
+ long impulse
+ expanding T2
+ volumed 2Sp-
+ weak test
+ first bullish bar closed entry
Calculated affordable stop limit
Take profit:
1/3 1 to 2 R/R
1/3 daily T1 level
1/3 monthly 1/2
Daily trend
"+ long impulse
+ expanding T2
+ volumed 2Sp-
+ weak test
+ first bullish bar closed entry"
Monthly trens
"+ long impulse
+ volumed T2 level
+ support level
+ 1/2 correction
+ biggest volume Sp
+ weak test"
MCD @NYSE
Sell Limit 261.99, GTC
Sell Stop 250.94 LMT 253.18, GTC
Sell Limit 257.63, GTC
OCO 2A: Sell Shares of MCD Limit at $271.49 (Good 'til Canceled)
OCO 2B: Sell Shares of MCD Stop at $250.94 Limit at $251.94 (Good 'til Canceled)

SBER 1D Investment Long Aggressive Trend TradeAggressive Trend Trade
- short impulse
+ biggest volume transitional extremum / T1
+ support level
+ biggest volume 2S-
+ weak test
+ first bullish bar closed entry
Calculated affordable stop limit
1 to 2 R/R take profit
Monthly context
" Trend trade
+ long impulse
+ SOS level
+ support level
+ 1/2 correction"

Wyckoff ReAccumulation Schematic AnalysisPrevious chart got messed up on TV, so reposting with more detailed information..
This daily BTCUSDT chart illustrates a classic Wyckoff Accumulation Schematic, showcasing various phases and key levels critical to understanding the potential market movements.
Phases and Key Levels:
Preliminary Supply (PSY): This is the initial point where substantial selling begins, but the downtrend is still intact. Marked near 67,579 USDT.
Buying Climax (BC): This indicates the point where aggressive buying meets resistance, leading to the initial sell-off. Positioned at approximately 73,777 USDT.
Automatic Rally (AR): Following the selling climax, an automatic rally occurs due to the cessation of aggressive selling and some buying interest.
Secondary Test (ST): The price retests the BC level, confirming the resistance and further defining the trading range.
Phase B - Up-Thrust (UT): This phase is characterized by false breakouts above the resistance level, aimed at trapping buyers before the price reverses.
Creek : A metaphorical line representing minor resistance levels that the price needs to jump across to indicate strength.
Spring : This phase is where the price dips below the support level to shake out weak hands before reversing upwards. The spring is tested to confirm the bottom.
Test : After the spring, the price tests the support level to ensure that the bottom is established.
Last Point of Support (LPS): Following the test, the price action shows higher lows, indicating strong support and the beginning of the markup phase.
Jump Across The Creek: A significant movement where the price crosses above the minor resistance levels (creek), signaling the start of a new uptrend.
Sign of Strength (SOS): Demonstrates strong upward momentum with increased demand, validating the bullish trend.
Current Status:
BTCUSDT is showing a strong bullish movement after completing the spring and test phases. The price has recently jumped across the creek and is currently at the Last Point of Support (LPS). The expectation is for a Sign of Strength (SOS) as BTC continues its upward trajectory towards the upper resistance levels around 73,777 USDT.
Measured Move Strategy:
Using a measured move strategy on a higher time frame, we identify breakout targets based on the height of the accumulation range projected upwards.
Potential Breakout Targets:
Short-term target at 71,997.02 USDT (100% Fibonacci level).
Medium-term target at 90,000 USDT, considering the height of the accumulation range added to the breakout level.
Higher time frame target at 180,000 USDT, aligning with the measured move strategy and long-term bullish projections.
Summary:
This chart provides a comprehensive view of the Wyckoff Accumulation pattern, highlighting key phases and potential bullish outcomes for BTCUSDT. Traders should watch for sustained strength above the LPS and look for SOS confirmation to validate further upside. The higher time frame breakout targets using a measured move strategy suggest significant bullish potential, with a long-term target of 180,000 USDT.

TATN 1H Swing Long Conservative Trend TradeConservative Trend Trade
+ long impulse
+ expanding volumed T2 level
+ support level
+ volumed 2Sp+
+ weak test
+ first bullish bar closed entry
Calculated affordable stop limit
1 to 2 R/R take profit
Day trend
"+ long impulse
+ T2 level
+ support level
+ 1/2 correction?"
Month trend
"+ long balance
+ expanding T2 level
+ support level"

VZ 5M Long Daytrade Aggressive Trend TradeAggressive Trend Trade
- short impulse
+ volumed T1 level
+ support level
+ biggest volume weak attempt manipulation
Calculated affordable stop limit
1 to 2 R/R take profit
Hour Trend
"+ open gap with retest
+ long impulse
+ SOS test level
+ 1/2 correction
+ support level
+ volume zone"
Daily CounterTrend
"- short impulse
- biggest volume TE / T1"
Monthly Trend
"+ long balance
+ historical 1/2 correction
with exhaustion volume in the end
+ initiative take over
+ ICE level
+ volumed? 2Sp
+ weak test"
VZ @NYSE
Sell Limit 40.22, GTC
Sell Stop 39.89 LMT 40.01, GTC

SYGROUP CONTINUE MARKUPA classic Accumulation pattern of Rising-bottom #2 as mentioned by the late Dr Hank Pruden
As Demand going in by the evidence of Vol (Black arrow)
Price going up
THis is basically an increasing effort with increasing result , always an indiciation of positve demand influx (2nd Wyckoff Law)
In view of that, i am humbly initiated a position as attached
Pure Wyckoff , Anything can happen
**there is still a lot of potential upsde ( 3rd Wyckoff Law, Yellow Arrow)

Wyckoff Reaccumulation Range.. Looking very similar with one small difference (the Phase B Upthrust didn't make a new high)...
Aside from that, this pattern is playing out 1:1
If it continues, price should drift upwards leading to a breakout.. likely in September.

SLB 5M DayTrade Long Aggressive CounterTrend tradeAggressive CounterTrend trade
- short impulse
- unvolumed T1 level
+ volumed Sp?
+ support level
+ weak test
+ first bullish bar closed entry
Calculated affordable stop limit
1 to 2 R/R take profit
Hourly context
"- short impulse
+ volumed T1 level
+ support level
+ 1/2 correction"
Daily context
"+ long impulse
+ above JOC SOS level?
+ support level
+ 1/2 correction"
Monthly context
"+ long balance
+ expanding ICE level
+ support level
+ 1/2 correction
+ volumed Sp"
SLB @NYSE
Sell Limit 48.70, GTC
Sell Stop 47.68 LMT 48.03, GTC

JNJ Swing Long Conservative Trend Trade 14Conservative Trend Trade 14
+ long impulse
+ support level
+ 1/2 correction
+ T2 level
+ biggest volume 2Sp
+ test
Calculated affordable stop loss
1 to 2 R/R take profit
Daily chart context
+ long impulse
+ 1/2 correction
Monthly chart context
- short impulse
+ biggest volume Sp
+ test
+ 1/2 correction
