Chainlink - Wyckoff Flag w/Spring BIST:LINK
The most obvious way to view Wyckoff Schematics are through line charts.
This has been a textbook shakeout pattern, coiling on top of a multi-month long support range.
I have bought every time it has touched the previous range highs and now it looks to be compressing prior to "jumping the creek" into a vertical rise IMO.
Wyckoff

BTC/USD analysis in 4h timeframeAs we expected bitcoin made a new all time high $73000 area and collect the liquidity over the last ATH $69000.
price is in a trading range between $60000 / $74000.
New flag limits are marked on the chart.
Bitcoin is forming a wyckoff structure and if it ingulf $58000 / $61000 demnad zone it will confirm the structure.
If the WYCKOFF structure is confirmed, price my fall down to $52000 Demand zone.
Otherwise if it gives us a bullish signal on $61000 Demand zone it will be a good investment too buy some #BITCOIN .

DAYANG TO CONTINUE MARK UPI just added a new position today @ 2.36
My previous hypothesis still valid
Please refer to my previous post regarding Dayang
Pure Wyckoff

UZMA MARK UPI still maintain my previous thesis,
my previous entry was shaken-out
I see the current price action, is on-going BUEC ( Phase D of Wyckoff Re-accmulation)
thus in view of that, i humbly initiated the position as attached
Pure Wyckoff

Embracing Uncertainty: The AUDCAD Resistance Saga - A Battle of In my analysis of AUDCAD, I pinpointed a specific area marked by ultra-high volume, suggesting a potential retest of this zone. It's worth noting that such areas are typically revisited in the majority of cases, prompting the question: am I anticipating weakness in this currency pair?
Maybe, maybe not... Let's delve deeper.
Examining AUDCAD on the weekly timeframe unveils a potentially bullish scenario. Two weeks ago, a down bar with low volume hinted at minimal selling pressure. Last week's bullish engulfing candle further reinforced this sentiment.
Should the bullish trend persist, my immediate resistance level stands at 0.90640, potentially leading to retests at 0.93500 and even 0.95000.
On the daily chart, an intriguing observation arises. Despite a widespread up bar indicating "No Demand," Friday's price action continued its ascent, defying this technical signal. Such behaviour strengthens the overall bullish narrative in AUDCAD, suggesting sustained upward momentum ahead.
However, the 4-hour chart signals potential weakness. An up bar with ultra-high volume closing mid-range indicates selling pressure. The last 4-hour bar of the trading week confirms this with a downward trend.
In conclusion, which direction will this currency pair take? My prediction leans towards an upward trajectory, contingent upon confirmation of strength from the weekly and daily charts.
Upon breaching the resistance level, I'll be vigilant for signs of testing or absence of supply, particularly focusing on low to ultra-low volume across the 1-hour and 4-hour charts.
Conversely, if prices retreat from resistance and trend lower, I'll be on the lookout for indications of no demand or upthrusts, especially across the hourly and 4-hourly charts.

ABLEGLOB SHORT TERMI bought this yesterday, my purpose for this post , is that i want to share & help especially to those newbies & amateur. I was so busy that i was unable to post it until today
(i am also a newbie+amateur. please do not believe anything i posted/share)
i decided to initiate the position in view of Absorption ( As attched)
Absorption is a term, in a way that the big boys AKA composite man , absorbing incoming supply from the weak money
Absolute pure wyckoff , nothing else

WILL MSM CONTINUE ITS MARK UPmy current hypothesis is that, price going to bo the BUEC
volatility reducing, tightening of price
price initiated as attached.
high risk entry
Pure Wyckoff

TD Swing Long Conservative Trend TradeConservative Trend Trade
+ long impulse
+ biggest volume T2 level
+ support level
+ biggest volume Sp
Calculated affordable stop loss
1 to 2 R/R take profit
Daily Context
"+ long balance
+ ICE level
+ 1/2 correction
- neutral zone"
Monthly Context
" - short impulse
+ biggest volume T1
+ support level
+ 1/2 correction
+ biggest volume 2Sp+
+ weak test to 1/2 correction"

HD Long Day Aggressive Counter Trend Trade 16Aggressive Counter Trend Trade 16
- short impulse
+ biggest untested volume T1
+ support level
+ biggest volume 2Sp+
+ test
+ below first bullish bar closed level entry
Calculated affordable virtual stop loss
1 to 2 R/R take profit
Hourly Context:
"- short impulse
+ biggest volume T1
+ biggest volume 2Sp-"
Daily Context:
"+ long impulse
+ T2 level
+ support level"
Monthly Context
"+ long impulse
+ SOS level
+ support level
+ 1/2 correction"

Bitcoin distributing hard Wyckoff (prepare for a DUMP)I am using a Wyckoff Distribution Schematic #1. Right now we are in Phase D. We already had an upthrust. (UTAD) is the distribution counterpart to the spring. It is the terminal shakeout that happens in a stage of accumulation. Keep in mind this is the 1H time frame. So this move will happen very shortly. My guess is by midnight tonight or tomorrow we should be under 65K completely.
Be careful, Do your own research as always
Thank you for reading

BTC enters the parabolic stage of the bullmarketPredicting the tops and bottoms of Bitcoin - in a macro sense - is not that easy. But some indicators can give us a clue or kind of sense of caution warning when to exit or enter the market.
One of them is the "MVRV Z" indicator. It is a chart indicator that uses blockchain analysis to identify periods where BTC is extremely over or undervalued relative to its "fair value".
Historically it has been very effective in identifying periods where market value is moving unusually high above realised value. It also shows when market value is far below realised value, highlighted by the green lines. Buying Bitcoin during these periods has historically produced outsized returns.
This chart indicator is generally useful for predicting Bitcoin price at the extremes of market conditions. It is able to forecast where price may need to pull back when the score enters the upper red hot periods and also when price may rally after spending time in the lower green band.
Historically it has picked major Bitcoin price highs to within 2 weeks.
So far BTC has done a great job holding in the middle value band. It's in the stage of taking the next leap breaking out of it to the upside completing the bullmarket, also referring to past historical breakouts which happenend in similar fashion after a long lasting bearmarket.

TD Swing Long Aggressive Trend TradeAggressive Trend Trade
- short impulse
- unvolumed T1
+ biggest volume 2Sp-
- skipping test expecting gap overnight
Calculated affordable virtual stop loss
1 to 2 R/R take profit at 1/2 of Daily
Daily context
"+ long balance
+ ICE level
+ 1/2 correction
+ support level"
Monthly Context
"- short impulse
+ biggest volume T1
+ support level
+ 1/2 correction
+ biggest volume 2Sp+
+ weak test"

INTC Swing Long Conservative Trend Trade Conservative Trend Trade
+ long impulse
+ expanding T2 level
+ support level
+ unvolumed 2Sp
+ volumed test
+ below first bullish bar closed level entry
Calculated affordable virtual stop loss
1 to 2 R/R take profit
Daily Context
"+ long impulse
+ SOS level
+ support level
+ unvolumed Sp"
Monthly Context
"+ long impulse
+ SOS level
+ support level
+ 1/2 correction"
Give me a way better price at afterhours.
I just need my 2 R and I'm out!

AMD SWING LONGThe big overview for AMD in Pure Wyckoffian POV :
It looks like current price action, based on wyckoff map ( Atypical Re-Accumulation ),
Impending /Undergoing BUEC
I just follow the map, if this is true BUEC (Phase D) , then next will be Mark Up (Phase E)
Respect risk.
Position initiated as attached
Absolute Pure Wyckoff

STX / USDT FUTURES LONG ON SIGHTRight now i am in short position opened nearby last high, but i don't see strong reaction in this place. I will try to look for LONG positions and maybe some additional bags for my spot account.
Actual downward movement leaves so much liquidity to grab - means that it don't have much power/momentum.
We also need spring in this little reacumulation (if it's it)
I don't know if the price will come there in recent hours, days or in weeks or months.
I will try to seek long in golden hot zone
Target - new high

SAMAIDEN WILL MARKING UP ?This is an Atypical Reaccumulation Trading Range , which fall under Schematic #2
Based on Bigger view, looks like current price action is on going BUEC
This leads me to a conclusion that a Mark Up is impending
Thus, position initiated as attached
Pure Wyckoff

GBPAUD - Short - Fake Move on FibShort trade based on previous High down volume waves and the fast fake move to Fib. Move stop to BE at support and target is set at next Fib area

Wyckoff Accumulation 1 - Cspr /Usdt 1dWe are in phase D,
I ' m waiting to break Resistances area in Phase E

INJ DISTRIBUTION Injective protocol after a big run seems to be in a distribution phase according to Wyckoff. I'm looking to long it again at 20$

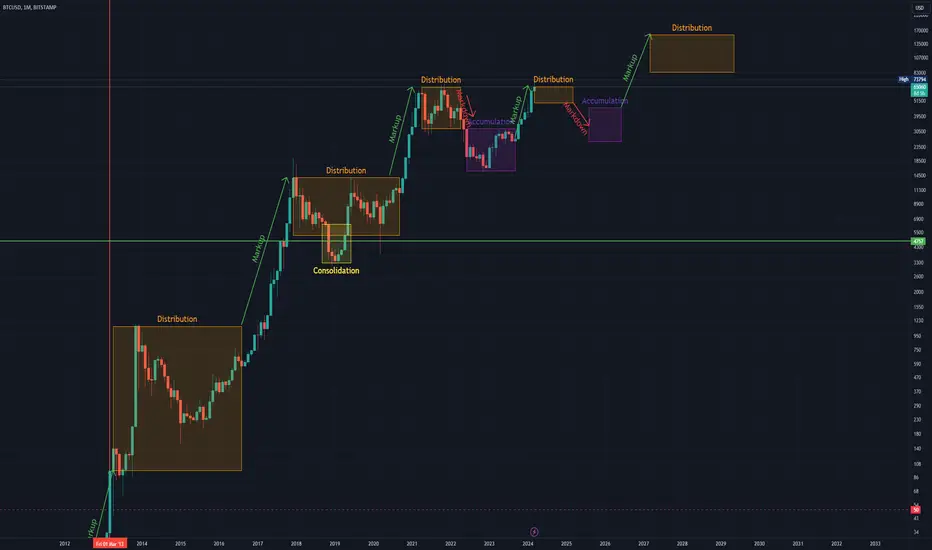
Possible (roughly estimated) Wyckoff cycle on BTCUSDThis is what I think may happen with BTCUSD based on Wyckoff cycles. I haven't checked the fibs or anything, so prices may be a bit inaccurate, but basically it works like this. Note that the prices here haven't been checked at all, and at the end of the day they don't really matter aside from the fact that market-movers know people look at them and use them to try to predict the market, which is nearly impossible unless you have enough money to set the market in your favor.
The people controlling the price (whales, institutions) can set walls wherever they want. They can cause the price to either oscillate within a range, to go up, or to go down. They are counting on human emotion (FOMO/ FUD) to drive the price one way or another.
Note also that, during cycles of Accumulation or Distribution, they are still accumulating during the lows of the Distribution cycles or the highs of the Accumulation cycles. So within these cycles are cycles of a lower magnitude.
The point is, the price is going to keep going up, because the asset has a fixed supply. They can prey on human emotion and lack of market education to predict what "most people" (the fish) will do. At the same time, they hold enough to setup walls and keep the price within certain ranges, allowing them to sell at the highs of that range and buy back in at the lows of the range.
This sounds stupid, because it literally is "sell high / buy low". In this case though, it isn't really all that stupid, because they can set the high and lows by creating buy and sell walls wherever they want to. Only a more powerful whale can really break their ranges, but that's pointless because it is in their best interest to work together and take the money from people trading on the daily, hourly and even sub-hourly oscillations. After all, they aren't counting on something going "to da moon" to pay their bills. They have enough money to survive a crash, or to capitalize on a "breakout" (which is when they stop selling and keeping the price within a range).
Most of these prices will look random, which they kind of are. But it's like putting 5 metronomes on a platform with a couple of cylinders beneath it - eventually the metronomes sync up. So their goal is less to "make money on this next day" than it is to "figure out a range that works in our best interest, and keep it going for as long as the little guys keep playing ball". Once smaller-time investors (people who have to go to work or are counting on good trades to pay their bills) dry up, they simply stop holding the price down and let people continue to buy. These are the people you should be following, because ultimately, they control the price.
That's the beautiful thing about Bitcoin. Its value is not predicated upon who has the most missiles, or who is developing some groundbreaking new technology. It is only predicated upon the assumption that it works, which it does (as a means of transferring value from one individual to another in a secure manner).
Altcoins are typically people trying to "print more bitcoin" by piggybacking off of the crypto movement in general and hoping enough fish bite the hooks. There are very, very few altcoins that have any intrinsic value which Bitcoin doesn't already have. I can't even think of one right now, so if you can please let me know.

WILL CLOUDPT CONTINUE ITS PREVIOUS MARK UPI maintained my previous hypothesis
entry as attached, initiated today
Short term swing
Pure Wyckoff

IS YBS GOING TO MARK UP PHASEvery typical of wyckoff re-accmulation (Schematic #2, Rising Bottom)
latest price action, already reaching the selling zone of composite operator
Thus, in view of that, position initiated today as attached
Pure Wyckoff
