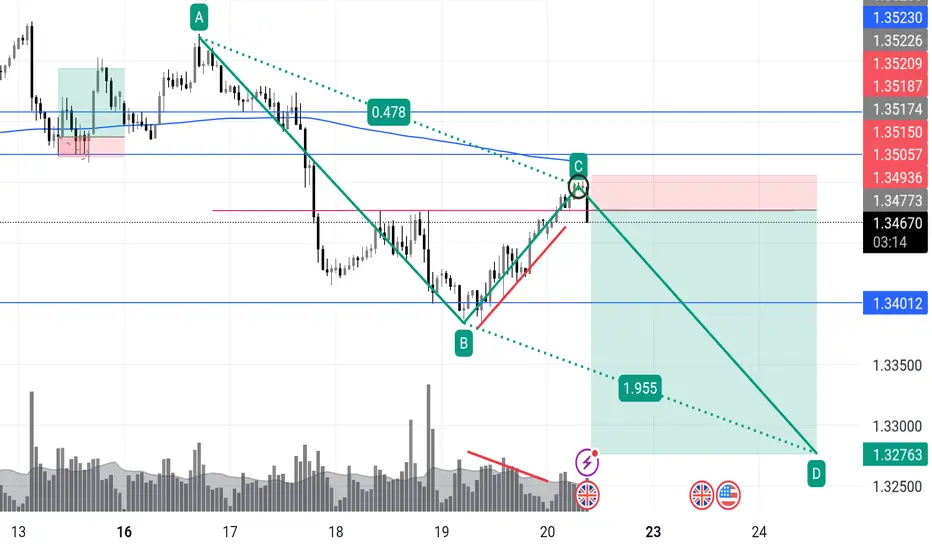
GBPUSD short!Classic Wyckoff upthrust, this is A+
We’ve got a clear AB=CD completion at C, tagging previous support-turned-resistance, while the volume on the climb is drying up (classic clue of passive buyers getting trapped). The channel top + Fibonacci confluence + previous swing zone adds weight.
🔻 Trade Idea:
Entry: 1.3477
Stop: 1.3521 (above wick highs and structure)
Target 1: 1.3401 (break structure)
Target 2: 1.3276 (full measured move / spring's origin)
Risk-Reward: ~3.5R
Volume divergence confirms exhaustion.
Ideal reaction would break through mid-line and sustain under 1.3401.
🔍 Watch For:
Bearish engulfing confirmation on 1h
Volume spike during breakdown = smart money selling
If price lingers above 1.3515, trap invalid
Wyckoff
RAMSSOL MARKING UPA rising bottom type of re-accumulation
With the influx of demand (Red Arrow)
Followed by very short term SpringBoard (4/6/25, Black Arrow)
- #1 Springboard, absoprtion Type
**Atypical Type of Springboard
position initiated today based on the Trigger Bar with a very tight risk
Purewyckoff

USDT.D Update: Range Reversal in Play?Initially in my last update, I was expecting USDT.D to push into daily supply levels after taking the swing low from the prior daily higher low — pulling back into supply before continuing lower after the market structure break.
Instead, it pushed even deeper, taking out the range low swing at 4.56%, which allowed BTC to break higher and tag its ATH by taking major upside liquidity.
Since then, we’ve seen a cool-off from those levels. Supply has come in across majors (notably TOTAL), and I’ve been tracking the local range forming in USDT.D — forecasting a reversal back into supply. That reversal is now starting to show itself, with USDT.D rising as BTC and alts pull back.
I'm currently watching for a push into the 5.0% – 5.6% supply zone, which I believe could mark the next major pivot point for the market.
From there, I’ll be looking for weakness or signs of rejection in USDT.D — which would align with BTC and the broader market setting up for another leg higher.
Once this supply is hit and the move starts rolling over, I expect USDT.D to begin its final phase down toward 3.73% — a key HTF demand and bullish reversal level. That would mark a major shift, coinciding with what I believe will be the macro market top forming across risk assets.
This level will be one I’m watching closely for DCA entries and scaling back into exposure — the reversal in USDT dominance from that zone should align with the last stage of the current cycle before distribution takes over.
1D:
3D:
1W:
3M:

Final Shakeout Before BTC’s Last Leg Up?BTC Update
Well due update here...
Since my last forecast, price pushed higher without giving the pullback I was anticipating — instead sweeping liquidity above the prior ATH.
After taking that BSL, price stalled and has since been ranging, showing clear signs of bearish momentum creeping in. We're seeing bearish orderflow on the LTF and daily, and volume is thinning out up at these highs — not ideal for bulls.
USDT.D is also pushing higher and showing strength, which typically leans bearish for BTC in the short term. The structure on that chart is bullish and supports the idea of a BTC pullback being likely before any continuation higher.
That said, I'm still pro-trend bullish overall — as I mentioned in April — thanks to the clean bullish shift from the range lows and clear signs of accumulation. We’ve got textbook last points of support (LPS) and unmitigated demand sitting below current price, which are prime candidates for a reversal.
Right now I’m eyeing two key levels:
Upper demand zone / LPS — lining up with the top of the prior accumulation range. This has strong confluence as a breakout-retest zone.
Lower refined weekly/2W demand — valid if we see a deeper flush or capitulation leg, though less likely in the short term.
My focus is on the first level. I’ll be watching for reactions and reversal signals if price taps into it. Same logic applies to USDT.D as it approaches nearby supply zones.
Overall, I see this as a healthy correction — overdue after an extended leg — and expect BTC to push higher and break ATHs once demand is retested and confirmed.
Zooming out: the 4-year cycle is approaching its final stages, with data suggesting a cycle top could form around Q3/Q4 2025 — likely between August and October, if past cycles rhyme. I’ll be monitoring major assets against that timeline and will look to scale out and risk-off when the confluences begin aligning with that macro cycle window.
Just think...
1 last BTC leg up...
Final altseason hype to drag in latecomers...
Then the cycle ends — and the trap shuts as we re-enter bear territory.
Charts:
1D:
3D:
1W:
Extra:
1M:

EURUSD LONGPrice swept below support around 1.1473, grabbing liquidity and quickly bouncing back — this is a classic Wyckoff spring setup.
📌 Key Levels
Entry: Around 1.1500
Stop Loss: Below 1.1424 (spring low)
Target 1: 1.1567 (range high)
Target 2: 1.1614 (measured move)
🔍 Why I like this setup:
Fake breakdown (spring) and quick recovery
Buyers showed up right after the sweep
Expecting price to return to the top of the range and possibly break higher . This a trade we hold
💡 A spring is where smart money steps in after trapping sellers — I'm following them.
“I always say that you could publish my rules in the newspaper and no one would follow them. The key is consistency and discipline.”

USDJPY Long potential setupWhat's going on?
USDJPY – Reload Zone Marked. If They Take Me Out, I’ll Be Waiting Lower.
Discipline means you don’t chase. You wait where the market must return.
Currently in 2 buys, one is an added position, then I moved my stop in from the purple line— but if those get wicked out, I’m hunting the next key demand zone just beneath 144.10. Where we'll have a textbook spring setup!
🧠 What I See:
We're forming a potential micro accumulation structure.
If the current position gets taken out, I’ll reload lower at the spring aligned with the prior reaction low + liquidity sweep zone.
🎯 Next Area of Interest:
Zone: 144.00 – 144.10
📌 Target Remains:
144.76 → 145.36
1.618 extension aligns with supply inefficiencies & range completion
---
> “Stop loss isn’t failure. It’s recon. The second entry — that’s where pros feast.”
I’m not trading emotion. I’m trading plan + precision + execution.

BTC.D - Could it be Wyckoff Distribution DevelopingJust toying with ideas of what may be developing here so dont take the chart as what i think will happen perfectly as shown.
With the strength seen from BTC.D atm, it looks more and more likely it may go for the highs again and into the higher levels above 65%.
I still see this as a very large range from the february high and lows that got put in and the prior high was a deviation of the larger range resulting in the reaction we seen.
We could expect to see a further deviation of the range highs and this wouldn't be uncommon in the development of a wyckoff distribution range.
Im still looking for a HTF reversal bearish from these supply levels and my bias doesnt change right now as we continue to develop this range until proven otherwise.
That being said, we could see some further weakness in altcoins until this tops out and gives us the right confirmations of a trend shift bearish.
1D:

Wyckoff Up-Thrust - This is how to identify using Speed indexClassic Wyckoff Up-Thrust formation, this is how to read it using Speed Index (annotations in sync with the chart):
1. Fib Area - this is where sellers might come in
2. FU - Fast Up wave with SI 0.4F
3. Next up wave with an abnormal SI of 1.0S while the average speed at 0.5, which means price has a hard time to move up (more sellers on the up move). Following the up wave on the down move we have double Short signals WU-Wyckoff Up-Thrust and PRS-Plutus Reversal Short and this where we enter.
I hope this was helpful. Enjoy!

USDCAD Long – Wyckoff Spring PlaybookCause > Effect. Behavior > Breakouts.
We just printed a classic Spring + Test setup.
Here’s how the puzzle came together:
🔍 Accumulation Context:
Market ranged quietly for hours – demand building below the surface.
Spike down into previous demand zone with climax volume – the shakeout.
Quick reclaim of the zone with bullish absorption signals the Spring.
📈 Execution Plan:
Entry just above the spring low at 1.3617
Stop below spring at 1.3612
Targeting inefficiencies at 1.3645 and 1.3651 (prior supply pockets)
🎯 Why I Like This Setup:
Structure: Matches Wyckoff Spring logic (Phase C → D transition)
Volume: Shakeout came with high effort, followed by efficient reclaim
Timing: Happens in a zone where other traders might still be stuck short
> “In trading, the ones who recognize intent get in before confirmation.”
This trade idea isn’t about being right — it’s about understanding behavior.
I’m not reacting to candles. I’m tracking the motive behind them.

SUNWAY GOING MARK UPFor Sunway, This is an Atypical Re-ACcmulation Schematic #1
-I maintained my prev hypothesis
(Position triggered Stop Loss Level, probably i was too early for this)
*refer my prev post
I view sunway as a Top Competitor, which my no.1 pick would be Gamuda (Refer my prev post)
-Both of which are Insti. Fav
As for the dropping in earnings, the technical side is too beautiful to ignore
Formation of Feather's Weight (Blue LIne)
Along with Possible SpringBoard (Red Line) in action
Would be good sign, if today & upcoming Bars/Candlesticks, succesfully closing above the suply
on 10/6/25 (Red Arrow)
Position initiated with very tight Risk
PureWyckoff

Aggressive Trend Trade 1HAggressive Trend Trade 1H
- short trend
+ volumed T1
+ support level
+ biggest volume 2Sp+
Daily Trend
+ long impulse
+ T2 level
+ support level
+ 1/2 correction"
Monthly CounterTrend
"- short balance
+ expanding ICE
+ support level
+ unsuccessful biggest volume manipulation"
Yearly Trend
"+ long impulse
+ 1/2 correction
- below exhaustion volume?
- below SOS"
Will add more when 5M, 1H or 1D will show entry point

BITCOIN WEEKLY WYCKOFF — DISTRIBUTION OR REACCUMULATION?BTC has formed a textbook Wyckoff structure on the weekly chart — but are we entering Phase D markdown, or is this just a trap before continuation?
📉 Distribution Case (Primary Bias):
BC → UT → UTAD clearly defined
Bearish RSI divergence at UTAD confirms momentum exhaustion
Volume drying up = weakening demand
🎯 Targeting the 0.618–0.66 fib zone near 87k–89k, confluence with previous structure
🧠 Reaccumulation Possibility (Alternative Scenario):
Structure also mimics Reaccumulation Schematic #2
If support at 101k–104k holds and price reclaims 112k with strong volume → UTAD may prove to be a SOS, not a trap
⚠️ Levels to Watch:
🔺 UTAD: 112,087
🔸 BCLX: 108,496 → structural pivot
🔻 AR: 92,160 → distribution confirmation if lost
🎯 Target: 89,050 – 87,206 (fib + horizontal confluence)
🟠 Final invalidation for reaccumulation: weekly close below 87k
Whether we’re heading for Phase D markdown or one final shakeout before markup, this structure will define BTC’s path for the coming months.
Bias: Bearish unless price reclaims UTAD with strength.
Conviction: Grows with breakdown + volume spike under 101k.

US500 potential buyUS500 is setting up for a classic Wyckoff spring. This is a high probability set up with high risk to reward (5R+)
Here is what needs to happen
For situations 1 and 2,
a. price should break blue support (traps sellers and shakes out weak hands)
b. price should then close above any of the 2 blue supports with high volume
c. enter at the close of that bar or retest of the blue line
d. T.P @ recent high.
What do you think? how would you approach this better?

POLAND - WIG20 - ALLEGRO going UP soon (MID THERM)Im watching this asset few months now with all its latest ups and downs. There is my trading plan for near future. Based on Elliot waves theory and Wyckoff accumulation schematic i think that we are see higher tops soon.
Elliot: Currently in the beginning of third impulse wave. Second wave ended at 0.618 of first wave.
Wyckoff: End of phase C / beginning of phase D
First target 38-39 PLN
Second target 42-45 PLN
Third target (end of 3rd impulse wave) 49-52 PLN.
Let me know what you think in the comments below, happy trading.
Its only my opinion, not investing advice.

SCGBHD TO CONT MARK UPThis is a continuation trade idea from my prev post
***refer to link below
Since the BUEC , Price advancing for about 45%..
Not qualified for a Power Play by the way
**(Or can consider Semi Power Play)
With a formation of Feather's Weight (Red Line)
SpringBoard sign prompted me to initiate position as attached
Tight Risk
PURE WYCKOFF

BTCUSDT – Bear Flag Breakdown Imminent?Price is forming a textbook bear flag following the sharp drop from ~108.8K.
The structure shows rising lows in a tight channel, typically a pause before further downside.
📉 Bear Flag Anatomy:
Breakdown support: ~104,000
Measured move target: 98,810
RSI: 49.94 — hovering just below neutral, watch for dip <40 for breakdown confirmation.
Volume: Still low — waiting for a spike to confirm supply pressure.
🧨 Trigger Conditions:
4H close below flag support
RSI < 40
Volume spike above 20-bar average (~1.96M)
🎯 Short Plan:
Entry: Rejection from the fib golden pocket or flag support breakdown
TP: 98,800 (pattern target, confluence with prior support)
🔍 If confirmed, this breakdown could mark the start of a Phase E markdown in Wyckoff terms.
💬 Let me know your thoughts below — are you shorting this flag or expecting a fakeout?
#BTC #Bitcoin #CryptoTrading #BearFlag #ShortSetup #Wyckoff #PriceAction #4HChart

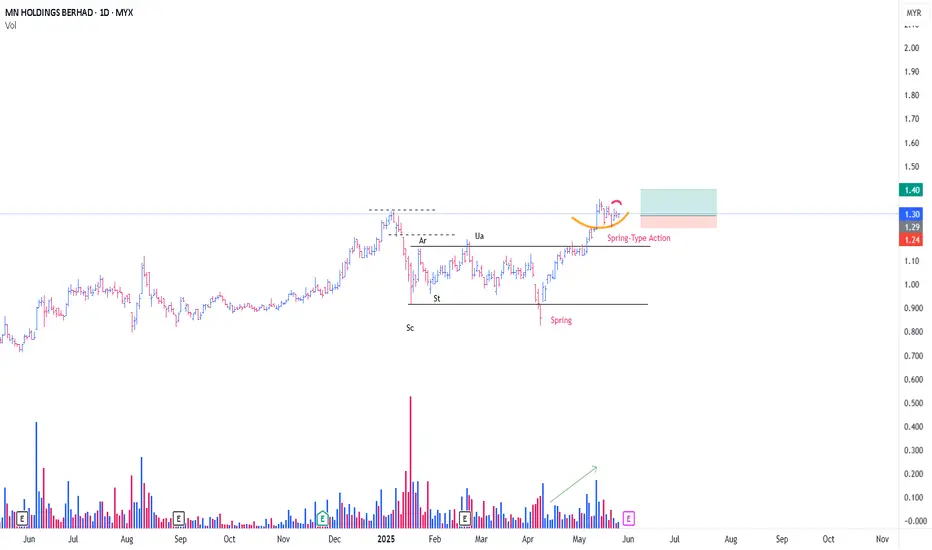
MNHLDG CONT TO MARK UPA rare schematic, of Type #1 Accmulation
This is a Power Play
-Since Spring, price soaring high with influx of demand (Green Arrow)
With a Possiblity of Feather's Weight ( Yellow LIne)
-Position initiated @ Spring Board (Red Line)
-Plus with additional Local Spring Type Action
Position intiated as attached
Tight Risk
PURE WYCKOFF
PLUG 1D Investment Long Aggressive Trend TradeAggressive Trend Trade
- short impulse
+ volumed TE / T1 level
+ support level
+ biggest volume 2Sp-
+ weak test
+ first buying bar close level
Calculated affordable stop limit
1 to 2 R/R take profit
Monthly Trend
"+ long impulse
+ support level
+ T2 level
+ biggest volume reaction bar
= below 1/2 correction"
Yearly CounterTrend
- short impulse

BTC Breakdown – Reaccumulation at RiskBitcoin just posted a decisive 4H candle close below 55 SMA, mid-Bollinger Band, and the primary ascending trendline. Volume spiked to 7.31M, and RSI dropped to 38, confirming bearish momentum.
⸻
🧩 Wyckoff Structure Under Threat:
• ❌ LPS level invalidated
• ❌ Phase D uptrend broken
• 📉 No breakout above ATH (~109.8K) after three attempts
• 🟠 Still holding BC (Pole End) at ~105.8K
• 🔁 If this breaks next, the entire Phase D/E thesis collapses
⸻
🔻 What’s Next?
• Support:
• S1: Lower BB (~106.9K)
• S2: 105.8K (BC level — key structural base)
• Break of 105.8K = invalidation of reaccumulation, transition into potential distribution. Watch for daily close for confirmation.
• S3: Point of control at 104k
⸻
📊 Breakdown Triggers Confirmed:
• ✅ Close below mid-BB (108.9K)
• ✅ RSI < 45
• ✅ High-volume red candle
• ✅ Structural break of ascending LPS pattern
A short hedge can be initiated with a tight stop over breaking candle high. Note that this could be the shakeout moment i mentioned in my related post.
⸻
Unless BTC recovers 108.5K+ with rising volume quickly, this is now a valid short breakdown, and reaccumulation thesis hangs by a thread.
#Bitcoin #BTCUSDT #Wyckoff #Breakdown #CryptoTA #BTC4H #PriceAction #TechnicalAnalysis

BTC Daily Breakdown – Major Uptrend BreachedBitcoin has now closed below the multi-week ascending trendline on the daily chart — the same trendline that defined the entire Phase D markup structure.
⸻
🔍 Breakdown Highlights:
📉 Daily Close: 107,764 → well below trendline ✅
🔻 Volume: 18.42M (near 20-day average) → not a panic candle, but confirms exit ✅
📉 Fibonacci Cluster: 0.5 (107,093) and 0.618 (105,495) now in play ✅
⚠️ RSI (14): 61.14 → still neutral, but diverging from price ❗
🧱 Next supports:
• 106,146 = BB basis
• 105,821 = BC Pole End
• 104,000 = Point of control from volume profile
⸻
🧩 Structural Impact (Wyckoff View):
• ❌ Trendline break = Phase D invalidated
• ❌ No breakout above ATH (109,852) after 3 attempts
• 🟠 Still not fully invalidated — if 105.8K holds, Spring-like scenario still possible
• 🔻 Close below 105.8K = Phase C fails → transition into Redistribution
⸻
⚠️ What to Watch Next:
• Bounce from 106.1–105.5K with volume could offer one last recovery setup
• A close below 105.8K confirms structural invalidation
⸻
🧠 Final Take:
The trendline break is real. Bulls need to defend the Fibonacci cluster + BC base around 105.8K. If that gives way, this becomes a failed reaccumulation and BTC risks a deeper structural rotation.
#Bitcoin #BTCUSDT #Breakdown #Trendline #TechnicalAnalysis #Wyckoff #BTC #CryptoMarkets #BTCdaily

PLUG 1H Long Swing Conservative Trend TradeConservative Trend Trade
+ long impulse
+ 1/2 correction
+ volume zone
- strong approach
+ ICE level
+ support level
+ volumed Sp
Calculated affordable stop limit
1 to 2 R/R take profit
Daily Trend
"- short impulse
+ volumed TE / T1 level
+ support level
+ biggest volume 2Sp-
+ weak test"
Monthly Trend
"+ long impulse
+ support level
+ T2 level
+ biggest volume reaction bar
= below 1/2 correction"
Yearly CounterTrend
- short impulse
Will add more after successful test on 1H and / or after test completes on 1D.

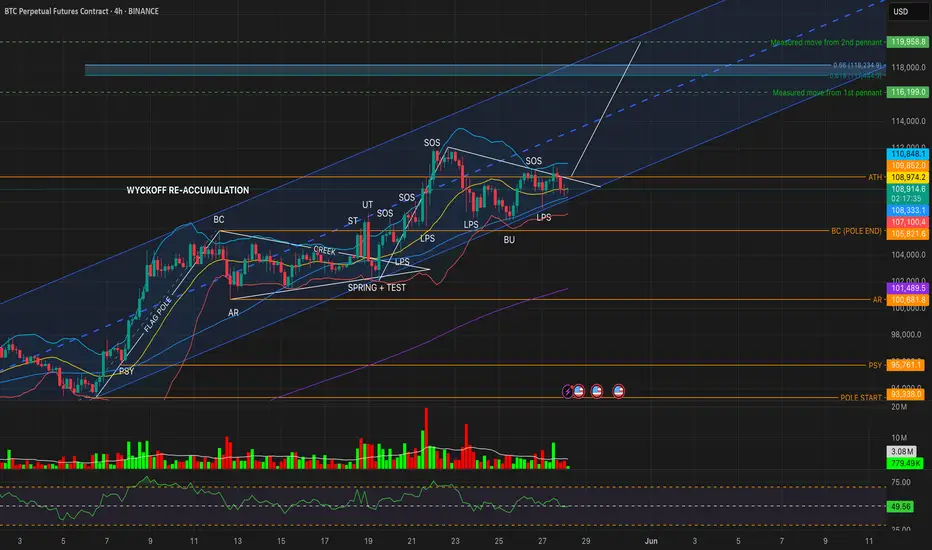
BTC 4H – Final Shakeout Before Markup?Bitcoin continues to coil below ATH resistance, now forming a second symmetrical pennant after the first flagpole breakout. Price is wedged between the ascending trendline support and persistent ATH rejection (~109.8K) — and the next move could define the entire Phase D → Phase E transition.
🧠 Wyckoff Reaccumulation Context:
✅ Spring + Test confirmed ~May 19
✅ Multiple LPS retests held around 107–108K
✅ Two clear SOS rallies tested above the creek
📌 Currently in late Phase D, facing third rejection from ATH
⚠️ Compression Observations:
RSI (14): 49.88 → neutral to bearish momentum
Volume: No conviction from either side
Lower BB + BU lows (~107K): A logical Spring zone for a potential wick-down fakeout
Price remains within channel and trendline support
🔄 Key Scenarios:
🟡 Bullish (Spring + Markup)
Wick below trendline to 107K zone
RSI bounce + green volume spike
Break + close above 110K → Confirms Phase E Markup
🎯 Targets:
Measured Move 1: 116,199
Measured Move 2 (Pennant): 119,958
Fib Cluster: 117,444 – 118,234
🔴 Bearish Breakdown
Close below 107K LPS with volume
RSI drops < 45
Structural failure → risks reversion to AR (~100.6K) and possibly BC
🧭 Conclusion:
Bitcoin is in the decision apex of a second pennant. If we see a wick-down + bounce (Spring-like behavior), it could be the last reload before a markup wave.
But without volume and momentum, this remains a fragile structure — stay patient, let the chart confirm.
#Bitcoin #BTCUSDT #Wyckoff #Pennant #CryptoTA #BTC4H #VolumeAnalysis #RSI
BTCUSDT 4H – Reaccumulation Apex Compression | Decision Time📌 Price is now being squeezed between major trendline support and ATH resistance (~110K) — forming an apex structure, typical of Wyckoff Phase D → Phase E transitions.
🧠 Wyckoff Structure So Far:
Phase A/B/C: BC → ST → UT → Spring → LPS
Phase D: Multiple SOS rallies followed by a BU (backup to edge of creek)
Now: Testing the upper boundary of the range again — is this the launch point for Markup (Phase E)?
🔼 Bullish Breakout Conditions:
✅ 4H close above 110,625
✅ Rising volume above 27.4K MA
✅ RSI > 60
🟢 Targets:
TP1: 116,199 (measured move from pennant)
TP2: 117,449–118,237 (Fib confluence zone)
TP3: Trailing TP with 1.0% callback
🔽 Bearish Breakdown Risk:
❌ Close below 107,867 with RSI < 45 + rising volume
Would signal failure of the BU and reversion toward:
BC: 105,863
AR: 100,678
📊 Indicators:
RSI: 55.77 (neutral/bullish)
Volume: Still below average — shows compression
55 SMA: 107,762.7
BB Midline: 108,653.9
⚖️ No hedge short entry valid yet
Let the apex resolve — patience until confirmation.
#Bitcoin #BTCUSDT #Wyckoff #CryptoTrading #TechnicalAnalysis #BTC
