EURJPY SHORT IDEAAfter a quite long distribution structure has taken place, this pair finally started to decrease as expected. You should be looking for sells here from the marked zone, with your tp set all the way to the bottom zone.
Wyckoff

AUDJPY Short planBased on the Wyckoff methodology and Volume Profile, we can assume the current channel is distribution, and price potential moves down next week. If the price reverse to the 92.3 - 94.2 area, I will do a short trade at 92.6 and the 2nd entry is 94, then hold it to 84.7.
This setup looks very basic, but it's really effective. Let's follow the plan and see what will happen.


TSLA Re-Accumulation or Distribution?Re-Accumulation or Final Phase of Distribution with *UT - Failure to close above 200? We will find out soon.
I am still Bearish but this will be interesting...

USDCNH IN WYCKOFF DISTRIBUTION - Seasonally CNH is strong in DEC + JAN
- Seasonally USD is weak in DEC
- Technically a Wyckoff distribution seems to unfold
- A last upthrust / stophunt could happen but not likely
- Looking for a 1 deviation drop = sellside liquidity-zone

BTCUSD: Wyckoff Accumulation on the 4HIt looks like the market makers performed a quick Wyckoff Accumulation phase on the 4H of BTCUSD.

EUR Wyckoff distributionEUR Wyckoff distribution schematic 2, looks like a good opportunity to short

Moar Wyckoff nonesenseWas trying to explain Wyckoff to someone and so I explained it best I could then gave them a standard Wyckoff diagram.
After that picked a random coin and looked at different time frames, and was able to spot a Wyckoff cycle.
I marked up the chart with Wyckoff annotations and since I spent the time doing it I figured I'd share it to see if it helps anyone.
This is a downtrend, but Wyckoff is still occurring at different time frames...

WYCKOFF EVENTS AND PHASES BTC USDT TODAYNEED HELP GUYS.
IS THAT A SPRING ?
I was comparing the #btc chart from the 1st November till that day, and I have compared it with Accumulation schematic #Wyckoff events and phases, I did my best to figure out the main phases.
I put the different levels and indicate all the points.
now I need just your help to tell me if that was a spring at the range of 15476/15583...


Crypto Total Cap - Wyckoff Accumulation Bottom (expectations) This is our point of view and it's not Financial advice. We Rolings Capital think that the bottom is very close and Wyckoff help us to find the Accumulation Phases.

AUDJPY, short idea...I've been watching this pair for a while and noticed how long the distribution phase took to (almost) complete. I say almost because we are in a confirmation phase right now and I'll personally shorted from there with my targets all the way to 83.2/83.0.

ECF CO2 Credits, Accumulation pattern?(Chart view looks weird, see image below instead)
Here's a pattern I've enjoyed emerging for the past few months. It seems to not be following the usual rules regarding support and resistance lines, which is why I missed it at first. That is likely due to the nature of these CO2 credits and the way they are traded. To me it seems pretty clear that it at least follows a classic Wyckoff Accumulation pattern to some degree. Could be a coincidence, who knows? I've been lucky so far since finding this curious wyckoff similarity. It will be very interesting to see how well it will finish the schematic. I'm trading the certificate TRACK CO2 VON (Nordic MTF) for these movements.

BTC LTF SHORTHere we see the example of The Wyckoff accumulation Method.
Phase A fully formed. Waiting for SHORT to SC.
Target on graphic, but it could change, wait see how phase B will formed.

Wyckoff Ascending Wedge More selling pressure will accelerate this idea. keep eyes from here and level 1.05.55

CRUDE HIGHER IN DECLooking for higher prices in Crude
Price cap talk, Diesel shortage and OPEC+ cuts all hint on higer prices

Solana Wyckoff CycleSOL is currently trending in what looks like Wyckoff re-distribution range, after marking down from a brief top and on the path of reconciling the lower macro liquidity void found at the 2% Fibonacci (11 USD) level. These retracement levels can be used as reliable DCA points if Solana's rebirth is something you have faith in.
If you have strong hands, patience, and like big wins, SUBSCRIBE and follow me.
I track all the USD-paired cryptocurrencies on CEXs like Coinbase and regularly seek out the most potentially lucrative swing trades for you. All my charts are clean, straightforward, and easy-to-follow with exceptional win rates ranging consistently between 80-85%. My technical analysis is based upon Volume/Spread Analysis, Wyckoff schematics, Elliott wave theory & Fibonacci ratios. If some of my sell/take profit zones seem conservative, it's because I believe in exiting the casino while still holding the money bags! The more intrepid traders can let their winners run a bit longer. Good luck and safe trading to all!
*Not financial advice. DYOR and trade at your own risk.

BTC LTF LONGHere we see the example of The Wyckoff accumulation Method, for now fully formed. Seems that phose A formed. Waiting for long. Target on graphic, but it could change, need to wait till phase B done.

AAPL Wyckoff distribution topI believe AAPL is forming a wyckoff distribution top, very similar set up to IWM in 2021. Therefore, I expect big tech to have a nice rally into next year after this pullback finishes. AAPL support is around 137-135 area, so that's where I'd like to buy it if I can. I hope you enjoy the video!

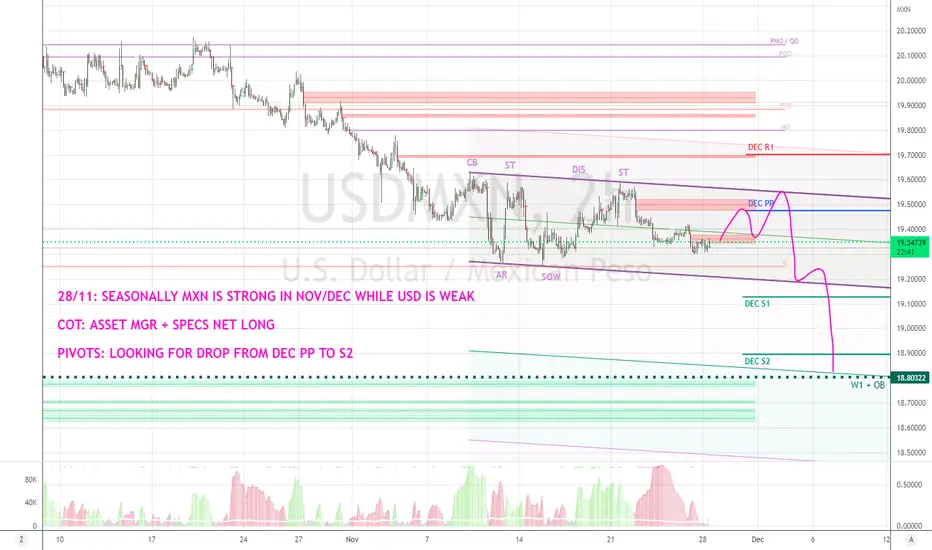
USDMXN LOWER BEFORE X-MASS- Seasonally MXN is strong in NOC/DEC
- Seasonally USD is weak in DEC
- COT supports this outlook
- Asset Managers + Leveraged Money accumulating Longs
- Leveraged Money also distributing Shorts
- Looking for a drop from DEC Pivot to DEC S2
- Higher Timeframe objective is Weekly Bullish Orderblock at 18.80
COT: images2.imgbox.com
2023: YEAR OF BITCOIN (Wyckoff Accumulation)Possible Wyckoff Accumulation forming between BTC and the rest of the market. Reference: forexop.com

XAUUSD WYCKOFF RE-ACCUMULATIONThis is for short term
And this is risky too.
Please DYOR before entering the trade.

USDJPY H2 LOWER IN DECLooking for a weakening Dollar in DEC
Seasoanlly Dollar is weaker end of year
Run from Monthly Pivot to Monthly S2
