GBPJPY ...bearish 4H viewAfter completeion of the distribuation phase of Wyckoff with breaking out the support level which converted to resistance...retest was done and formation of new downtrend below the Fibo 0.61 level, below MA200 and bouncing off the trend line ...down move is expected from that level...be safe..
Wyckoff

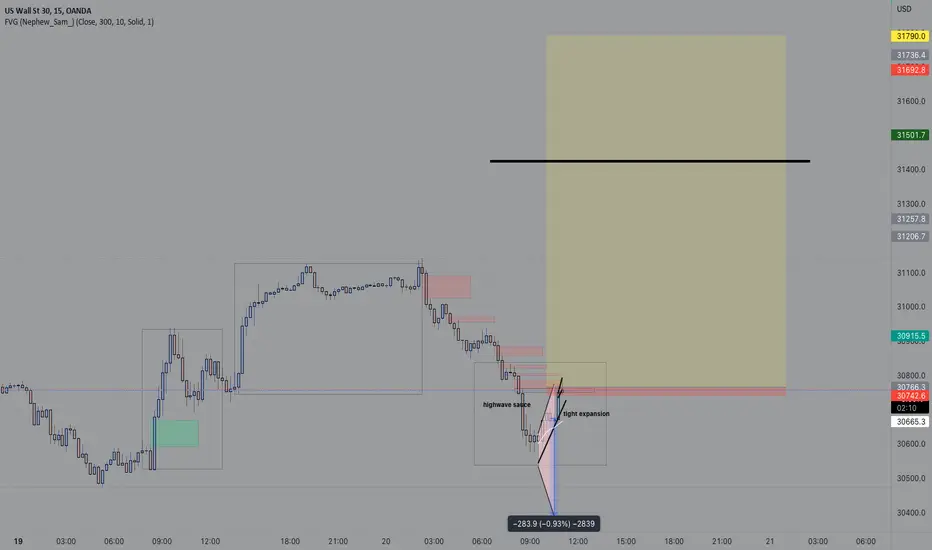
Wednesday reversal on GU all time low broken. BUYS are coming...In this video we summarize how we got into GBPUSD trade, as well as give an idea of what is most likely to happen next!
enjoy, if you got any questions don't hesitate to reach out!

BTC/USDT 4hBTC/USDT 4h
▪️Judging by the situation, bitcoin decided to go up anyway, take liquidity from above, and also test the zone 22054.07-22713.92. If it doesn’t go so high, then at least you need to show the overlap of the imbalance by half, it will just be a premium zone of about $21415 +- and after that, I think we should again expect a downward movement, the formation of accumulation and an exit up after removing liquidity at 17600. I don’t think that let's go up a lot, there are unfinished business downstairs, and there are also a lot of people waiting for him downstairs now, so it would be logical to go upstairs.

LUNC wyckoff accummulationBINANCE:LUNCBUSD probably doing a wyckoff accummulation phase as BINANCE:ETHBUSD did long ago. My theory is that market do a reversal after a triple top is formed. Hence, only one top has been made so far. This is subjective to market conditions.

BABA - Wyckoff accumulation patternNo one knows what will happen, but so far this is textbook accumulation pattern according to Wyckoff. Spring next??

ZW LONGThe wheat is now in a clear collection area
We expect wheat prices to rise from this area, as shown in the graph

Readjusted Possible Wyckoff Accumulation range on LUNCTracking this possible range of accumulation a bit early but it looks like we've hit a secondary test (ST) in phase B and possibly going into phase C with the last point of supply ( LPS ) being accumulated by holders and market makers. It goes with the narrative that everyone just jumping onboard with staking and becoming a validator node for the network.

Possible Wyckoff Accumulation range on LUNCTracking this possible range of accumulation a bit early but it looks like we've hit a secondary test (ST) in phase B and possibly going into phase C with the last point of supply (LPS) being accumulated by holders and market makers. It goes with the narrative that everyone just jumping onboard with staking and becoming a validator node for the network.

WHY (bitcoin) Could go OFF?
Hello World! This is my first post here.
I have been watching the accumulation of Bitcoin and see a potential Wyckoff pattern developing? What do you guys think?
BINANCE:BTCUSDT

Here what i think about TSLANASDAQ:TSLA is paying within 260 - 315 range area.. which is not so wide range for TSLA. i really don't a serious selling in TSLA. CME_MINI:ES1! is near the low of this year (2022) , which 3650s area (June low). if ES run out supply, and i think it should, TSLA will bail out all of seller at 315 area, poor structure. let's watch this moves..

BTC still in accumulation phase?BTC has been showing some signs of a potential reversal. Once again by using Wyckoff guidelines, I think that an accumulation phase is on going.
A reversal will be confirmed when the "upward sloping accumulation structure" (in 2D TF) will have been completed. It means that the $30000 is a key level.
Before approaching this level, BTC may be still fluctuating, in accordance with the macro factors' uncertainties (stock markets, FED decisions, war...). In my opinion, BTC would revisit the $20000 level. This would be a good opportunity to accumulate BTCs (with precaution of real breakdown that "Accumulation" is invalidated and becomes "Redisctribution")
PS: Even if the prices don't follow exactly the theoretical Wyckoff structure, the resistances/supports and events would still be useful for trades.

BTC WYCKOFF ACCUMULATION?WYCKOFF ACCU PHASE?
MIGHT BE ?
Looking great ngl ,
We`ll prob see 20000 by the next week :)
Good Luck to every1

YZJ - Breakout from SupportSign of Strength in the chart:
1. Bullish signal with volume
2. NS signal with Pullback
Disclaimer
This information only serves as reference information and does not constitute a buy or sell call. Conduct your own research and assessment before deciding to buy or sell any stock

S&P 500 - Wyckoff modelBased on wyckoff acumulation model, waiting FOMC it could well be big buys on that zone before news

LETS GO DIRTY30BULL RUN EMINENT PLEASE FASTENT YOUR SEATBEALTS AND ENJOY THE RIDE,ive been paitiently waiting for the A+ setups I wanted to see and now that the market is reviving itself I feel that this is my perfect opportunity to get in(not financial advice)!
BTC - potential double bottomHello,
It's been a while since the last crypto pair update I made, but since we are more or less in a full blown bear market I decided it is worth the time to start sharing ideas again without the need to include moon targets in every post to gain viewers etc.
The gameplan here is simple.
On the main chart - BTC/USDT on 1W we see a clear Double bottom pattern in the making. If we manage to get a proper upside and break the neckline then we get our reversal with main target right above the long-term diagonal resistance line around $32,000.
We lose $19,000 and the doors to the $10,000-$12,000 OB will be wide opened.
Now, switching to the 1D chart, I cannot pretend I cannot see the similarities between the price action in the last few months and the Wyckoff Distribution Schematic #2. So we might have entered Phase E which is the final act and we are about to see the final capitulation before starting the cycle again.
There is a big chance we are in Phase A of the ACCUMULATION already which suggests a re-test of the support will be next.
Then we can see something like this:
As always, we need to adapt to what is going on on the charts as they evolve and are impacted by both TA and fundamentals.
Cheers,
