DAX futures after Trump - Zeleansky clash meetingMarket Analysis: Anticipating March Volatility
The market is demonstrating superior collective intelligence through recent price action. The EUREX:FDXM1! index has established balanced profile patterns over several consecutive sessions, indicating a lack of directional conviction among participants. This consolidation phase suggests market participants are in a holding pattern, awaiting catalytic information before committing to directional positions .
Friday, February 28th marked both month-end rebalancing and a critical geopolitical event as markets positioned ahead of the Trump-Zelensky meeting. The subsequent contentious Oval Office exchange between the US and Ukrainian presidents on February 28th has created significant geopolitical uncertainty . This high-stakes diplomatic confrontation, which ended without the anticipated minerals agreement being signed, has introduced a new variable into market equations .
Projected Market Impact
Early March is likely to experience heightened volatility across multiple asset classes:
- **European and US Indices**: The breakdown in US-Ukraine relations and resulting implications for European security policy will likely trigger significant price swings in both US and European equity markets . With European leaders now forced to reconsider their defense strategies in light of potentially diminishing US support, market participants must reprice risk premiums accordingly .
- **Commodities**: Oil and gold NYMEX:CL1! COMEX_MINI:MGC1! markets should see amplified movement as geopolitical tensions typically drive safe-haven flows and energy price speculation .
- **Currency Markets**: The dollar CAPITALCOM:DXY is positioned to strengthen against major currencies as uncertainty typically benefits the world's reserve currency, particularly when European geopolitical stability comes into question .
The DAX futures, currently showing mixed signals from analysts with projections ranging from 17,500 to potentially higher levels by year-end, will likely experience increased volatility in the near term as markets digest these developments .
Wyckoff

KPJ MARKING UPAn Atypical Re-Accmlation Schematic #2 (Rising Bottom)
With Supply evaporating (Green Arrow)
In the Background of Local Spring,
All these, with my assumption that, the St (phase B),
acting as a Change of Character (Choch)
entry n Stop loss as attached
Pure Wyckoff

MGNT 1H Long Investment Conservative Trend TradeConservative Trend Trade
+ long impulse
+ SOS level
+ 1/2 correction
+ volumed 2Sp-
- day will close without test
Calculated affordable stop limit
1/2 1M take profit
Daily Trend
"+ long impulse
+ SOS test / T2 level
+ support level
- strong approach from volume zone
+ biggest volume manipulation"
Monthly Trend
+ long impulse
+ expanding biggest volume T2
+ support level
+ 1/2 correction
+ unvolumed 2Sp-
+ strong buying bars
+ weak selling bar / test
Yearly no context

Ford 1D Investment Aggressive CounterTrend TradAggressive CounterTrend Trade
- short impulse
+ exhaustion volume
+ 1/2 correction
Calculated affordable stop limit
Take profit:
1/3 to 1/2 Month Trend
1/3 to Month T2
1/3 to Year 1/2
Sell F Limit at $14.95 (Good 'til Canceled)
Sell F Limit at $11.57 (Good 'til Canceled)
Sell F Limit at $10.21 (Good 'til Canceled)
Monthly CounterTrend
"- short impulse
+ 1/2 correction
- unvolumed T1
+ support level
+ reverse volume approach
+ volumed manipulation"
Yearly Trend
"+ long impulse
+ volumed T2 level
+ volumed 2Sp+
+ weak test"

Strength on HPQ ChartHP Inc., stock approaches the bottom of the sideways channel (black horizontal lines) from which it may bounce again.
During the May 29, 2024 bar, professionals bought (blue rectangle), and since then, whenever the price reached this zone, they were buying more.
It should be noted that the buying around the bottom of the sideways is much bigger than the selling around its top which is bullish behaviour. Wyckoff's Spring on the recent activity adds to strength too. Another good sign for bulls is the decreasing volume on the down move, which indicates an absence of professional interest in lowering prices.
The testing process is ongoing as of today. If the price reaches the buying zone and no supply reappears, there is a big probability for a move up towards $37.30 - $ 39.29 with minor resistance around $34.62 - $34.72.
If supply reappears and the price breaks the bottom of the sideways channel ($32.41) we may see another leg down to $29.00 - $30.00 for more buying.

Litecoin Wyckoff Accumulation 2024One may dream that LTC truly follows suit and stay on course.
I do find Litecoin to act pretty technically accepting in the past but you never know...
Just wanted to throw this Idea out there and have a place to look back to when Litecoin takes off...

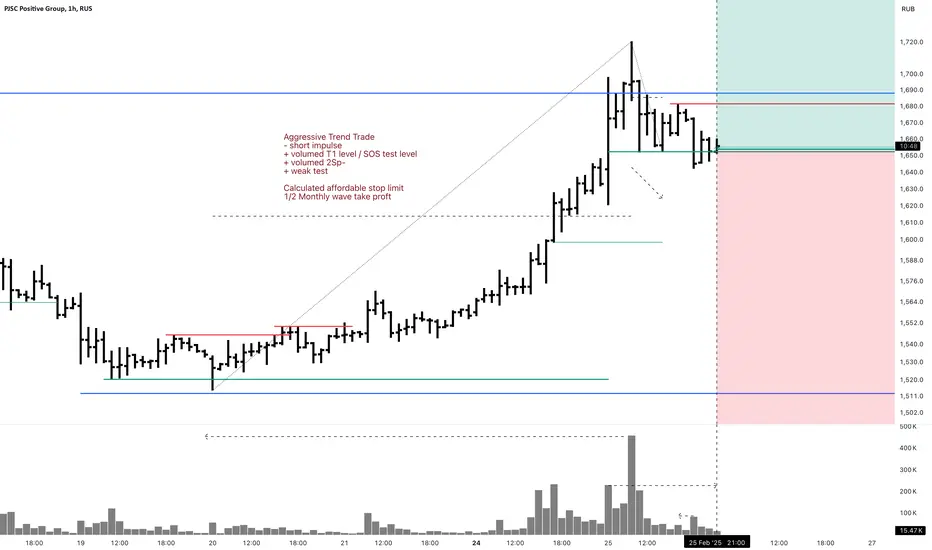
POSI 1H Investment Aggressive Trend TradeAggressive Trend Trade
- short impulse
+ volumed T1 level / SOS test level
+ volumed 2Sp-
+ weak test
Calculated affordable stop limit
1/2 Monthly wave take profit
Daily Trend
"+ long impulse?
- resistance level
- short volume distribution"
Monthly Trend
"+ long impulse
+ 1/2 correction
+ volumed expanding T1
+ support level
+ biggest volume manipulation"
Yearly Trend
+ long impulse
Weird set up. Market is strong and Monthly look a lot like exhaustion!
O 1D Investment Aggressive Trend TradeAggressive Trend Trade
- short impulse
+ biggest volume TE / T1
+ support level
+ biggest volume 2Sp-
+ weak test
+ first bullish bar close entry
Calculated affordable stop limit
1 to 2 R/R take profit
Monthly Trend
"+ long impulse
+ 1/2 correction
+ SoS level
+ support level
+ weak approach"
1Y Trend
"+ long balance
+ volumed manipulation
- neutral zone"

AUD/USD Bearish Breakout PotentialThe chart shows AUD/USD on a 1-hour timeframe, highlighting a consolidation phase with multiple rejections at resistance (labelled 1-4). The price has recently rejected the upper boundary and is breaking down from the range, suggesting bearish momentum. A significant liquidity grab appears to have occurred near the highs, followed by a strong rejection. The projected move suggests a further decline toward the next support level around 0.6300. Traders might look for confirmation via increased selling pressure and volume before entering short positions.

LINK | Wyckoff Method | Phase 3 IMPULSE WAVELINK shows a very clear Wyckoff Method Cycle from the macro timeframe:
This is typically what a Wyckoff Method cycle looks like from a macro perspective:
When we look at Chainlink from the macro and compare it to the previous cycle, it seems likely that LINK goes up in "impulse waves". We now have Wave 3 to look forward to, which may likely play out over a few months - as did the previous cycle.
________________
COINBASE:LINKUSD

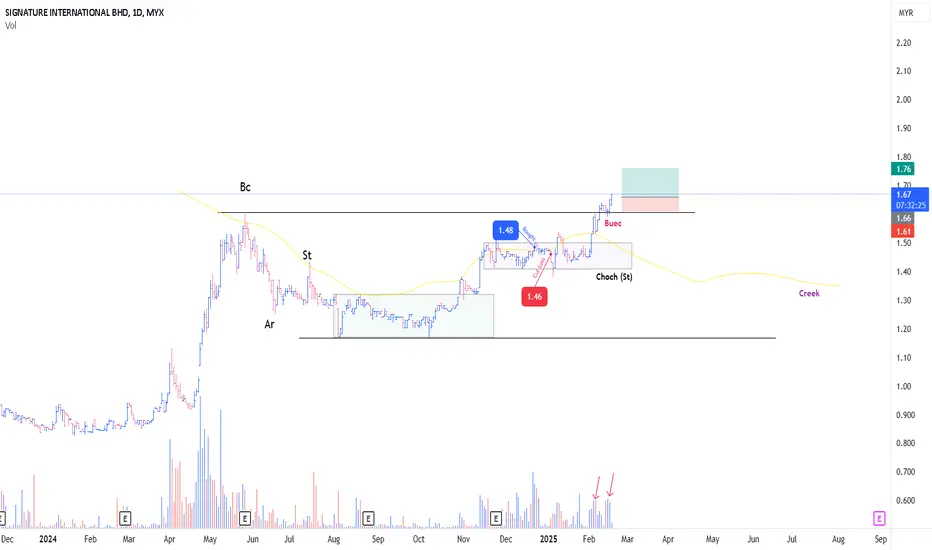
WILL SIGNATURE MARKING UP?A typical Rising Bottom (Re-Accmulation Schematic #2)
Despite huge supply on 6th & 14th February, price still trending Up (Red Arrow)
In terms of price action, nothing to be pointing as it is very obvious to Wyckoffian
So, Based on presumption of BUEC :
Tried to get in around 1.63-1.64 , failed
Bursa Malaysia has been experiencing a very tough environment past few months,
With Foreign Inst became Net Sellers (Consecutively)
Ep with SL as attached, Tight Risk
Pure Wyckoff
XAUUSD H1: What is happening to GOLD?Technical analysis:
The price line is still showing a continued uptrend, important levels are broken and ready for a new ETH GOLD peak! 2 important price zones in the current uptrend are 2934, 2942.
Gold investors all see that gold has a strong upward trend, reaching 2940 USD/oz from October 2023 to present, surpassing the resistance of 2000 USD, showing a strong upward trend. However, if we consider the movements, gold has increased 4 times per week and there is a high possibility that there will be an adjustment in this sensitive area.
If we consider the cycle, gold in the monthly frame is still in the same upward phase as the quarterly frame, but currently we see that gold has increased for 27 months, corresponding to enough time for a monthly increase phase.
Fundamental Analysis
Gold prices were flat in the first session of the week as investors awaited further details on US President Donald Trump's tariff plans, which could escalate global trade tensions.
Senior Trump administration officials will begin peace talks with Russia and Ukraine in Saudi Arabia in the coming days, which is news that many investors are interested in. Gold has been seen as a safe haven asset during the recent period when geopolitical tensions have escalated.

ITMAX GOING FOR MARKUPIt is really difficult to find a setup with Spring
A typical Re-Accmulation of Schematic #1
In the background of evaporating supply
Combination with SpringBoard
Very good setup
EP, SL As attached


FLOT 1D Long Investment Trend TradeTrend Trade
+ long impulse
+ T2 level
+ support level
+ 1/2 correction
+ biggest volume 2Sp+?
Calculated affordable stop limit
1 to 2 R/R take profit
Monthly countertrend
"- short impulse
+ volumed T1
+ 2Sp+
+ bigger volume on test"
Yearly context
"+ long impulse
- correction"

Why I Believe Brent Crude Oil is Headed to $125 by 2026www.tradingview.com 1. Supply Constraints: Geopolitics & Trade Wars
One of the biggest drivers of higher oil prices is geopolitical instability and trade policy shifts. We're already seeing major disruptions that could tighten supply further:
Middle East Tensions – The ongoing conflicts in the Red Sea, Iran, and Israel continue to create uncertainty. Attacks on shipping routes and production facilities raise the cost of transporting oil and increase the risk of supply disruptions.
Russia-Ukraine War – With Russian oil facing sanctions and restrictions, global supply chains have had to adjust, making energy markets more fragile.
OPEC+ Output Cuts – OPEC has repeatedly restricted production to keep prices elevated, and there’s no indication they’ll reverse course anytime soon.
U.S.-China Trade War & Tariffs – With Trump leading in the 2024 election polls, there’s a growing possibility that tariffs on China will return. If this happens, energy trade flows could be further disrupted, and retaliatory tariffs could add to price pressures.
Strategic Petroleum Reserve (SPR) Depletion – The U.S. used a huge portion of its SPR to lower oil prices in 2022-2023, but refilling those reserves will create additional demand, pushing prices even higher.
With these factors at play, supply is becoming more constrained, making it easier for prices to rise with even small increases in demand.
2. Demand Boom: AI, Bitcoin Mining, and Agriculture
While supply is tightening, demand for energy is skyrocketing in unexpected ways.
AI Data Centers & Industrial Demand
AI computing is extremely energy-intensive, and as companies like Microsoft, Google, and Amazon continue to expand cloud computing infrastructure, demand for electricity is surging.
Many data centers still rely on fossil fuels for backup power and cooling systems, meaning oil and gas usage will continue to increase.
Bitcoin (BTC) Mining
Bitcoin mining requires massive amounts of electricity, and as BTC prices rise, mining activity expands in energy-dependent regions.
With the 2024 BTC halving, miners will have to run at full efficiency, which translates to higher global energy consumption.
Agriculture & Food Production
The world’s growing population and extreme weather events (like El Niño) are driving higher food production needs.
Fertilizer production, transportation, and machinery all require oil, meaning agricultural commodities are directly contributing to higher energy demand.
Together, these factors suggest that demand for oil is only going to increase, making it harder for supply to keep up.
3. Oil Price vs. Stock Market: The $100 Warning Zone
Historically, when oil prices get too high, the stock market struggles. Some key examples:
2008 Recession: Oil peaked at $147 per barrel, right before the financial crisis.
2018 Market Drop: When oil hit $80+, stocks sold off sharply.
2022 Inflation Shock: Oil reached $120+, leading to Fed rate hikes and market turmoil.
Why $100+ Oil is a Warning Sign for Stocks
Higher oil prices = higher inflation. This forces central banks like the Federal Reserve to keep interest rates high, making borrowing more expensive.
Energy costs impact corporate profits. Companies across multiple sectors will see shrinking profit margins as transportation and production costs rise.
Consumer spending takes a hit. Gasoline prices cut into disposable income, which weakens overall economic growth.
If Brent crude pushes above $100, expect increased market volatility and a potential selloff in equities.
4. Brent Crude Technicals: Price Targets for 2026
Current Setup
Price Holding Key Support (~$70-$74) – Brent is respecting major trendlines, signaling strong demand in this area.
Breakout Zone Around $80-$82 – If price moves above this level, it could trigger a rally to $100+.
Fibonacci Levels Align with $125 Target:
0.618 Fib retracement at $106 → First major resistance.
0.786 Fib extension at $119 → Likely next target.
1.272 Fib extension near $125 → Final upside target for 2026.
This technical setup aligns with macro fundamentals and historical oil cycles, making a move to $125 increasingly probable.
5. Investment & Trading Strategy
Long-Term Bullish Strategy
Accumulation Zone: $70-$74 (solid support).
Upside Targets: $106, $119, $125.
Stop Loss Consideration: Below $68 (invalidates thesis).
Hedging Against Market Risk
SPX Put Options / VIX Calls – If oil rises toward $100+, consider hedging against an equity downturn.
Energy Stocks (XLE, Exxon, Chevron) – These stocks tend to outperform during oil bull markets.
Gold & Commodities – Hard assets often rally when energy prices increase.
Conclusion: The Path to $125 Brent Oil
Geopolitical instability + supply cuts = higher prices.
AI, Bitcoin, and food production = rising demand.
If oil approaches $100, watch for an equities pullback.
While no forecast is perfect, all signs point to oil prices rising into 2026. If this trend plays out, investors should be prepared for higher inflation, tighter Fed policy, and increased market volatility.
Would love to hear your thoughts—do you think oil will hit $125, or are we headed lower? 🚀📊

SAY IT BACK #Altseason The second phase of the parabolic run that #Alts started in October 2023 begins!
#Altcoins market cap TOTAL3 exited the second accumulation area section of the wyckoff method and started the parabolic run phase.

O 1H Long CounterTrend TradeCounterTrend Trade
- short impulse
+ volumed T1
+ volumed Sp
+ weak test
+ below first bullish bar close entry
Calculated affordable stop limit
1 to 2 R/R take profit expandable to Investment
Daily Trend:
"+ long impulse
+ exhaustion volume
+ T2 level
+ support level"
Monthly Trend:
"+ long impulse
+ 1/2 correction
- SOS broken"
Yearly Trend:
" + long balance
+ volumed manipulation
- neutral zone"

ABC Correction perfection A Beautiful ABC pattern
Lines up perfectly with :
- Previous range Point Of Control
- Previous month Value Area Low
- A Daily Naked
- The 1 to 1
- Global Swing Low Avwap
Elliot wave theory
I expect early next week being hit. Then target the highs for a wyckoff distribution pattern.
People are already positioning EU swing longs, without a spring.
We need to punish dem early bulls 🏌️♀️
CAPITALCOM:DXY OANDA:EURUSD CME:6E1! ICEUS:DX1!

Bitcoin Wyckoff Distribution 2025Some very concerning facts which I would like to share with you.
This looks like a perfect Wyckoff Distribution to me and I will also post another chart image below with other things to notice!
I can not post the wyckoff image here but go to this link and look for the SChematic #1 and compare for yourself! www.wyckoffanalytics.com
here the other chart:

WILL AUMAS MARKING UP?Based on the context of setup
Aumas probably in Phase B
I dont see any active Change of Character (Choch) yet
However im expecting Choch soon
With a Springboard in action (Black circle color) :
-A trigger bar today prompted me to intiate position (as attched)
-Supply evaporating (reducing vol)
Tight SL
Pure Wyckoff

WILL GCB MARKING UP?This is An Atypical Type Of Re-Accumulation Trading Range
- ReAccmulation Schematic #2 (Rising Bottom)
Blue box : A change of character (Choch) of the stock from Non trending -> Trending environment
I bought this stock on 6 & 8 of Jan 2025
however the position ended up cut loss
Poor timing
Since then, the price action from 21-28/1/25 brought my attention **Red Line
(Spring Board Schematic #2)
1st position intiated : 31/1/25 @ 4.26
2nd position added : 5/2/25 @ 4.33
Purewyckoff
Sl as attached

XAUUSD CONTINUATION BULLISHThe whales trap by create sell sentiment first and then push price falling down to shakeout retailers and then them buying the stock at lowest price after price falling down. Why i said the price falling for manipulation because when price falling down with high volume and then not continuing to falling in love and the they buying at the lowest price this reality because im from the futures 3050 years 😊
