AAVE in accumulation scheme, wyckoff analysisDo you like this crypto trading idea?
If you find the article useful and interesting, please leave a comment or engage to see more posts !
------------------------------------------
🔰 Attention about this analysis
This is my personal idea and analysis only.
Let's see it as an example or a reference.
You also need your own analysis as well and manage risks.
Wyckoffaccumulation

AVAX accumulation, Wyckoff analysis in crypto tradingDo you trading crypto?
AVAX in accumulation scheme
I'd like to see price retrace back to "Backup".
Wait to see a confirmation before enter positions to minimize risk.
Do you like this crypto trading idea?
If you find the article useful and interesting,
Please leave a comment or engage to see more posts !
------------------------------------------
Attention about this Wyckoff analysis
This is my personal idea and analysis , please just see it as an example for reference .
You also need your own judgment, analysis as well as a trading plan to manage risks when trading Forex.
This is a free blog sharing trading ideas.
Z Concepts is a forex and cryptocurrency trading strategy that combines Wyckoff, supply and demand , price action, and some other modern technical analysis .
Happy Trading !

AMC -- The Road Up Goes Down, Part 1This chart is going to go with the next one I post. To understand my thinking here, you'll need to see a more macro view of AMC's chart.
This is an accumulation within the phase C "spring" of the spring phase of the June to Present re-accumulation. It's The Inception of Springs. For the last three days after what many (including myself) believed to be a terminal shakeout, the deep plunge did not create the kind of upward thrust we needed to break out of this trading range. From where we sit, I see three possible paths:
1. (in pink) we finally respect support and begin to climb out of this trading range toward the accumulation
2. (in purple) we breakdown back into the trading range, but follow Wyckoff accumulation schematic 2 and LPS above the low set by the sell test in phase B
3. (in yellow) we form a deeper spring beneath this micro trading range
If I had to guess, I would say that all signs point to yellow, for me. The next chart will help clarify my rationale -- and I don't believe this move will be long-lasting -- but, now that we're here, we have an opportunity to fill the gap at $16.95, and I think it's in our best interest to take that opportunity. Doing this will not only fill the gap, it will bring us into the golden pocket of the stock's all time trading range, from January's low to June's ATH. The two dotted green lines represent the golden pocket of that fib (which will be more clearly seen in the next chart.
I remain incredibly bullish in the long-term on AMC, but admit that there are a couple of important boxes to tick, since we've broken so far below the re-accumulation's trading range.
This is one of those instances in which I'm simply trying to illustrate what I see -- right or wrong, I'm an AMC long who will be hodl-ing with you all through whatever comes our way.
Wyckoff Accumulation Bitcoin 4H and 1H update.Since the Spring of the Wyckoff Accumulation, we were able to predict the flow of Bitcoins price by following the Wyckoff market cycle.
We are now in phase D, were we will start the clear Sign of Strength move by creating our last point of support.
This will be confirmed if price comes back down to the $47,700 - $47,300 range, creating a higher low on the 1 and 4 hour charts.
If price were to fall to these levels, we are predicting that price will not stay there more than 4-8 hours before rallying back up to our current resistance levels of $49,000 - $49,700.

The Bitcoin Accumulation Wyckoff PatternBitcoin enters a period of consolidation with multiple swings in a trading range, and forming a Wyckoff Accumulation Pattern which should take us through at least early January 2022.

EGLD: Wyckoff accumulation schematic #2The previous linked Wyckoff idea was invalidated today after having a lower low.
The traditional one can still take place.

Wyckoff Accumulation Bitcoin 4HAccording to Wyckoff, the market can be understood and anticipated through detailed analysis of supply and demand, which can be ascertained from studying price action, volume and time.
PS—preliminary support, where substantial buying begins to provide pronounced support after a prolonged down-move. Volume increases and price spread widens, signaling that the down-move may be approaching its end.
SC—selling climax, the point at which widening spread and selling pressure usually climaxes and heavy or panicky selling by the public is being absorbed by larger professional interests at or near a bottom. Often price will close well off the low in a SC, reflecting the buying by these large interests.
AR—automatic rally, which occurs because intense selling pressure has greatly diminished. A wave of buying easily pushes prices up; this is further fueled by short covering. The high of this rally will help define the upper boundary of an accumulation TR.
ST—secondary test, in which price revisits the area of the SC to test the supply/demand balance at these levels. If a bottom is to be confirmed, volume and price spread should be significantly diminished as the market approaches support in the area of the SC. It is common to have multiple STs after a SC.
Test—Large operators always test the market for supply throughout a TR (e.g., STs and springs) and at key points during a price advance. If considerable supply emerges on a test, the market is often not ready to be marked up. A spring is often followed by one or more tests; a successful test (indicating that further price increases will follow) typically makes a higher low on lesser volume.
SOS—sign of strength, a price advance on increasing spread and relatively higher volume. Often a SOS takes place after a spring, validating the analyst’s interpretation of that prior action.
LPS—last point of support, the low point of a reaction or pullback after a SOS. Backing up to an LPS means a pullback to support that was formerly resistance, on diminished spread and volume. On some charts, there may be more than one LPS, despite the ostensibly singular precision of this term.
BU—“back-up”. This term is short-hand for a colorful metaphor coined by Robert Evans, one of the leading teachers of the Wyckoff method from the 1930s to the 1960s. Evans analogized the SOS to a “jump across the creek” of price resistance, and the “back up to the creek” represented both short-term profit-taking and a test for additional supply around the area of resistance. A back-up is a common structural element preceding a more substantial price mark-up, and can take on a variety of forms, including a simple pullback or a new TR at a higher level.

Bullish baiseTrend trade idea. prie strongly moved looking for some accumulation before moving upward

Gold Wyckoff AccumulationHello Traders
We are nearing the end of a 3 weeks trading range on gold.
Liquidity for demand was grabbed at the lower levels all this time and we might be on to another Lower Low and/or Spring action for an explosive rally to the upside.
Possible TP would be 1825, and any long term TP could be the 1900s, but as always with gold, tread very carefully and dont over leverage before considering any long term investments.
As always, stay safe with your trades and always wait for for range tests confirmations before making your entries.
Goodluck !

EGLD: Accumulative Gradient of Rising BottomsA more positive idea, seeing the bullish divergence playing out. If EGLD is able to keep the recent low volume of sellers and make a relevant higher low...
Quoting some parts of the original article where they suggest this Wyckoff schematic of Gradient of Rising Bottoms at the very end of it:
"Richard D. Wyckoff and his Associates time and again pointed out the power of ascending bottoms in a base of accumulation or re-accumulation"
"The composite man is willing to play the short side of the market as well during the trading range of accumulation so long as he can abstract a public following of sellers. But as the trading range proceeds, the new schematic reveals that fewer and fewer sellers remain to propel stocks downward in price. As a consequence, the downwaves become shorter and shorter in length (the bottoms rise) and the Composite Man as a result accumulates an increasing line of stock. Ultimately there is little left of sellers to coax to the downside and so the composite man reverses his attention and spurs prices upward and out of the trading range."
"Wyckoff Schematics: Visual templates for market timing decisions" By Hank Pruden and Max von Lichtenstein.

Going up to at least 55k. Convince me otherwise!BINANCE:BTCUSDT
My analysis is based on the Wyckoff Method. Once I identified the current consolidation area as ACCUMULATION , I used a horizontal column count on Point and Figure (PnF) chart (box size = ATR) to calculate a projection of the up move that should result from Cause accumulated in this consolidation area.
If you are familiar with Wyckoff schematics, the chart should be self-explanatory, so I'll just share my reasons for why I identified the current Trading Range (TR) as ACCUMULATION.
The Stopping Action in Phase A is very obvious here - the Extremely High volume is a sign of the Composite Operator (OC) stepping up and buying BTC. This is high quality demand meeting panicky selling, which is reflected in the candles with the tiny spread and huge volume near Selling Climax (SC).
Phase B begins after some more supply is absorbed at "ST". Now look at the volume throughout Phase B:
1) Volume shrinks on rallies. This is b/c most of the Supply has already been gobbled up by the OC in Phase A. Since OC is not selling, even the slightest increase in Demand is enough to drive the price up.
2) Volume expands on retracements. This is b/c OC is buying, trying to absorb every last drop of Supply.
3) Sell Volume is obviously decreasing from ST1 to ST2, also indicating that OC is absorbing Supply. ST3 has a bit more volume than ST2 - looks like UT2 has shaken some more Supply loose, which makes a Spring very likely.
Phase C now begins with a Spring Type 2. Since the last ST3 showed that the market still has some Supply, OC removes bids at the Support line to let the price drift slightly lower, to see if that scares up even more Supply. In this case it does not! The Volume on Spring is lower than on ST3, which means that Supply is now thoroughly exhausted. OC pushes the price back into the TR with the next green candle with higher volume.
After this a Test follows, showing even less Volume, which means that BTC is now ready for markup. Phase C is done.
Further evidence of a markup is:
1) OBV shows net accumulation
2) ADL shows net accumulation
3) RSI bounced off of MA(39) for the 3rd time, while making Higher Highs
4) Wyckoff analysis on the Weekly time frame also shows ACCUMULATION in Phase B. This means that in the future BTC can still go down to the neighborhood of 30k before going back up, but that's really long term.
So this is where I openned my Long position. From here I expect a JAC (Jump Across the Creek), which will be characterized by a candle with large spread and volume, then a bit of retracement to BU, and finally markup in Phase E.
Wyckoff Method postulates that Cause is built up by volatility in Phases B, C and D. The more volatility is recorded in that region, the higher the price will go. My PnF Chart calculation indicates that BTC has generated enough "fuel" to go up by $9000. Measuring from the bottom of the TR, we get at least 55k. The purple dashed lines in my chart indicate the target region.
What do you think?

EURJPY long positions update, Wyckoff method in Forex tradingAre you trading EURJPY pair ?
This post was a Wyckoff analysis
Price was created Equal Lows so it's better when we move SL to BE and take partials profit.
------------------------------------------
Attention:
React to price action based on specific trading plans, rather than predictions.
This is my personal idea and analysis, please just see it as an example for reference.
You also need your own judgment, analysis as well as a trading plan to manage risks when trading Forex.
This is a free blog sharing trading ideas.
Z Concepts is a forex and cryptocurrency trading strategy that combines Wyckoff, supply and demand , price action, and some other modern technical analysis .
If you find the article useful and interesting, please leave a comment !


ETH/USD Wyckoff Accumulation PatternI spy with my little eye, a wyckoff accumulation pattern drawing out on the 4-Hr ETH/USD price charts. Will be interesting to see how it plays out.
Just publishing this for personal tracking and learning.

BTC crash = Wyckoff AccumulationAccording to the Wyckoff Accumulation Schematic, a drop in price is manipulated by an institution that is building a position in an asset before the price increases. I think we just experiences a Wyckoff Distribution and now we are entering a Wyckoff Accumulation phase. A Wyckoff accumulation phase has different stages: 1. first we experience a dramatic drop in price (selling Climax, 2. followed by a jump or recovery in price (Automatic Rally). This is followed by again, 3. a decrease in price (Second Test). Next, 4. another rally takes place and price increases, then another 5. Second Test that can drop the price lower than Selling Climax, and a spring. 6. The spring is the lowest price level during this schematic, however, not every Wyckoff Accumulation has one. After this last dump, comes a recovery that is characterized by 7. A last test around the resistance levels and a 8. Sign of Strength, above the resistance level that signals the bear is over.
The support level was set by the selling climax at 41k, so we can expect the second test and spring to be below this level. The resistance level was set by the Automatic Rally at 52k, so we can expect a pump around this level and the Sign of Strength above this price that would indicate the bear is over.
The past Wyckoff Distribution that took place in May took 96 days to play out, this time it took 51 days, the time frame was almost cut in half. The past Wyckoff Accumulation took 72 days to play out before the price started to recover. If we follow the logic that this time the time frame will be cut in half, this will mean that it can take up to 36 days for the accumulation to take place (around January 5th).
In addition, in the past Wyckoff Distribution and Accumulation Schematic, the distribution support level (at 48k) wasthe next sign of strength during the accumulation phase that followed. If this is accurate, this means that the next sign of strength for this accumulation period should be at 58k (this was the support level for the recent distribution).
So, we can expect the proce to keep oscilating between 55k and 41k, however it can still go under since we are missing the Second Test/Spring event. With that being said I am still very bullish on BTC. So keep HODLing and don't panic sell! Remember, we are still in a bull run market!!

AMC -- Threading The GatesHave you ever watched slalom skiers? The way they weave down the mountain and pass between gates? AMC has been doing something similar for 8 straight trading days.
What you have here is the same chart we've been looking at from the Accumulation Within The Spring that I first shared on Dec. 2. Once it seemed we'd reached bottom, I went to my The Cycle, Redux chart and wondered what it would look like if I tried to sync the low on Dec. 3 with the low on Jan 5. So, I took bars patters from a handful of timeframes and pulled them into place on this chart. Then, I just watched.
What emerged a few days ago was that the daily bars pattern, squished to mimic the quicker timing of the print currently, was most accurate. And, my "most accurate" I mean, so far -- eight days straight -- perfect. We've even hit 5 bullseyes in those 8 days, which seems statistically impossible.
You are actually seeing two different bars patterns overlaid on one another to mimic the shape of a daily candle and wick. For the white candle, I used an HL pattern and for the yellow a OC pattern. Because the bulk of the past price action took place between candle open and close, I consider this "body of the candle" to be the bullseye, but in reality passing through the gate seems like an improbability after just a few trading days. I'll also note that this holds a fairly Wyckoffian pattern as this micro accumulation consolidates after SOS, before exiting into Phase E and pushing the price action back into the master trading range we've been in since June.
This is something I'll continue keeping an eye on.
All charts referenced are below.
As always, feel free to click "Make Chart Mine" and enjoy tinkering with it for yourself.

UPDATE: AMC Accumulation Within The SpringWhile things continue to track Wyckoff Reaccumulation behavior on the macro timeframe and Cycle 3's echo of Cycle 1 remains consistent (both charts below), I thought I'd update the micro view of AMC's accumulation within the spring.
I've preferred this chart on the 10m view because the shorter timeframe signals MFI reactions a little more quickly, the 15m does offer a higher 200EMA, which we've broken as resistance and now seem poised to retest as support. I'd encourage you to click "Make Chart Mine" and look at this on the 10m timescale as well.
With the sign of strength in the move this morning above the resistance zone, I think the 3a path is most likely. As you can see there's a bullish divergence in the MFI and volume with the rising price action. Combined with the RSI being oversold, this signaled the turnaround which took place at ~$34. Now I expect to see the price retrace to a spot between the 200EMA and the top of the resistance zone. Establishing the $31-and change area as support would (for me) confirm SOS and this micro accumulation entering Phase D.
If, however, we break below the pink resistance zone and reenter the trading range, both the yellow and blue paths remain in play.
I have pretty strong conviction that 3a is the more likely path, which would mean we are exiting Phase C on the reccumulation we've been in since June. Path 3b only delays that inevitable move up through the trading range by a few days.

Bitcoin correction next price target 45000$Although the crash on friday was pretty obvious to me. We are still not done. We will retest the 43k - 45k area before moving back up. Here is my analysis I hope it helps. This should be a short correction between 2 to 5 weeks. But we need to retest before moving back up .

Wyckoff accumulation idea EQZ/USDTWe could assume EQZ is currently in Phase B of a potential wyckoff accumulation pattern.
To be continued.

ICP Wyckoff Accumulation PlayICP/USDT
1D Chart
ICP has been moving sideways since the July bottom trading in a range.
Using Wyckoff I’ve analysed the chart on the daily candle chart and it looks to be an accumulation play over many months.
Ive identified characteristics similar to stages of Wyckoff accumulation and marked it up. Using fractals from the previous price action, I’ve pieced together a generic approach of what price would typically do according to a Wyckoff accumulation model. The model is flexible as not all price action will repeat itself in the form of Wyckoff but variations creating the same setups occur throughout sideways price action. You could identify another 2 Wyckoff distributions in this chart alone so a degree of flexibility as price action develops is required.
This new low we have put in from the crash has a big wick showing a lot of buyer presence and very high volume showing the entry of the composite man at the low of the range (good sign). This low to me is the ST as SOW but could also be the Spring, only time will tell and provide us with confirmations.

Bitcoin accumulation again? Uniqe BTC trading ideaWill Bitcoin in Wyckoff accumulation scheme ?
This is a forecast, not a prediction or financial advice!
------------------------------------------
Attention:
React to price action based on specific trading plans, rather than predictions.
This is my personal idea and analysis, please just see it as an example for reference.
You also need your own judgment, analysis as well as a trading plan to manage risks when trading Forex.
This is a free blog sharing trading ideas.
Z Concepts is a forex and cryptocurrency trading strategy that combines Wyckoff, supply and demand, price action, and some other modern technical analysis.
If you find the article useful and interesting, please leave a comment !

GBPJPY Buy Limit @ 150.316Smart Money has indicated a Level of SOS.. Sign of Strength to the upside until we fill imbalance before another move down.
I've placed two buy limit orders on GBPJPY @ 150.316

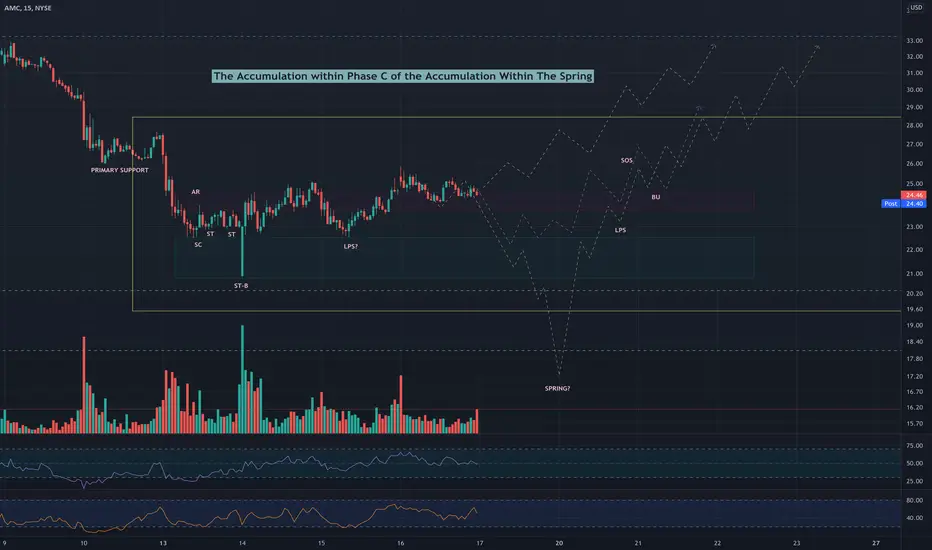
AMC -- Accumulation In The SpringJust something I noticed looking at the chart was how the cascade down on Tuesday and the price action that followed set up very much like a Wyckoff accumulation. Here are two potential paths for this small timeframe local accumulation:
Yellow = what it could look like if the accumulation dips into a spring. I can see this being Composite Man's ultra cruel way to really making folks freak out before The Holidays. How low can he push it without screwing himself? Because that's how low I expect him to go. He's hunting for pennies, now. My guess would be the local accumulation spring dips into the $25 range. Enough to spook the last hodl-ers he can into selling.
Blue = what we all hope after hearing Yellow is possible. Right? We hope that it comes back up to the top of local resistance (which happens to also be the bottom of the support zone from the Reaccumlation After Shakeout we've been in since June, that green dotted line) then consolidates to an LPS and begins to turn the corner.
Timeline, here, is irrelevant. As I said, this is nested within a small phase in a larger accumulation. I don't expect it to take that long. I eyeballed it (on the main chart, link below) as we're moving up by Dec. 15. Some people I trust believe we may have already seen the Phase B sell test, so don't put faith in timing on this. I'm sharing simply to set an expectation on the kind of movement I'm expecting to see.
