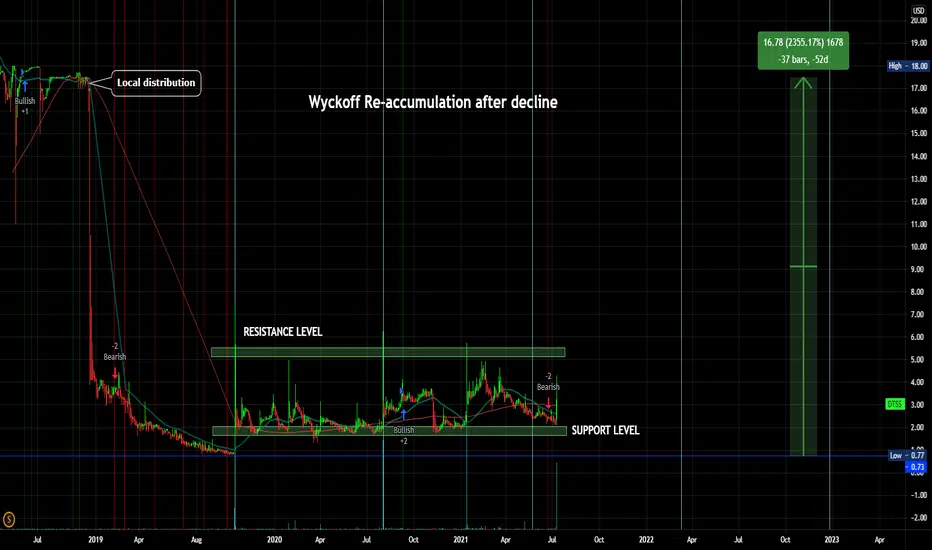
$DTSS Wyckoff Re-accumulation after decline$DTSS Wyckoff Re-accumulation after decline, between Spport and Resistance levels
Datasea Inc., through its subsidiaries, provides smart security solutions in the People's Republic of China. It develops big data security and smart 3D security platforms, safe campus security systems, scenic area security systems, and public community security systems, as well as epidemic system. The company offers its smart security solutions primarily to schools, tourist or scenic attractions, and public communities through its own sales teams, partner agents, and newly founded operating entities. It also develops and offers education-related technologies to build campus networks, education management systems, education cloud platforms, science education platforms, and other education systems used in schools. The company was formerly known as Rose Rock, Inc. and changed its name to Datasea Inc. in October 2015. Datasea Inc. was incorporated in 2014 and is headquartered in Beijing, the People's Republic of China.
Wyckoffaccumulation
Still waiting for a drop? Will we get one? Just an updated view of our sideways action. Looks like I will need to redraw the accumulation phase as we are stuck between 32k - 36k. I still expect a dip soon which will start our rebound possibly. This chart will not change as I am curious to see how this plays out compared to the accumulation model.

GME | Wyckoff Accumulation PS— Preliminary Support, where substantial buying begins to provide pronounced support after a continued down-move.
- Volume increases and price spread widens, signaling that the down-move may be approaching its end.
SC—Selling Climax, the point at which widening spread and selling pressure usually in high point and heavy or panicky selling by the public is being absorbed by larger professional interests at or near a bottom.
- Often price will close well off the low in an SC , reflecting the buying by these large interests.
AR—Automatic Rally, which occurs because intense selling pressure has greatly decline.
- A wave of buying easily pushes prices up.
- The high of this rally will help define the upper boundary of an accumulation.
ST—Secondary Test, in which price revisits the area of the SC to test the supply/demand.
- If a bottom is to be confirmed, volume and price spread should be decline as the market approaches support in the area of the SC .
- It is common to have multiple STs after an SC .
LPS—Last Point Of Support, the low point of a reaction or pullback after an SOS.
BU/LPS- Backing up to an LPS means a pullback to support that was formerly resistant, on diminished spread and volume .
SOS—Sign Of Strength, a price advance on increasing spread and relatively higher volume .
- GME is in a Wyckoff Accumulation Pattern
- Latest drop indicates a Bear Trap setting up GME for new ATHs

Bitcoin Continues Down Falling WedgeIf you've read my previous posts, you'd know that I've been primarily tracking a Falling Wedge that Bitcoin has been in. Despite all of the noise, that's all it's been doing since May. It's had 11 touches to its top resistance line and 4 to the bottom support line. I have also drawn a resistance line above the wedge, and what becomes evident is the 4 times in this Accumulation phase that Market Movers have tried to fake us out to the top.
One notable difference in my chart here is the "ST in Phase B" designation where I was previously calling the "Spring." Honestly, we won't know which it is until BTC makes its next move. If that WAS the Spring, then we should see a move to the upside in the coming week or so. If it wasn't the Spring, then we should expect a Spring and have bags ready to buy up 28K Bitcoin.
So what does this mean? It means that fundamentally, nothing has changed for weeks. Whales are accumulating, paper hands are getting wrecked, and short attention-span traders have changed the channel.
All by design.
We've stuck with it this long. Would make no sense to miss the pay-off, and it's going to be soon.

BTC and Wyckoff? There is a possilbity that big players are already buying the dip without the public noticing it. What do you guys think? Comment below your views.

EURGBP UNPOPULAR OPINIONDISTRIBUTION INSIDE AN ACCUMULATION
I cannot tell you guys in full totality that this schematic is right for sure, it is just an anticipation of the many possibilities offered by the market.
Overall bias is shorts till they sweep the liquidity below.
Interms of intraday perspective I think price will continue down and reverse at 0.8500 zone in preparation of a lpsy.
Enter shorts if and only if price shows signs of a distribution to go lower at the first lpsy.

Classic Wyckoff Accumulation playing out.Noticed a perfect example of a classic Wyckoff accumulation playing out on the 6H, and wanted to do an explanation of how instructional investors and whales define support and resistance zones and use them to shake out retail investors during accumulation.
The Wyckoff method plays out in every market that has institutional investors. Once defined, understanding it is a powerful card to have in your hand when you're trading. You'll notice from the volume profile on the right that the price action stays within defined support/resistance levels.
That's because the big buyers set the levels. This $31,500-$40,500 range is also the defining volume range in the distribution leading up to the ATH, making it a substantial level of support over the long term.
Reading volume is important when doing Wyckoff analysis as it will definitively tell you whether a move is false or not.
Note that the uptrend in Phase D & E are for illustration. We may still have some bear market to come, but we are at the strongest region of support since the start of the bull run, so we may be turning around.
Understanding the psychology of greed and fear is important as well. Greed is the driving force of large investors to shake out smaller retail investors during uncertain market times. It works because retail investors tend to trade on emotion, becoming fearful when a large price drop takes place. Institutional investors can ignore emotion and and simply stick to their targets as they have a much larger financial cushion and the ability to act as market makers on a larger scale.
Once you understand the psychology of fear and greed in markets and how volume can be used to confirm price action, you can stop being fearful, stick to a strategy, and begin trading with the market movers instead of against them—as more often than not this is a losing battle.

Wyckoff's Accumulation phaseThis is Wyckoff's Accumulation phase that is tricky to understand, Wyckoff's methods are real smart money concept. Actually Wyckoff's understand how SM place their orders. So after a long time by studying markets sir Wyckoff distributed his knowledge between public. And reality is Support and Resistance work but not so nicely SM know how retail traders trade the market. So they break the retail levels induces public and collect their orders and reduce public From trades. Concepts are little bit complicated to apply in real time chart, but it actually works.
If anyone wants to learn those concepts then they can search on Google 'Wyckoff's method'.

$NMTR SINE WAVES$NMTR SINE WAVES
RS Ratio: 1/10 on 2/07/2018
Wyckoff Re-accumulation after decline, Strong Volume building
High Spike in Volume, MMs loaded on 8/17/2020
9 Meters Biopharma, Inc., a clinical-stage biopharmaceutical company, focuses on patients with rare and unmet needs in gastroenterology. Its pipeline includes drug candidates for short bowel syndrome (SBS) and celiac disease, as well as for undisclosed rare diseases and/or unmet needs. The company is developing Larazotide, an 8-amino acid peptide, which is in Phase 3 clinical trial for the treatment of celiac disease; and NM-002, a long-acting glucagon-like peptide-1 (GLP-1) receptor agonist that is in Phase 2 clinical trial to treat SBS. It also develops NM-102, a small molecule peptide; NM-003, a proprietary long-acting glucagon-like peptide-2; and NM-004, a double-cleaved mesalamine with an immunomodulator for rare and/or orphan indications. 9 Meters Biopharma, Inc. has a collaboration with the Duke Clinical Research Institute to support the clinical development of NM-002. The company is headquartered in Raleigh, North Carolina.

My Revised Take On The Wyckoff Accumulation Schematic On BitcoinMy Revised Take On The Wyckoff Accumulation Schematic On Bitcoin
In this chart i show you the support and resistance levels that i am looking for in te coming weeks.
Looking at the last wyckoff pattern i have drawn i changed phase D because it looks like we got the retest to 32k as i initially expected. the last 2 whicks therefore can be seen as one on the wyckoff pattern, as that is possible in these type of patterns.
I also lowered the levels in phase D because they didnt align with the whicks in phase A and B.
I will be bullish if we break 36k short term and 42k long term, bearish if we retest 30k again.
For now i hope we are still following this pattern an see some green in the coming weeks.

Bitcoin – Accumulation: A Wyckoff Study With BTC breaking down below $32.7k, it appear to me that we have just completed a wave 4 corrective triangle, within the final wave 5 of a larger 3-3-5 correction. All that is left is the final capitulation to complete the last element of this corrective structure.
Read in the context of the Wyckoff Method, this gives the technical structure for what I show as a Redistribution, and the final capitulation into a selling climax that will invigorate the Bulls into value buying, and trigger the Spring that has been so long in the waiting.
Looking at the Fibonacci projection for the larger corrective structure, and the Fibonacci Channel that has defined the trading range since late May, it appears that the bottom of the correction and the Spring is around $26k.
At least that is how I see it.

GUBPUSD DESCENDING WEDGE ACCUMULATIONSame structure as EU. We are experiencing a divergence between EU and GU because a big move is about to happen

Bitcoin Wyckoff Accumulation Cheat Sheet (Update 1)Update on the previous cheat sheet with new trendlines and support/resistance levels.
Have also included the cumulative volume of each swing high and low since the Spring/Shakeout, to better show accumulation with lower volume on each pullback compared to up swings. (Note that volume is only based on BINANCE:BTCUSDT )
It appears we have just formed the second test of Phase C, with a confirmation of moving on to Phase D once we clear the 36600 swing high.
Comments and donations appreciated. Thank you!
Inspired by:
@bbrijesh
@JordanLindsey
@JKTrder

XAU USD Potential LONG zone (read comments for in depth details)Hey Guys, looking at gold's most recent price action on the daily TF, we can see we have accumulated almost at the same level of a previous re-accumulation. in fact, in the current accumulation's spring, we cleared the lows of the previous re-accumulation zone. which is very interesting and nice to see. so now that price has accumulated, and made it clear that it took the lows and broke structure upward, we can now look for zones of interest to go long. Now for my zone of interest id like to play of the daily IC, and would like to see a smaller TF accumulation as we enter the zone of interest, if i dont get that accumulation in the zone of interest then i wont be going long. Here's some screen shots in the comments to show a bit more detail.

Is wyckoff accumulation for BTC confirmed?I'm put major support at 23634.5 because of the reference from Elon tweet (Coordinates of Mexico)


EURUSD possible wycoff accumulationI am expecting continous bullish action next week and maybe market reversal at 1.19610.
The price is likely to spring on JULY 14 as we have high impact news.
The demand zone around 1.17720 is a key area to watch as the spring will deflect from that zone from my analysis.

GBPUSD | Market outlook Britain’s pound steadied against the dollar on Friday, recovering from two-month lows after a print of U.S. jobs data pushed the dollar lower. Earlier on Friday, sterling hit fresh two-month lows against the dollar, pressured by dovish comments from the Bank of England’s governor.Bailey’s comments knocked the pound to its lowest since April 16. But after the dollar was weighed down by some weaker details in an otherwise strong overall U.S. jobs report, sterling recovered some ground to trade 0.15% higher.

Bitcoin (Sideway action possibilities)Well... Recently its boring to see BTC Going sideways and now we are in an important zone... Guess what!.. We will get bug volumes soon and i have explained things in the chart. (P.S I'm not a fan of wyckoff)


Bitcoin Wyckoff Accumulation ConfirmationIn continuation of my previous idea. The PS in the formation was too low, possibly because of series of exchange crashes, which led to long trail of triggered stoplosses. That led that the whole structure was little misunderstood. Now we had a perfect spring and test exactly where I expected it, but quite later and now we are moving to phase D. There are no strong signs of strength on clusters, but we are smoothly moving up last days, crossing last day's resistance. At any moment bitcoin was looking weak: no signs of strong buyer interests, but now almost the whole formation is before our eyes. Lack of additional confirmations does not give me confidence, that we would go all the way up from this formation, since Bitcoin knows few cases, when price went down after exit from accumulation.

[UPDATE BTC] Proof that the BEARS are losing power! (crazy)Bull&Bear trend is an amazing indicator.
You can see we are losing bear power.
What I'm seeing is that we are going sideways until the end of July with some ups and down between 30k$ and 45k$ while losing bear power on the daily timeframe.
Check the video below.
