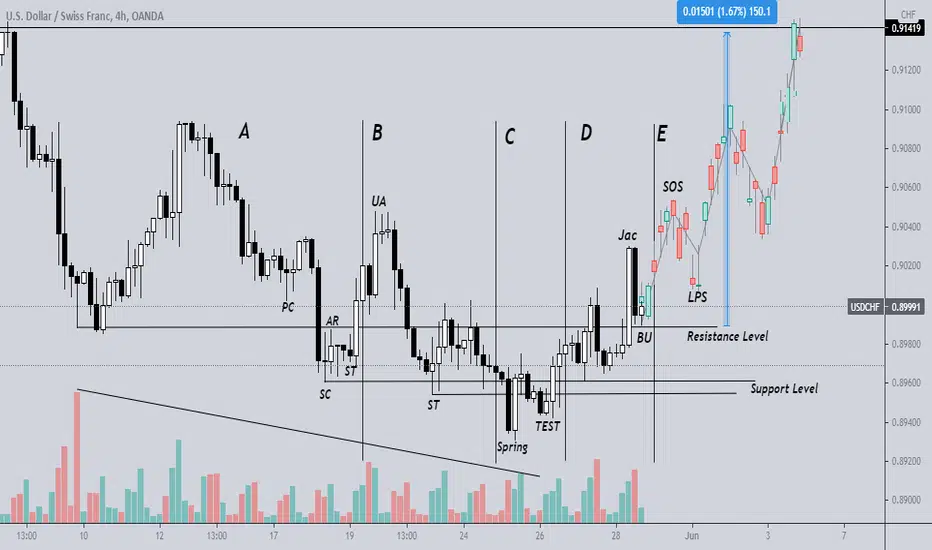
What is the Wyckoff MethodPhase A. Stopping the previous bearish trend.
• PS. Preliminary Support. It's the first attempt to stop the downward movement that will always fail.
• SC. Selling Climax. Climate action that stops the downward movement.
• AR. Automatic Rally. Bullish reaction. An upward movement that sets the maximum range.
• ST. Secondary Test. Test of the level of supply in relation to climate action. Establishes the end of Phase A and the beginning of Phase B.
Phase B. Construction of the cause.
• UA. Upthrust Action. Temporary breakout of the resistance and re-entry into the range. This is a test at the maximum generated by the AR.
• ST as SOW. Secondary Test as Sign Of Weakness Sample of weakness in test function. Temporary break of the support and re-entry to the
range. This is a test at the minimum generated by the SC.
Phase C. Test
• SP Spring. It is a test in the form of breakout of the minimums of Phases A and B. There are three different types of Springs.
• Test Spring. Downward movement towards lows of the range in order to check the commitment of the sellers.
• LPS. Last Point of Support. Test in the form of a bearish movement that fails to reach the minimum range.
• TSO. Terminal Shakeout or Shakeout. Abrupt movement of minimum breakout that produce a deep penetration of the level of support and a
fast
Phase D. Bullish trend within the range.
• SOS. Sign of Strength. Bullish movement generated after the Phase C Test event that manages to reach the top of the range. Also called JAC.
Jump Across the Creek. Creek jump.
• LPS. Last Point of Support. These are the rising troughs we find in the upward movement towards resistance.
• BU. Back Up. This is the last big reaction before the bull market starts. Also called BUEC. Back Up to the Edge of the Creek. Back to the
creek
Phase E. Bullish trend out of range.
•Succession of SOS and LPS generating a dynamic of rising highs and lows.
Wyckoffaccumulation

Bitcoin - Wyckoff Accumulation Bitcoin is currently mimicking a Wyckoff Accumulation pattern on a 4h chart. Over the last year, a near perfect Wyckoff Distribution pattern was experienced on a 4h BTC chart as well. Usually these patterns are found on higher timeframe charts, but in extremely volatile markets they can appear on lower timeframes as well. It's possible that Bitcoin could experience another short-term pullback into 36k demand before breaking above 41k again. Expect some more sideways price action between 41k and 43k. Overall I'm very bullish as it would appear our institutional overlords are ramping up for another great rally campaign just in time for an unprecedented period of extreme inflation.

ZOOM VIDEO COMMUNICATIONS INCIs ZOOM done with the correction? Propably. I am looking forward to see the stock move like its on steroids
If the zones around 303 and 346 hold, then we are in for a good ride

BTCUSDT Wyckoff Accumulation - Sign of Strength (4h)I Think what we see right now is already the sign of strength within a Wyckoff Accumulation. I Think it makes sense that BTC runs through patterns faster than Stocks, as the whole crypto market is much faster and more volatile!
Also the number of Bitcoin Shorts is through the Roof, wich means the could be a HUGE short-squeeze pumping the price like crazy.
The Volume steadily declined to the Spring and slowly inclined from there. There is no selling Volume from the recent Top. The recent little Fakeout to the top also had significant Volume.
RSI is on generell uptrend since the beginning of the Wykoff Acc. phase.

BTCUSD📚 EDUCATIONAL💡
Potential Wyckoff Accumulation pattern on the BTC Chart!!!
I've tried breaking this down as easy to understand as possible.
DON'T READ IT, STUDY IT!
Richard Wyckoff was a guy from the 1930's who was so done with the big guys manipulating the market that he went ahead and developed two methods that helps you oversee the future and save you from pooping your pants on every move an asset makes.
The scheme is broken down into different sections in which I'll explain each step.
Phase A:
Preliminary Support (PS) was broken through by the huge selling power of the bears. Bears tire out from the intense selling and eventually reach Selling Climax ( SC ). Bulls intensely buying the bottom causing an Automatic Rally (AR) and bouncing up from the bottom. Bulls take profits and the market come back down for a Secondary Test (ST).
Phase B:
Uncertainty hits in as bears think the bottom is hit and bulls are worried that it might fall further. The price consolidates and ranges between the AR and ST zones testing them multiple times.
Phase C:
This is a critical level in the accumulation phase as everything depends on if the support level manages to hold or not. In the case of this example, the Spring is a bear trap to mislead buyers before the price launches up and everybody that accumulated in Phase A and B gets rewarded.
Phase D:
We see higher trading volume and confidence in upward momentum. Price starts making higher lows and showing the Last Point Support ( LPS ). Price is making higher highs which shows Signs of Strength (SOS), previous resistance zones are broken through and become supports. Retest on the new support level then gives another buying opportunity for bulls to join the ride.
Phase E:
Increased demand and confidence is shown in the market as it makes higher highs and turns into an upward trend.
Enjoy!

BTC - WYCKOFF ACCUMULATIONAt first, we have to understand that Bitfinex doesn't concentrate most of the market however nowadays arbitrage bots reflect orders almost instantaneously, causing the market to converge on data information.
On the 4-hour chart we can observe a distribution starting around 1:00 on the 26th of April and extending to the 11th of May.
The famous "Sell In May an Go Away" took the market with a removal of capital which can be seen by the decrease of the Long position at 9600 BTC and also the short position at approximately 2900 btc, as the market lateralizes.
In short, the market lost interest and with it a net reduction of 6700 BTC of position.
Every market when distributed weakens, becomes fragile !!!
Saturated, the market gave way.
DOWNTREND:
The players then decided to take advantage and open short position, which had a big rise between May 16th and 17th. The price in this period was between 49500 and 42200.
So, without buyers and with shorters, the market collapses. So the Shorters take the opportunity to close their short positions.
ACCUMULATION - PHASE A:
Short positions closed We have the Selling Climax created, with the automatic Rally right after it, it would be the beginning of a Wyckoff accumulation.
ACCUMULATION - PHASE B:
As you can see, the accumulation phase at B is driven by an increase in Long positions as the market lateralizes, absorbing more and more BTC in Dips.
ACCUMULATION - PHASE C:
After successive absorptions in the dips with some realizations in tops that guarantee an improvement in the average positioned price, the market applies a FUD.
The intention of the FUD is always to buy cheaper, that is, to attract bears to help push the price and turn the hand on the bottom, absorbing as it was absorbing before in phase B. Except now the player finds a market with greater scarcity.
Typically this FUD is applied to complete Passive Accumulation and begin an aggressive accumulation that will form phase D.
ACCUMULATION - PHASE D:
It can be seen by the shorters that some Bears were trapped, this happens frequently at the end of accumulations and it is these losing players that are responsible for the classic movement of breaking Resistance called JUMP AT THE CLIFF.
Confirming the JUMP AT THE CLIFF the market enters phase E, firing up and then returning to a Pullback to then resume a bullish direction.
Maybe that's the long-awaited destination for the 100k in December.
You can see that the market goes through the stages of accumulation perfectly, for those who know the stages of accumulation of wyckoff this may look like a painting, I might be thinking of creating an NFT of this, it's beautiful!

NVAX on the daily, Could be looking at a pop upwardsUsing Wyckoff on the daily it looks like NVAX is setting up for a move to the upward direction. Play it how you how want and do your own DD, but I am may be looking at some credit spreads.

UWMC Small Accumulation In Wedge, Looking At Option StraddleLooking at the picture I see a small Accumulation to the upside. Even If I am wrong and we see a dip from the wedge I will be playing straddle options tomorrow on the weekly's depending on how premarket movement goes. Straddle at current price right now, if underlying hits $10.50 that would be close to 100% profits.

Wyckoff Accumulation Update (Bitcoin)This is an update on the Wyckoff Accumulation phase with events.
For a full analysis with a chart of the theory, please see: www.booyahtraders.com

Wyckoff accumulation followed by iH&S i am short term bullish on BTC, stop loss in case things go south.

BTC Wyckoff Accumulation Pattern During this accumulation period, i've been studying wyckoff accumulation pattern. By now i personally think that i have enough data on the chart to confirm this pattern, though i could be wrong. If this theory is correct we should be heading towards the SOS (Signs Of Strength) area and likely heading upwards to the 0.702 fib level.
Between the 0.618 and 0.702 fib. level is a decision time area for btc imo. It is where price will decide if we gonna go set a new ATH or are we just doing a retracement rally before heading back down. In my opinion bulls will win and btc will hit that 75-90k target area this bull run.
Right now we seem to be having a short sqeeze.
I am not a financial advisor and non of this should be taken as a financial advise.
BITSTAMP:BTCUSD

BULLISH: BTCUSD 4h. Update on Wyckoff's Accumulation PhaseHi everyone,
Thank you for considering reading my idea.
We have been following this pattern since 30th of May . In this new chart, we recently have our " Test " signal then pumped to our resistance lines.
For the first time, we have entered PHASE D ! We may find resistance at 40K and see a minor correction up to 37K before, hopefully, we break the resistance lines to see our Sign of Strength (SOS) signal! Once we get this signal, we will continue pumping and enter the Markup Phase .
Like this idea and follow me for more analysis like this. TAYOR.
Cheers,
Juvs

BTCUSDWhat a great start of the week with BTC giving us such relief! Cannot say we are surprised, as we've called a ranging structure on BTC almost 1 month ago, and it has been doing just that eversince.
I know that the chart is a little busy but pay close attention to every small detail.
- See the range between 32k and 40,5k
- See the descending trendline on the 4hr
- See the support level at 35k
- See the targets at 46, 49, and 51k.
We've had a bounce from that 35k support and now BTC broke out of that descending trendline for the first time in 25 days!
THIS IS GOOD!
Now we expect a retest on the trendline, then break through 40,5k area, retest that again, and hopefully we see 46k within 1-2 weeks.

BTC/XLM following Wyckoff You can look at XLM as well and put the same points on them. XLM is cheaper and could be a potential play if it mimics BTC. Been buying around the 31-34 cent ranges for a play to the upside.

BITCOIN 😲 Wyckoff Accumulation??? 🐍🚀 Spring in Progress...BITCOIN -- Supply and Demand ⚔ Battle Continues! 😬
Bullish volume expands at the bottom of Trading Range $32,000.
(This was the "Hold the Door" moment in GOT. 🏋️♂️)
In the Wyckoff schematic, this appears to be the SPRING 🐍. Bullish volume has entered... bulls escape the death trap to $20,000.
Admittedly, "Phase B" went on longer than I thought it could and had me faked out thinking this was a failed Wyckoff Accumulation in my earlier post updates... 😅 but the SPRING move changes this battle of Supply and Demand. 😮
✅1) Flipped 1H - 200 EMA to Support
✅2) Bullish volume increasing as retail traders take long positions.
🟥3) Price needs to get to the $42,000 Resistance Line
🟥4) Reversal is only confirmed with a huge Volume Spike at Sign of Strength... 🐍🔥🚀

ACCUMULATION PHASE A : BTC 1D Timeframe 2021/06/07BITBAY:BTCUSD
This chart analysis is simplified and gamed by previous success methods by yours truly. DYOR, take it with a grain of salt if matters of analysis conflict with yours.
Wycoff Phase A
Fundamentals
Widening spread on chart and selling pressure due to lack in news affected price action (1 of many catalysts) followed by AR (automatic rally); price will test supply and demand levels at SC level.
Institutional demand ensuing.
Manipulators by large stopping downtrend after fake out. Bubbles of distribution meeting a center in price action. Short-coverings included.
Summary
PS - Preliminary Support holds support in channel.
SC - Selling Climax too follow.
Key Notes:
Williams R% has aided in effectively predicted trend projections 10/10 times this quarter on daily time frames for me personally chart is not focused on this momentum oscillator but I do implore onlookers to gather reflections.
Gaining effective trend lines are merely encouraged by simple level tests.
Manipulators are neither conspiratorial nor fictitious. They vary in size, however institutional demand has existed since 2009. Concentration of manipulators are as natural as retail, some say slowly gaining equal and collective boundaries.
Thanks, be easy.

Potential ReAccumilation to the upsideSQ at first looked like a distribution but the Apr 13th high never went above the previous high on Feb 11th. I do see a potential false 1st spring on march 4th to the upside which didnt play out but there is another potential spring to the upside on may 19th that is slightly lower than the march 4th 'Spring" . I cant post a pic on here but if anyone else is looking at this let me know what ya think. Possibly this week we will get a better picture of the puzzle <3

BTCUSD Long: Accumulation Phase to end, & Bitcoin BullishBitcoin bulls in control.
Accumulate more Bitcoins and Hold , Trading Bitcoin futures not Advised.
OK, so ..... I have combined the Wyckoff Accumulation Method with Elliot Wave.
PLEASE NOTE: The Wyckoff Accumulation method is not yet COMPLETE but is still in Progress and on PHASE D we waiting for PHASE E to Confirm that the method is Complete. Refer to the Wyckoff Accumulation method for more.
According to the Wyckoff Accumulation :
We just entered Phase D after Breaking Above the Support Levels.
ABC Phases are complete.
Then according to the Elliot Wave:
AB = BC ( always a Flag/Flat ) @ Fib 100 - 1.236
FIB = 50 - 61.8
Wave 1 & 2 complete now on Wave 3( this wave when combined with the Wyckoff Method for Accumulation it is gonna have LPS created & SOS(after breaking above the Resistance levels)) then only after wave 3 has completed we will see wave 4 above the Resistance levels of the Wyckoff Method which for some it will be in a form of a re-test after break then after wave 5.
For some A Double Bottom has been created.
So start Buying/ Accumulating more Bitcoins.
See ya'll @70K and Above..

BTCUSD Wyckoff Pattern Accumulation ZoneI can sketch something and I follow like this! Not financial advise.

This is starting to look more like Re-DistributionI am comparing the re-accumulation zone back in January to now. Both the differences in the pattern and also the differences in the indicators.
Volume, MACD (the histogram portion) and RSI currently are showing weakness after showing a bit of strength which is the opposite of what was shown during the accumulation stage in January.
A point of interest on the chart is that the current support seems to have been the accumulation area below it in January as shown the chart.
Things that could change my mind is that there will most likely be a further decrease in price coming soon. If it can bounce once more and break back through the current descending triangle, with a retest, then it would finally have that show of strength that is missing now for an accumulation zone.
If the trend changes:
I would say a break through would target the 50 DMA which is currently cutting through the old support.
Another bounce area soon might be the 50 week MA (~29k) which may suggest that might be a potential spring area to retest the descending triangle once more and try to break over.
If the markdown does continue:
A complete breakdown could drop it towards the 17.5k area but never too clear on these. An overshot of any target before a bounce is always possible too.
Wyckoff distributions usually lead to another re-distribution area after the initial markdown in price. That is currently what I am seeing now unless things change.
Becareful trading out there as these times are meant to confuse and do the unexpected at least during the micro timeframes. One thing to add is even a breakthrough may not go far as the macro for BTC still is very negative.
***Disclaimer: I am not a financial professional/expert and all ideas from me are all speculation based off of my own research. Please do your own research as well as I am not responsible for others when it comes to their financial decisions.***


