GBPUSD Weekly Chart Wyckoff Accumulation Events and Phases Hello Traders,
TGIF all!
I observed a Wyckoff Accumulation Pattern on the weekly chart of GBPUSD and I wanted to share the event and phases of Wyckoff schematics.
Wyckoff(1873-1934) was a pioneer in the technical analysis of the stock market. At the age of 15, he started his job as a stock runner for a brokerage in NY. He observed the studies of JP Morgan and Livermore at his time and he arranged their practices into his technique and made them a method to analysis the financial markets. His influential approach to the market helped him develop his work and he founded a school that became Stock Market Institute later.
Wyckoff analyzed trading ranges and the power of the break-outs from that trading ranges. He studied phases and levels of price that moves in harmony, hinting analysts estimated price targets in a pattern.
Phase A describes the end of the down trend. Up to selling climax , supply exceeds demand that caused drop in the price.
Phase B means building phase of price action. Market participants want to observe a cause to buy an asset and may want to observe how fragile the assets valuation. In that Phase, While observing the assets, participants interest is not only observation but also low prices. Race to buy at a lower price establishes a trading range and creates a wave between going up to resistance and down to support line until the observation on diminishing the volume on down moves of the price. Low volume on price drop means, supply starts to fall down while demand stills.
Phase C is the phase that asset price goes through a hard test with the remaining supply. As seen on chart, Spring or Shakeout is the level that price moves below the support level and quickly turns back into the trading range while skimming the cream of sellers. That's a bull trap!
Phase D is the phase that demand starts to exceed supply which moves price higher with heavy volume. We should observe the price at least move to resistance line of the trend line in Phase D!
Price leaves the trading range in Phase E and demand takes the control of the price. We can observe some small trading ranges which are in favor of the price increase.
Lets see how this will result. Wyckoff's methods are still applicable today and love to see his contribution to financial markets.
Hope you all enjoy my work!
Please leave a like and comment of what you think.
Trade safe and have a nice Weekend!
Wyckoffaccumulation

Wyckoff Accumulation campaign on $BTC ideaThis is a follow up of my prior idea of Wyckoff accumulation idea playing out on $BTC
I believe the previous charting I did trying to figure out what phase we're in at the moment was invalidated after watching the market move and considering volume performance as an indicator to better understand what major market players are actually doing.
I believe now we're still in the early Phase B, instead of the D as we just witnessed what I think is a spring event (marked on the chart) that put price below the low of the TR.
In the green box I've noted down some things to look for in the upcoming days or even weeks.

bitcoin Hello friends, I talked about a bitcoin theory similar to this chart before. Unfortunately, that theory has been cancelled, with the incoming 32,000 drop.
This was the last theory I followed. I have summarized the stages and the meaning of the movements for you below.
A: Signal that the downtrend is over
B: the cause generation zone for ascension (triangles/shoulder starts etc.) this phase is considered by the institutions as the position accumulation area. this phase is the long phase of accumulation. transitions to C phase after a quiet period
A: In this phase, the market is tested. The bear trap is set and they want to scare you with the start of trend towards support. In short, this is the last opportunity.
D: The bear trap ends and the resistance is tested. With the closing above the resistance, the buying phase is entered. This is the ideal spot for purchase.
E: It is considered as the low of corrections where the uptrend starts with the arrival of purchases. Big purchases usually come here...
SC Selling peak: The point at which widening spread and selling pressure usually peaks and where heavy or panicked selling by the market is absorbed near or at the bottom by the larger professional interests.
ST Second test: price revisits SC area to test supply/demand balance at these levels. If a bottom is to be confirmed, the volume and price spread should be significantly reduced as the market approaches support in the SC area.
Testing: Market makers always test the market for supply at key points. If a test reveals substantial supply, the market is often not ready to go bullish. A successful test (indicates further price increases to follow)
SOS power sign: Called the region where we could see a high volume price increase
LPS last support point: The lowest point of a reaction or pullback after SOS. The point that was resistance before turns to support.
In conclusion, this is an analysis approach. It may not do 100% the same moves. please do your own analysis and make your own commercial decisions...
You can write your criticism and comments under the share...
If you think the theory is correct, I would be glad if you share it with your friends and like the graphic :)
Of course, if you follow me, I would also be happy :)

Wyckoff Accumulation & 2-2 reversal STRAT off Buyers Candle D TF2-2 Strat reversal Daily off the buyers candle
Bottom of STRAT Broadening formation on the Daily
Declining volume-possible sign of whales taking supply out of the market
multiple retests
price above 9 MA with retest
above VP Point of control+ price imbalance areas in volume profile gaps
All the above = Long
Be Fearful when others are greedy and greedy when others are fearful

Bitcoin - A Wyckoff Cycle Study (Update)With the resumption of the correction in the last few days, I thought it was a great time to provide an update to the previous analysis of the Wyckoff Cycle and to focus in on what appears to be Phase B of the Accumulation period.
In this daily chart in the standard scale, you can see that I have adjusted the way-points of the accumulation template to fit with the price action, but I would note, that there is no timing predictability in this, as the implication is that this is the hallmark signature of market manipulation by larger money powers working to their own schedule. With that said, you can still appreciate that the price movement is still following the guidelines of the template reasonably well.
- see www.wyckoffanalytics.com
I have added two other features to this chart since the original posting, that I summarise for your consideration below:
the Pitchfork Channel - adapted from @TradingShot, it provides an excellent guide for the previous and potentially future trading range, until there is a breakout from the channel that is;
the Symmetric Triangle - defined the trading pattern for the prior period of consolidation; and
the Ascending Wedge - conjecture on my part for a possible structure of price recovery
[/list
At this point it appears that we must fall below $30k for the Wyckoff pattern to be respected, and if you have seen my other BTC charts, you will know that I feel that this entire correction is an Elliott Wave 3-3-5 correction and that we are in the 5th wave of that final leg down, which also forecasts that BTC must (should) drop below $30k. Looking at the Fibonacci projections of this last leg down and they have not changed, but they do offer some interesting correspondences to the lines of the Pitchfork Channel that could suggest possible timings if the low is to touch on one of the lines.
It will be interesting indeed, to watch how price moves after (if) it makes a lower low and at what level it drops to.

Continuation of Wyckoff Accumulation on Bitcoin 1HAs we saw spring last night it seems that the price action is now forming an elliott wave where we are just at the top of the third wave. This top is supported by several other resistance, and previous support lines, in combination with .618 fibonacci retracement of the very first wave of the accumulation phase. In addition we are now, around 36.5k, trying to reclaim a key resistance level . I think it is not very likely that we will break this level at first try, therefore, I expect the price to decrease to around 35k and flip this into support. When this happens an increase to 38-39k can happen.
Elliott wave without the wyckoff

So BTC is in the Wyckoff Acc. Scheme(1) all along, whats next ?The 2021 bullrun rollecoaster of bitcoin is met with Wyckoff distribution Scheme and now an accumulation scheme.
Whats come next is as we got the big jump after the spring, we will soon consolidate for a while before retesting the previous resistance at around 40k
Then, after breaking said resistance we will have the second consolidation that will last longer as the schematic suggest, before retesting 48-50K to then continuing the bullrun

BTC Wyckoff Accumulation to 51kBTC has corrected more than 50% over the last weeks and many are calling for 20k targets. When everyone screams an asset will move in a direction it eventually turns and never gets to the price everybody thought it was headed. This time likely won't be different.
Apart from that, one can spot a Wyckoff Accumulation pattern currently playing out. It'll be interesting to watch how Bitcoin moves in the coming days. I wouldn't be surprised to see a break out off the 30k-42k range in the next weeks.
The Wyckoff Method provides a good game plan for LTF, MTF, and HTF setups until invalidated.
On the FA side El Salvador just declared BTC legal tender and many other Latin American countries are said to be advocating Bitcoin too. Miners are migrating to renewable energy, Deutsche Bank warning of continued inflation over the coming years. Saylor buying 500m worth of BTC.

Take Solutions + Wyckoff Model - LongHere we come across Accumulation phase as specified in Wyckoff Model. As per the model one can take a long position in Take Solutions. The details of the model is described below.
The four stages of Wyckoff model (Accumulation Scheme) are: -
1. Phase A
The selling force decreases, and the downtrend starts to slow down. This phase is usually marked by an increase in trading volume. The Preliminary Support (PS) indicates that some buyers are showing up, but still not enough to stop the downward move.
At Selling Climax (SC) the intense selling activity slows down and comes to an end. But as the selling drops the price quickly reverts into a bounce or Automatic Rally (AR), as the excessive supply is absorbed by the buyers. In general, the trading range (TR) of an Accumulation Schematic is defined by the space between the SC low and the AR high.
As the name suggests, the Secondary Test (ST) happens when the market drops near the SC region, testing whether the downtrend is really over or not. While the ST often forms a higher low in relation to the SC, that may not always be the case.
2. Phase B
Phase B is the consolidation stage, in which the Composite Man starts accumulating the assets at its lowest possible fair value. During this stage, the market tends to test both the resistance and support levels of the trading range. There may be numerous Secondary Tests (ST) during Phase B.
3.Phase C
During Phase C, the Composite Man ensures that there is little supply left in the market, i.e., he accumulates greater amount of shares. A typical Accumulation Phase C contains what is called a Spring. It often acts as the last bear trap before the market starts making higher lows. The Spring often breaks the support levels to stop out traders and mislead investors. We may describe it as a final attempt to buy shares at a lower price before the uptrend starts. The bear trap induces retail investors to give up their holdings. In some cases, however, the support levels manage to hold, and the Spring simply does not occur. Still, the overall scheme continues to be valid. Incidentally in the above case we do not find a Spring.
*See the tremendous accumulation of stock as is evident in volume. However the price shows sidewise movement. The buyer wants to buy maximum shares in a slow pace without letting others know about it.
4. Phase D
Typically, the Phase D shows a significant increase in trading volume and volatility. It usually has a Last Point Support (LPS), making a higher low before the market moves higher. The LPS often precedes a breakout of the resistance levels, which in turn creates higher highs. This indicates Signs of Strength (SOS), as previous resistances become brand new supports.
Despite the somewhat confusing terminology, there may be more than one LPS during Phase D. They often have increased trading volume while testing the new support lines. In some cases, the price may create a small consolidation zone before effectively breaking the bigger trading range and moving to Phase E.
Phase E
The Phase E is the last stage of an Accumulation Schematic. It is marked by an evident breakout of the trading range, caused by increased market demand. This is when the trading range is effectively broken, and the uptrend starts. As of now Phase E has not started. Since we are at Phase D hope Phase E starts soon.
*Now we are in the accumulation phase.
Wyckoff’s Composite Man Principle – Relevant to above theory
The Composite Man,proposed by Wyckoff in reality, represents the big players in the market such as rich individual and institutional investors. He states that the Composite Man, in theory, acts behind the scene and manipulates the market to the disadvantage of the traders if they do not understand the market game. Conversely, it acts to traders’ greatest advantage if traders truly understand the market game. Wyckoff always wanted retail investors to trade just like the Composite Man who acts in the below mentioned manner: -
(i) Accumulation
The Composite Man accumulates assets before most investors. This phase is usually marked by a sideways movement. The accumulation is done gradually to avoid the price from changing significantly.
(ii) Uptrend
When the Composite Man is holding enough shares, and the selling force is depleted, he starts pushing the market up. Naturally, the emerging trend attracts more investors, causing demand to increase.Notably, there may be multiple phases of accumulation during an uptrend. We may call them re-accumulation phases, where the bigger trend stops and consolidates for a while, before continuing its upward movement.As the market moves up, other investors are encouraged to buy. Eventually, even the general public become excited enough to get involved. At this point, demand is excessively higher than supply.
For more information look in the comments.

USDCNY to Fall Towards the Lower End of the Accumulation The USDCNY continues to find itself in a solid downtrend. This is illustrated by the ADX indicator, which has been threading above the 25-point benchmark since late September 2020.
The ADX reached a peak around the time the price action fell to the upper boundary of the last Accumulation range at 6.4700. Afterwards, the price went on to establish a false bullish rebound.
The latter materialised in a Dead Cat Bounce pattern, which typically represents a temporary break in the development of a broader downtrend. The pattern failed to strengthen above the 20-day MA (in red), which is why the USDCNY was then able to break down within the Accumulation range.
That is why the strength of the underlying Markdown - an essential component of the Wyckoff Cycle - appears to be waning down, as underpinned by the ADX indicator after February 2021.
This represents an early signal that the USDCNY is once again getting ready to consolidate in a new range. Before this can happen, however, the price action looks poised to fall to the Accumulation range's lower boundary at 6.2650 once again.

Updated - Potential Wyckoff Accumulation pattern on BTCUSDI charted out possible phases and resistance lines according to the Wyckoff accumulation pattern. I'll be interested to see how closely it continues to follow the pattern.

BTC posswibly Wyckoff accumulation patternIf BTC is indeed following the Wyckoff Accumulation pattern, this is what it may look like. See link below for info on Wyckoff analysis.


If ADA is following the Wyckoff Accumulation model...If ADA is following the Wyckoff Accumulation model, we should see something like this. BTC is following it almost exactly. Link below on Wychoff info.

Very time sensitive data about current Bitcoin Dump!(In Persian)BITSTAMP:BTCUSD
BINANCE:BTCUSDT
Hi ,In this video I discuss about the current Dump , potential moves of the price in immediate short-term , symmetrical Triangle Breakout and Wyckoff's accumulation pattern in action.
For more reference check my other videos about this Wyckoff's accumulation pattern :
If you found this video helpful like and leave your opinion about the current situation in a comment and follow me for more!! tnx🤞

BTCUSD 4h. Update on Wyckoff's Accumulation PhaseHi everyone,
Thank you for considering reading my idea.
This is a continuation update of my previous idea of Wyckoff but this is on 4h timeframe instead of 1h.
In this 4h chart, we had our Selling Climax (SC) at 33K then an Automatic Rally (AR) going up to 39K. We also formed another resistance at 40K. We had our secondary test (ST) at 34K that is somewhat near our SC at 33K.
Currently, we may be in the middle of Phase C. We hope to see some Spring action at 31-32K - then bounce from there; get a test on one of our support lines before going up and see signs of strength (SOS).
What does it mean to get a Spring or Test?
From wyckoffanalytics.com, it says that large operators or institutions will test the market for supply throughout a trading range (TR). A spring is often followed by one or more tests; a successful test typically makes a higher low on lesser volume.
If you want to compare the Accumulation Schematic #1, view it here: www.wyckoffanalytics.com
If you want to know more about Wyckoff Method, read here: www.wyckoffanalytics.com
Like this idea and follow me for more analysis like this. TAYOR.
Cheers,
Juvs


NIO - Potential Wyckoff Accumulation (P&F Target Inside)Since the distribution happened in Feb 2021, NYSE:NIO has formed a selling climax (SC) on 5 Mar 2021 followed by an automatic rally (AR), which defined the trading range.
The selling climax comes with increasing of supply after reacting the earning announcement and even broke below the support at 40. Yet, there is no follow through to the downside. Instead, a trading range has formed.
A lower high has formed within the trading range despite increasing effort (volume) to the upside, suggests that there is presence of supply. The down wave from 27 April till 23 May created a second point of fear (sort of) with localised increased of supply and spring below the selling climax low.
The spring comes with increasing of supply and has been tested with a higher low and decreasing of supply, which is a successful test.
Supply has been decreasing throughout the trading range is a bullish character.
A commitment bar showed up on 24 May 2021 followed by a potential sign of strength rally. Right now, the price stalled at the resistance area with possible supply absorption characters. A commitment above 43 could suggest a start of a markup phase to test the upside target of 50 based on the point & figure (P&F) projection, as shown below.
Based on the first segment (highlighted in green) with count line at 31, NIO has a minimum target price of around 50 should it commit above 43. Higher target can be estimated should the first target at 50 hit.
Failure case: a break below 39 could suggest the timing is not yet ready, and more time to be spent within the trading range.

AUDCAD -- can you reverse, please?Having reached a key level, AC is expected to accumulate long positions for another run towards a Higher High. After a long accumulation we finally see a rally after the Spring. All we need now is multiple levels to be broken to the upside. I have indicated the most probable reversal zone. Worth keeping on your watch list especially for swing traders. GL

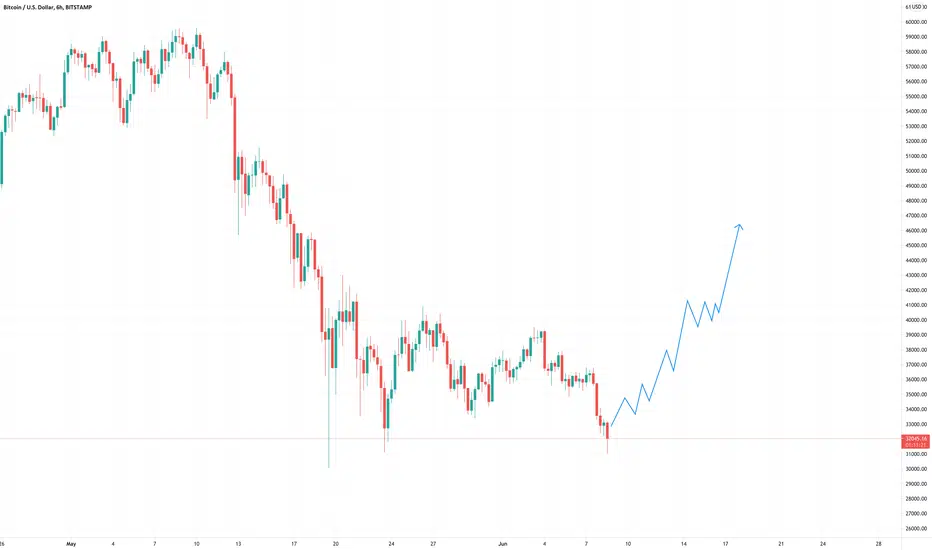
$BTC Wyckoff Accumulation Phase - Scenario 2Here is a brief theory of mine on where we are right now if we really are in an accumulation phase of the Wyckoff Method.
In this scenario, I believe we are early in phase B and will be in for a wild ride over the next couple of months while we utilize the whole range created in January. Hopefully, this will end sometime between mid-June and mid-August, then we can resume the Bull market.
I believe this is the more likely scenario. I will be including a bearish scenario as well.
These are my 1st publications. I am a relatively new trader, so take this for face value only. These are purely thoughts, and I would like to hear any productive feedback you may have.
COINBASE:BTCUSD

Elon's Tweet or Obvious Price Action ?This is an update to my previous Idea linked below. Previously on 4H chart. I've zoomed out to a 1D chart to get some greater perspective.
BTC failed to break its resistance - indicating an inevitable downward movement.
Then came Elon's tweet, catalyzing the downward momentum.
I don't really think his tweet had much to do with this drop as TA already told us to expect it.
I view his tweets as catalysts to what is already expected as per TA.
On the chart, I've delayed the time estimated to reach "spring".
Using the 1D RSI I'm more confident that we will likely break support in the week to come before trending up for the long term.
My ideal price movement is marked in green.
Comments and criticism welcome
