Wyckoff Distribution or Bullish Flag? EURUSDPotential Wyckoff distribution schematic on the 5m Chart
The pair is over-extended to the up side and is ready to move to the down side. If it is wyckoff, we will be entering the last two phases before the sell off.
As usual, trade responsibly and use appropriate risk for your account.
Wyckoffdistribution

Bitcoin in Wyckoff Method Phase 4: DistributionHello everyone,
This is not my idea but I got this from uncomplication from Youtube on how Bitcoin follows the Wyckoff Distribution Phase. It was uploaded a month ago and I tried to update it myself and see where we are now.
Wyckoff is a method that consists of 4 phases: Accumulation, Markup, Distribution, and Markdown.
Currently, Bitcoin is in the Distribution phase. I manage to plot the price actions based on Wyckoff Distribution Schematic #1. I think we are in Phase D's Last Point of Supply. Note that I am not an expert in the Wyckoff Method. There are many resources for that if you want to learn more as I am also learning myself.
Cheers,

Wyckoff Method - Distribution PhaseHi everyone,
This is early to tell but based from MATIC's price movement against USD, we may be following the Distribution Phase of Wyckoff Method.
Initially, we may have already reached the Buying Climax (BC), with this it had an Automatic Reaction (AR) then went up to do a Secondary Test (ST) of the Buying Climax (BC).
What's next? We're looking for sign of weakness (SOW) that should be lower than the Automatic Reaction (AR).
Like and follow for more updates

NZDJPY CLASSIC TEXTBOOK DISTRIBUTIONLast week of May 2021 we entered phase c of the wycoff distribution which is utad. This took out old highs
We are currently testing the utad
Price is expected to react around 79.865 then drop

7200 $TASI stcok short idea $7200 looks like Wyckoff Distribution ( H&S) top pattern $101 critical confirming point.

TWTUSDT WYCKOFF DISCTRIBUTION ANALYSISTrade Proposal:
There is a probability of first tp to the proposed ( 0.87 ) Direction line. So, Traders can set orders based on Price Action and expect to reach short term goals.
Technical analysis: TWTUSDT Waiting for the Range Bound and the beginning of the Ascension Trend.

OILBRENT WYCKOFF DISCTRIBUTION ANALYSISTrade Proposal:
There is a probability of first tp to the proposed ( 68.0) Direction line. So, Traders can set orders based on Price Action and expect to reach short-term goals.
Technical analysis:
OILBRENT is in Downtrend and It is Expected to Continue Downtrend.


Continuation Wyckoff Distribution on Bitcoin 1H As showed in the post of yesterday, Bitcoin created the beginning of a Wyckoff distribution. Bitcoin dipped a little below the second wave target, however, finding support on the 21MA of the 3h chart.
Overnight it followed up on the 3rd wave of elliot with a 4hour consolidation around the .618 fibonacci retracement. Waiting for the small pullback to confirm the support on the .618 and then continuing to the top resistance at 42,300.

BTCUSD DISTRIBUTION #2 [SHORT] 10RBTCUSD DISTRIBUTION #2 10R
BASED OFF WYCKOFF DISTRIBUTION SCHEMATIC #2
miro.medium.com

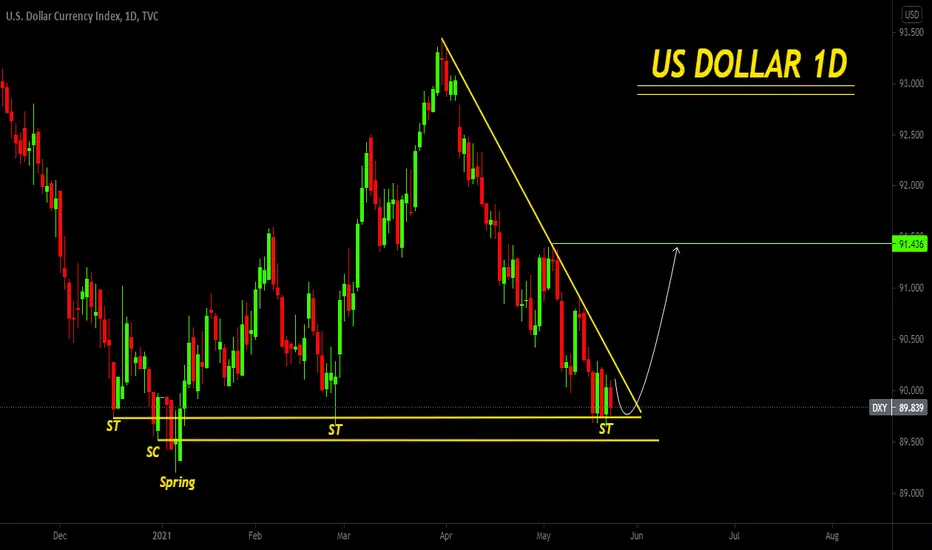
USDOLLAR WYCKOFF DISCTRIBUTION ANALYSISTrade Proposal:
There is a probability of first tp to the proposed ( 92 ) Direction line. So, Traders can set orders based on Price Action and expect to reach short term goals.
Technical analysis: USDOLLAR Waiting for the Range Bound and the beginning of the Ascension Trend.

BTC Possible Entry to Wyckoff Accumulation PatternAfter seeing some content describing the correlation between BTC's recent price activity and the Wyckoff Distribution pattern (many thanks to YouTuber "Uncomplicated"!) and seeing how perfectly they matched, I took the next logical step to project what it might look like if we transitioned directly into a Wyckoff Accumulation pattern.
This Idea presents one possibility of what that might look like. I have drawn this Idea to be intentionally pessimistic, as I am "planning for the worst & hoping for the best". Based on this work, I am preparing for the possibility that I may need to HODL my BTC down to a price point of approximately $15k ... something I would have thought impossible a few months ago, but it doesn't seem so impossible anymore. The upside of that, obviously, would be to accumulate additional crypto during this cycle.
NOTE: All price levels & timespans are guesstimated for projection purposes; if we actually do enter such a phase, it could be shallower & faster, or deeper & slower, depending on more variables than anyone can be aware of.
ALSO NOTE: I HOPE I'M WRONG ON THIS! I am long-term bullish on crypto projects in general & BTC in specific. As a career technologist, I believe deeply in the purpose & mission of crypto assets, and what they can provide in our world. I am hoping for a best case scenario where the recent plunge to $29k is the absolute lowest bottom we ever see again for BTC ... but I wouldn't bet my life on it.
For a description of Wyckoff theory, check out: school.stockcharts.com
#NotFinacialAdvice

Wyckoff - Rally Back to the IceBreaking of the "Ice" (the ice was support throughout the distribution) happened the other day with that sharp drop from 43k to 30k.
According to the Wyckoff distribution, there is always a rally back to test that break. This is to confirm that the demand is still scarce.
I speculate if the price does not break and hold above 42.5k on the daily then the markdown will continue and this time the target could possibly be around 21.5k.
The Wyckoff distribution has been textbook so far since it began, so I do not see any reason to doubt this.
Other bearish signs include falling out of a rising wedge recently and leaving a graveyard doji behind on the 4H (4am UTC).
Be very careful now trading during this time.
***Disclaimer: I am not a financial professional/expert and all ideas from me are all speculation based off of my own research. Please do your own research as well as I am not responsible for others when it comes to their financial decisions.***

WYCKOFF'S DISTRIBUTION #1: Are Bears Strong Enough?Hello everyone!
In this analysis, I present the Wyckoff's theory regarding the distribution phase, some other indicators reinforcing it and why I believe Bitcoin is losing power right now. It looks like Bitcoin is perfectly following every single step of it and any trader should be cautious about it.
* If you are not familiar with Wyckoff's theory, you can take a look at this image and use it as a comparison: i.redd.it
As shown in the chart above, so far, we've completed phases A, B and C with its respective events. The run to the ATH may have set the top for a while, indicated by the UTAD, being the last strong move of the trend. According to the theory, we should expect a down trend from now on, going thourgh phases D and E in the following days. The relevant levels to watch and a key factor are presented below, according to some other analyses:
• Elliott wave :
We could draw an Elliott wave starting at the Bitcoin's bottom @ ~3000 USD. In this case, we have potentially just completed wave 3 after a 1500% gain and the price would now start to correct in wave 4. This comes as a confluence with the distribution theory.
Trying to find targets for this move, we could use the Fibonacci retracement. Elliott's theory says we should expect wave 4 to retrace no more than 38.2% of wave 3. So I believe the lowest level Bitcoin could go to during this correction/distribution would be around 22k and that's huge! It would mean a 65% correction . However, that level is not guaranteed, as the price could retrace much less than that, maybe to 33k, where we have another Fibo level or even any other support we may found during this down trend. Anyway, it will be a very nice opportunity to reaccumulate Bitcoin at lower prices, aiming for the following wave 5 in the future.
If this is correct, some patience may be needed. According to Elliott's theory, wave 4 can take some time to be developed. I'm expecting it to be similar to wave 2, so we would have several weeks of down trend ahead.
• Trading Psychology :
If you are a crypto enthusiast, you may recognize everyone is still very bullish about Bitcoin and influencers are yelling BUY THE DIP at pretty much every single red candle we have on the daily chart. That's dangerous! Let's take a look at a common argument they have: the 50 day moving average.
Overbullish people tend to say buying when the price touches this line is a good buy . Well, it is untill it turns to a good bye ! Take a look at the current situation below. The 50MA is represented by the green line. We are at this level once again and many people are buying.
However, take a look now at 2017's top. A similar situation happened and I'm sure many people have bought and got rekt right there!
"Be cautious and fearfull when others are greed." Remember very few people have sold the top in 2017, most of them were expecting higher highs. The top must come someday, and it's usually when no one is expecting...
>Now, the bullrun may not be over yet. We might see a double top's run similar to 2013. Also, thats what the Elliot wave shown above tells us. The current correction should correspond to wave 4. There's still a great run for wave 5 in the future.
>> Many other bearish indicators show us we should expect the market to move downwards in the short term. I'll avoid extending this analysis for too long, so there is a link below to one of my previous ideas which I present several bearish indicators in confluence with the current scenario, such as the multiple divergences, Pi Cycle's top and chart patterns. Make sure to check it out!
** This analysis would be invalidated if we end up crossing the ATH once again. It is still a very good risk/reward situation we have here.
At this point, it would be very ignorant not to consider all of this.
Feel free to share your thoughts in the comment section below.
Safe tradings, everyone!

CAD WYCKOFF DISCTRIBUTION ANALYSISTrade Proposal:
There is a probability of first tp to the proposed ( 0.86 ) Direction line. So, Traders can set orders based on Price Action and expect to reach short term goals.
Technical analysis: CADCHF Waiting for the Range Bound and the beginning of the Ascension Trend.


Wyckoff Distribution BTC Bitcoin Gaze upon this comparison in all its glory!
Left: 2017 beginning of Bullrun almost identical Wyckoff Distribution occurred......... 42% drop 35 days from the peak.
Right: 2021 Bullrun everyone is pissing their pants over LOL. What do you know........ 42% drop 35 days from the peak.
In June 2017 after this pattern played out the Bitcoin Price went on to do another 10x before its return to the planet. This Bull is NOT over.


BTCUSD Wyckoff distribution topClassic Wyckoffian distribution top. You should be out of your longs now.

BTC WYCKOFF DISCTRIBUTION ANALYSISPSY—preliminary supply, where large interests begin to unload shares in quantity after a pronounced up-move. Volume expands and price spread widens, signaling that a change in trend may be approaching.
BC—buying climax, during which there are often marked increases in volume and price spread. The force of buying reaches a climax, with heavy or urgent buying by the public being filled by professional interests at prices near a top. A BC often coincides with a great earnings report or other good news, since the large operators require huge demand from the public to sell their shares without depressing the stock price.
AR—automatic reaction. With intense buying substantially diminished after the BC and heavy supply continuing, an AR takes place. The low of this selloff helps define the lower boundary of the distribution TR.
ST—secondary test, in which price revisits the area of the BC to test the demand/supply balance at these price levels. For a top to be confirmed, supply must outweigh demand; volume and spread should thus decrease as price approaches the resistance area of the BC. An ST may take the form of an upthrust (UT), in which price moves above the resistance represented by the BC and possibly other STs before quickly reversing to close below resistance. After a UT, price often tests the lower boundary of the TR.
SOW—sign of weakness, observable as a down-move to (or slightly past) the lower boundary of the TR, usually occurring on increased spread and volume. The AR and the initial SOW(s) indicate a change of character in the price action of the stock: supply is now dominant.
LPSY—last point of supply. After testing support on a SOW, a feeble rally on narrow spread shows that the market is having considerable difficulty advancing. This inability to rally may be due to weak demand, substantial supply or both. LPSYs represent exhaustion of demand and the last waves of large operators’ distribution before markdown begins in earnest.
UTAD—upthrust after distribution. A UTAD is the distributional counterpart to the spring and terminal shakeout in the accumulation TR. It occurs in the latter stages of the TR and provides a definitive test of new demand after a breakout above TR resistance.
Credits: school.stockcharts.com
THIS IS MY OWN IDEA ONLY. This is not a financial advise. Educational Purpose Only

wyckoff trading methodEXACT MACHT MODEL OF TRADING PAIR BTC-USD FOR NEXT MOVE
EVENTUALLY RANGE BETWEEN 30k

BTCUSD : Wyckoff Distribution BTC Bearish scenario. Pretty similar w/ wyckoff Distribution Schematic.
Forming rising wedge n breakdown + confirmation rejection on it.
BTC fails to break the resistance at 58k at last point of supply , according to Wyckoff distribution and falls to zone around 42k. BTCUSD
