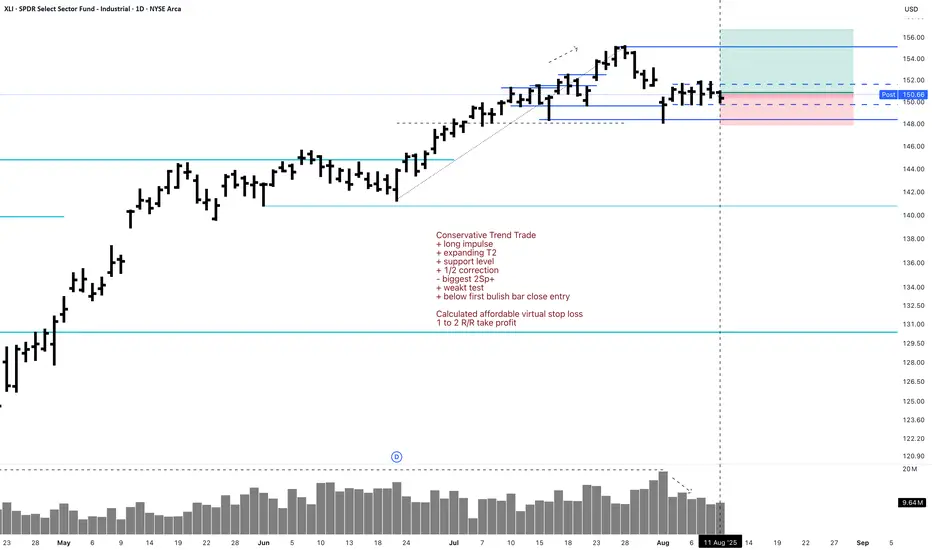
XLI 1D Long Investment Conservative Trend TradeConservative Trend Trade
+ long impulse
+ expanding T2
+ support level
+ 1/2 correction
- biggest 2Sp+
+ weakt test
+ below first bulish bar close entry
Calculated affordable virtual stop loss
1 to 2 R/R take profit
Monthly Trend
"+ long impulse
+ long volume distribution
= neutral zone"
Yearly trend
"+ long impulse
+ neutral zone"
Wyckoffmethod
GAMUDA CONTINUING MARKING UPThis is just a continuation from my previous thesis
**pls refer to the link below
I just want to mention that there is another formation of feather's weight (FW) (**Red line) since the Stepping Stone (SS)
I would be labelling this FW as a form of SS
It would be interesting if today's Bar / Candlestick, able to commit above yesterday's Bar/Candlestick (31/7/25)
-Noticed the huge selling blocks (*Purple Arrow)
EP n SL as attached (Position Intiated @ 31/7/25)
PureWyckoff

KLCI BULLISH
This is just a continuation from my previous thesis of KLCI
*Refer to the link
Trading Range, forming the Schematic #2 of Accumulation
Need to refer other source for volume as TV doesnt provide it

SCGBHD CONT MARKING UPThis is a continuation from my previous thesis
A simple , short , trading range, offer low risk entry
I Maintained my previous thesis
Current marking up is a continuation from previous Trading Range (Refer Link)
Position as attached
PureWcykoff

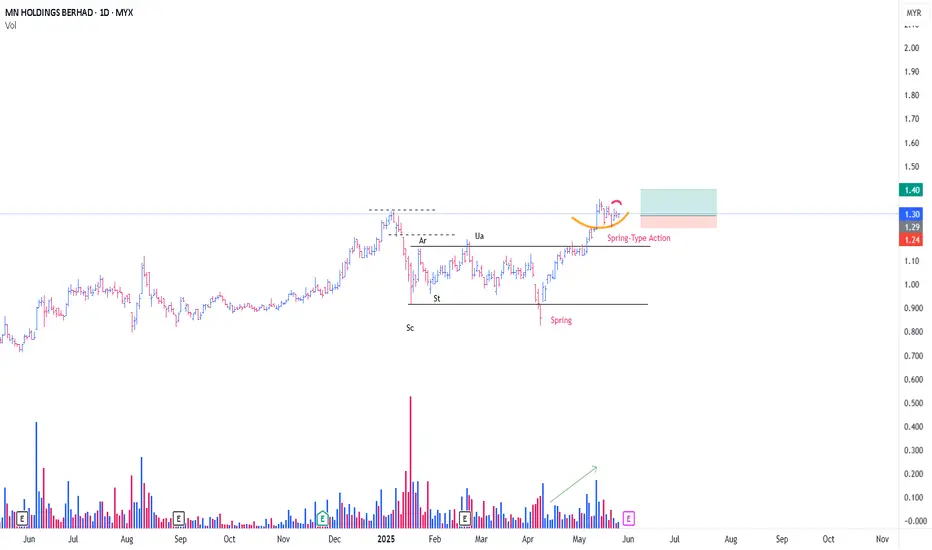
MNHLDG CONTINUE MARKING UPThis is a continuation from my previous entry
**Refer link
Referring to the Red Box, I see it as a Stepping Stone (SS) , a mere temporary stop centre,
before continuing marking up from previous Trading Range (Red Arc Line).
My hypothesis is that, this box are forming a mini Trading Range , in which the formation of local spring , prompted me to initiate position.
The 3 Bars (Or Candlesticks, whatever you prefer), are basically a SpringBoard [/b ] in the form of Absorption.
For Non Wyckoffian, this might be confusing.
Different POV produce different meaning & context/subcontext.
I intiated my position @ 31/7/25, added position today
PureWyckoff

KGB CONTINUE MARKING UPI have been monitoring KGB since my last entry
*Link given
This is a typical Schematic #1 of Re-Accumulation Trading Range
I initiated my position today in the background of Stepping Stone (Red Line)
Based on the influx of buying demand for the past few days, looks like the on going,
Feather's weight & SpringBoard **Purple line, are forming in the theme of Absorption.
Tight risk for this one, im expecting, to get in back, if my current position got knocked out
*(only if low risk entry is formed)

July 30 2025 USDJPY Buy Limit ActivatedGood day, folks!
Another trade today! This is a continuation trade before the USD fundamental news. I've got some useful schematics on my chart for trading continuation momentum patterns with positive confluence in your fundamentals. You can see a swing structure BOS with validity of an internal structure: another BOS. I waited for the price to tap again into that valid order block, which also had validity of internal structure - BOS. The risk-reward (RR) is 1:4. Check the chart for detailed annotations.
I hope you find value in this trade today. Until next time!
#proptrader
#wyckoff
#supplyanddemand
#riskmanagement

Getting short on EUR/USD!The dollar has looked set for a reversal and coming into the week it didn't hang around at all. I had a bit of a short bias on EUR/USD and was looking for confirmation signal which pretty much came at market open.
Price pushed higher back into the key level taking out a short term high, but was unable to follow through to form a new higher high. Heading into Monday London session, momentum immediately took hold with a clear bearish change of character and price didn't look back > breaking structure and key levels with minimal effort.
I was waiting for a pull back to get short early which didn't occur. But no need to chase price, waiting and patience is part of the game.
Price has now broken another key support level and is set to retest it as resistance. This will be my entry point (see screenshot) > using the 70.5%-78.6% fib retracement level and my stop above Tuesdays high. Keep it simple.
s3.tradingview.com

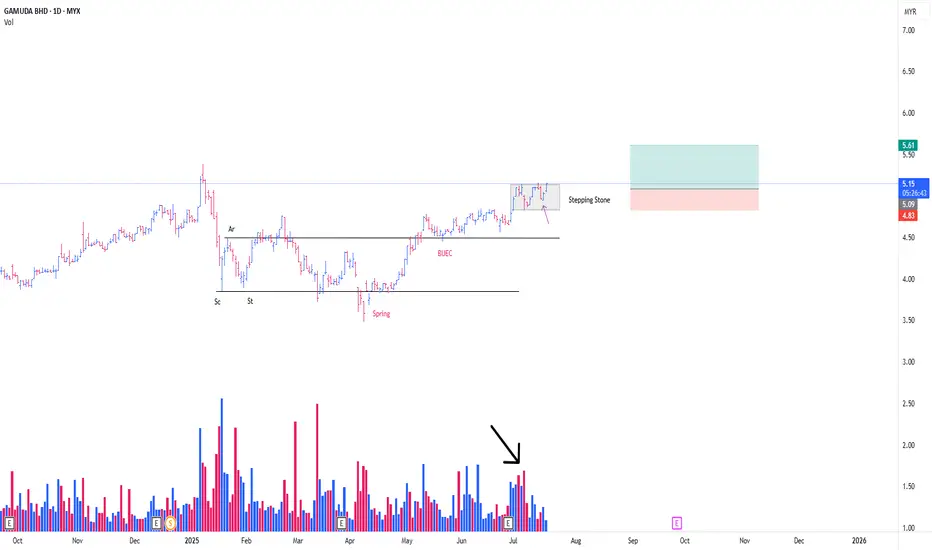
GAMUDA CONT MARKING UP PHASEThis is a continuation from my prev post
**Refer to the link below
This is a play coming from the Stepping Stone (SS)
-SS is a term, in wcykoff methode , particularly describing a momentarily 'pause' in between, consecutive mark up phase.
Absoprtion detected from the on going SS
*Black arrow
with the possibility of Trigger Bar today, in the background of SpringBoard Schematic #2 *Purple arrow
-Position initiated as attached
PureWyckoff
SCGBHD WILL CONTINUE MARKING UPThis is just a continuation from my previous trading idea for SCGBHD
**Refer below
I was liquidated from the position yesterday
Now, looks like at the minimum, i was too early for this stock previously.
With the formation of Spring-Type Action ,
And the On-Going absoprtion especially supply from 28/5 (Black arrow)
I initiated my position as attached
PureWyckoff

MNHLDG GOING TO CONT MARK UPI maintained my previous thesis for MNHLDG
**please refer to my previous
Just need an addition, for the formation of new 'Local Spring' *black color word
i was knocked out on last position for this
market environment dragged MNHDLG despite with a positive surrpise earning
Based on Spring Setup,
looks like Test Of The Spring success at the moment
i initaited position as attached with tight cut loss
PureWyckoff

PEKAT CONT MARKING UPThis is a continuation of my prev thesis for Pekat
**Refer prev post
Since my previous position, Pekat has been always under my radar.
(This is a Stepping Stone Zone, Continuation from previous Mark Up Phase)
what caught my attention, the formation of BUEC consistenly unfolding in the background of reducing supply (red arrow)
With the formation : type #2 schematic of feather's weight (black line)
*No springboard here. difficult to see this kind of setup
although the entry point, a bit extended comparing to my average price entry, but it was still contained within the limit (not more than 2%)
Position intiated as attached
PureWyckoff

KJTS CONT MARKING UPThis is just a continuation of my prev thesis
**please refer to the link below
Turned out, KJTS formed Type #2 Schematic of Reaccmulation (Rising Bottom)
As it looks now, current price action seems to be confirming BUEC
**Buec is part of Phase D of Wyckoff Event
Noticed the formation of Feather's Weight (Yellow Line), coincided with BUEC
Bought a position today in view of Trigger Bar
Ep + SL as attached
PureWcykoff

July 15 2025 -Sell Limit ActivatedGood day, folks!
Just sharing another learning from my ideas here:
EURUSD has been in a bearish structure since July 14, 2025 (1H Intraday). As you know, I always look for clear supply or demand validation before placing a sell or buy limit order. On the chart, you can see a valid supply zone that was generated on Monday. After that, I waited for a clear move during the Tuesday London and New York sessions, with the CPI news release acting as a catalyst for more volatility. The trade came to fruition during the New York session on Tuesday. (See chart for the complete breakdown of the movement and entry.)
RR: 1:3
Another Wyckoff schematics and structure analysis.

KLCI BULLISH
This year, 2025, has been another challenging time in Bursa KLCI.
I have been on the sideline most of the time, since August 2024
We initiated our real positions on 14-17/3/2025, following the follow-through day ,
however some of the positions knocked out n some thriving (e.g ecomate, profit taken)
We then resumed our buying on 11/4/2025, as few stocks setting up with low risk
entry point.
Up until now, our portfolio has been growing up to total ROI of around 14-20%,
with the heavy use of Margin. (e.g scgbhd, mnhldg, gamuda, suncon, pekat)
Based on our current analysis of KLCI Index, we concluded that :
1/ Market probably has discounting all the possible worst case scenarios
-Bottoming process is ongoing to complete .
(A complete type 2 #Schematic Accmulation trading range? probably)
-Tradingview does not provide the Volume data for KLCI Index, need to refer other sources
2/ Market is going for the markup phase
3/ Market is still in the hard-ringgit environment
Our Bottom-Top approach, is purely based on the performance of individual stocks.
Meaning, the stock itself dictate our tactics.
And as always, my focus would be on the leaders, which granting me further leverage.
I need to keep reminding myself,
that in bull market, key is not to fight the market but to execute with precision n risk management.
And I need to keep reminding myself again,
that, it is ok to form an opinion.
But always be ready to adapt to the portals of possibility.
As.. I am in the 'responding business' . Not 'Predicting business'

F 5M Long Daytrade Aggressive CounterTrend TradeAggressive CounterTrend Trade
- long impulse
- unvolumed T1
+ resistance level
+ biggest volume 2Sp-
+ weak test
+ first bullish bar below close entry
Calculated affordable stop market
T2 5M take profit
1H CounterTrend
"- long impulse
- unvolumed T1
+ resistance level"
1D CounterTrend
"- long impulse
- unvolumed T1
+ resistance level"
1M CounterTrend
"+ short impulse
- exhaustion volume
+ T2 level
+ resistance level
- unvolumed interaction bar
- reaction bar looks to close bullish in 6 days"
1Y CounterTrend
"+ long impulse
+ volumed T2 level
+ volumed 2Sp+
+ 1/2 correction
+ weak test"

GAMUDA CONT MARK UPThis is a continuation of my prev post
**Refer link below
In Wyckoff Methode , The Formation of BUEC is a sign that further price advancement will continue
to the phase E (Marking up outside the Trading Range)
The BUEC in this formation, coincide with a Local Spring
On Top of that, with a Feather's weight & Springboard in it
With a Trigger Bar today, position initiated as attached
PureWyckoff

RAMSSOL MARKING UPA rising bottom type of re-accumulation
With the influx of demand (Red Arrow)
Followed by very short term SpringBoard (4/6/25, Black Arrow)
- #1 Springboard, absoprtion Type
**Atypical Type of Springboard
position initiated today based on the Trigger Bar with a very tight risk
Purewyckoff

Location, Location, Location!!!Knowledge is Power!
But how deeply do most people really understand this?
The average mind thinks power comes from possessing knowledge. But here’s a deeper truth — simply imagining yourself with mastery can trigger powerful feelings. Why? Because as Terence McKenna once described, the human brain is a chemical factory. An inspired thought — a glimpse of future achievement — can activate a cocktail of serotonin and dopamine, giving us a real sensation of power. And yet… did anything really change?
This is where ancient voices — shamans, philosophers, and modern mentors — whisper:
“You are already there…”
But are you really?
The answer is Yes… and No.
You feel the outcome, but you haven’t earned it yet. You’re not truly there until you’ve gone through the effort — the hours and hours of disciplined study, reflection, and ignoring the mental traps like “take a break,” “you have time,” or “scroll a bit.” Power, in this case, is the Knowledge itself — and to approach Power, you must become Power. Or else, it will crush you — like a boot crushes an ant. (Yes, that’s borrowed from the Avengers… we all need a laugh too.)
To actually reach that imagined reality, you must prove yourself to the knowledge itself. You have to earn it — through discipline, sacrifice, and unbroken focus. That means hours of study, observation, application, and repetition — no matter how many distractions your mind throws at you.
Focus on one subject until it bends for you.
Focus like your life depends on it.
Because in a way… it does.
🧠 Opportunity Cost = Power Equation
This focused, intentional work is what economists call Opportunity Cost. It’s the measure of how productively you spend your time. Every marked level, every reaction, every shift in volume is either:
• A step closer to mastery, or
• A missed opportunity, depending on what you choose to focus on.
TradingView becomes your journal.
A sacred workspace in the chaos.
A tool to track your evolution — mentally and technically.
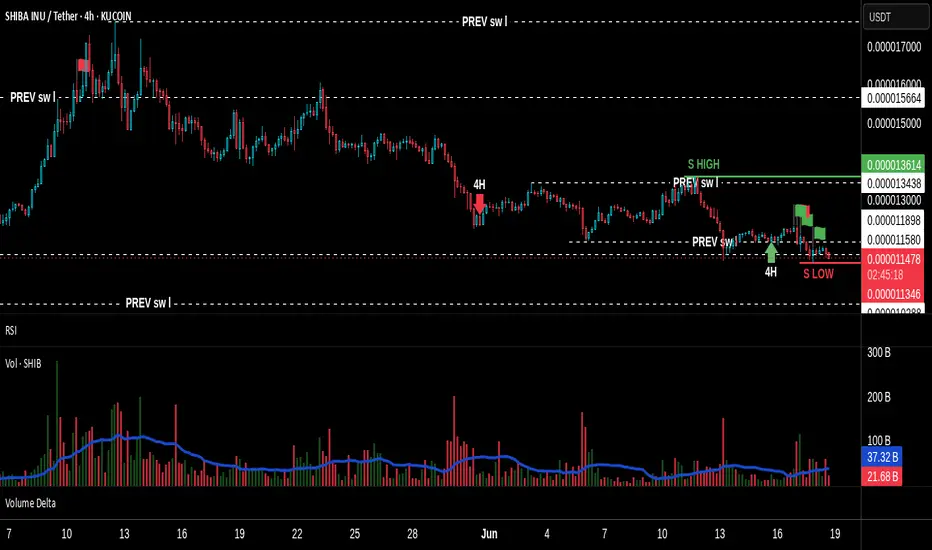
🔍 The SHIBA/USDT 4H Breakdown
On the 4H chart of Shiba Inu, key swing levels are marked — targets that can serve as entry/exit decisions depending on your strategy.
But the magic is not in the lines.
It’s in how volume reacts to those levels.
🔺 Volume — The King
Currently, the 4H Volume shows signs of a bearish continuation. But lower timeframes are beginning to show the initial signs of accumulation — strength where weakness used to live.
This is the beginning of Effort vs Result analysis:
• Are we seeing strong volume but no progress? (Demand absorption?)
• Are we seeing low-effort pushes into supply that fail to break key levels?
That’s how Smart Money behaves. Quietly, strategically, and always one step ahead.
And all this happens near key demand/supply zones — where Location meets Volume.
🔄 Timeframe Psychology: Past–Present–Future
Lower timeframes = The Past (they push).
Higher timeframes = The Future (they pull).
Your active timeframe = The Now — where you make your move.
A shift on the 3M chart might hint, but until it aligns with the 1H or 4H, nothing is confirmed. That’s why true traders are observers first, executors second.
🎯 Alignment: Levels, Volume, Effort
• 📍 Levels: They are not just technical — they are psychological battlegrounds.
• 🔊 Volume: It shows us where energy is being spent and whether it’s paying off.
• 🧱 Effort vs Result: The ultimate measure of Smart Money’s hidden hand.
When everything aligns, you don’t guess — you act.
🧭 Final Thoughts
At the time of this writing — 17:26 IST on June 18, 2025 — the 4H chart remains bearish in tone. But markets shift fast, and for all I know, a power transition could be unfolding on a micro timeframe as I type. That’s the nature of this game.
TA is not rigid. It is an art.
And once mastered, it becomes a part of how you think — not just how you trade.
Use your time wisely.
Let your focus become your fortress, and that fortress will guard you through every storm.
Work Smart. Think Deep. Act with Purpose.
Study the Bitcoin and Bitcoin Dominance cycle to understand altcoin flow.
Explore previous posts — I’ve shared them to help you grow.
The market is a breathing organism, I’ve pointed this in previous ideas. If you’re in sync with it—you’ll feel it.
And for those who believe there’s more to learn—but are struggling to find answers—there’s no shame in asking questions. But remember, nothing in the market is free.
Work Smart, and you’ll earn the right to follow — and even think like — Smart Money.
Till next time, take care—and trade wisely.
GBPUSD Sell Limit Activated June 17 2025This trade was taken today, (tuesday- june 17, 2025). Based on 1H timeframe Supply. I wait for London Session and check for possible liquidity sweep in 15 min and 5min timeframe. I noticed a CHOCH followed by tap in Supply zone of the schematics. I decide to create a sell limit order during New York Session to maximize the Risk to Reward Ratio. (Check the charts for detailed label and movement). 1:7RR
Wyckoff schematics in 1H timeframe--> confluence of supply in lower timeframes for validity.
RR:7
Another classic distribution. patience is the key :)
#wyckoff
#sell
#supplyanddemand

SUNWAY GOING MARK UPFor Sunway, This is an Atypical Re-ACcmulation Schematic #1
-I maintained my prev hypothesis
(Position triggered Stop Loss Level, probably i was too early for this)
*refer my prev post
I view sunway as a Top Competitor, which my no.1 pick would be Gamuda (Refer my prev post)
-Both of which are Insti. Fav
As for the dropping in earnings, the technical side is too beautiful to ignore
Formation of Feather's Weight (Blue LIne)
Along with Possible SpringBoard (Red Line) in action
Would be good sign, if today & upcoming Bars/Candlesticks, succesfully closing above the suply
on 10/6/25 (Red Arrow)
Position initiated with very tight Risk
PureWyckoff

SCGBHD TO CONT MARK UPThis is a continuation trade idea from my prev post
***refer to link below
Since the BUEC , Price advancing for about 45%..
Not qualified for a Power Play by the way
**(Or can consider Semi Power Play)
With a formation of Feather's Weight (Red Line)
SpringBoard sign prompted me to initiate position as attached
Tight Risk
PURE WYCKOFF

MNHLDG CONT TO MARK UPA rare schematic, of Type #1 Accmulation
This is a Power Play
-Since Spring, price soaring high with influx of demand (Green Arrow)
With a Possiblity of Feather's Weight ( Yellow LIne)
-Position initiated @ Spring Board (Red Line)
-Plus with additional Local Spring Type Action
Position intiated as attached
Tight Risk
PURE WYCKOFF