XAUUSD R:R 1:9 OR 1:23This is for Long Term
And this is risky too.
Enter form the Marked Area.
Please DYOR before entering the trade.
Wyckoffmethod

EURAUD WYCKOFFThis is for Long Term
And this is risky too.
Wait for forming UT and UTAD .
Wait for BOS UT by UTAD.
Enter form the Broken support Area.
Please DYOR before entering the trade.

SPX500: I'll keep being bearish until 4100Hi Traders,
This is my view for this week on SP500
I remind you that this is only a forecast based on what current data are.
Therefore the following signal will be activated only if specific rules are strictly respected.
I really hope you liked this content and I would like to know what do you think about this analysis, so please use the comment section below to give me your point of view.
Pit
DISCLAIMER:
Trading activity is very dangerous. All the contents, suggestions, strategies, videos, images, trade setups and forecast, everything you see on this website and are the result of my personal evaluations and was created for educational purposes only and not as an incentive to invest. Do not consider them as financial advice.
———————————


NZDJPY R:R 1:17The structure is broken
Wait for price to reach LPSY zone then Enter
Before entering the trade DYOR

NZDUSD Will it move up R:R 1:23This is for Long term
And this is risky too.
Re-Accumulation after decline
Please DYOR before entering the trade.

NZDJPY Sell SetupWait for BOS
This is for short term
And this is risky too.
Please DYOR before entering the trade.

Wyckoff Distribution (Weekly)XAUUSD in the last phase of distribution (Phase E) and at a Demand zone get get ready shorts may come soon

BTC: Wyckoff Accumulation Scheme Nearing CompletionPrice action from Summer 2021 to present has been accurately following along this Wyckoff Accumulation scheme. Let's see if it will hold true for the last couple legs here.

XRPUSD (1d, Heikin Ashi) - Wyckoff accumulation patternDears,
Look at the beautiful Wyckoff Accumulation Pattern #2 ... Almost classic... :)
With best regards,
Paweł

ETH - Wyckoff Method : What's Next?Hi Traders, Investors and Speculators
Ev here. Been trading crypto since 2017 and later got into stocks. I have 3 board exams on financial markets and studied economics from a top tier university for a year. Daytime job - Math Teacher. 👩🏫
In today's analysis, I'll be giving out LOADS of free information🎁.
We'll study the ETHUSDT chart by using the Wyckoff Method. Trying to understand the market and it's movements may seem futile, however Richard Wyckoff identified a pattern that could easily be translated as bullish cycles, bearish cycles, and the two brief phases that happens before each. Just before a bull cycle (markup), we have accumulation . Now this may take months or even years. Then, just before the bear cycle (markdown), we see distribution phase. This is very evident across all markets - the price cannot simply go up / go down forever! So what can we do with this information? Have the courage to follow the market cycle. To make the cycles a little more clear, here it is on a macro perspective on Bitcoin:
The accumulation phase makes for THE BEST place to have scattered buying orders, in other words follow the dollar cost average method. Not familiar with this method? Check out this detailed educational masterclass:
With this chart, I propose my idea of a potential Ethereum ETH bottom by using the Wyckoff Method .The Wyckoff Method can be extremely technical and complicated, with many phases, sub-phases, sub sub phases etc. The four main phases of the market cycle are accumulation, markup, distribution, and markdown . From the BTC chart I posted above, we can clearly see that we have been trading in the accumulation cycle for a while now. However, we have NOT YET BOTOMMED.
Here are some terms and definitions you may find helpful:
SC—selling climax - the point at which widening spread and selling pressure usually climaxes and heavy or panicky selling by the public is being absorbed by larger professional interests at or near a bottom. Often price will close well off the low in a SC , reflecting the buying by these large interests.
AR—automatic rally - which occurs because intense selling pressure has greatly diminished. A wave of buying easily pushes prices up; this is further fueled by short covering. The high of this rally will help define the upper boundary of an accumulation TR.
ST—secondary test - in which price revisits the area of the SC to test the supply/demand balance at these levels. If a bottom is to be confirmed, volume and price spread should be significantly diminished as the market approaches support in the area of the SC . It is common to have multiple STs after a SC .
What I'd be looking out for at this point, is a potential macro W-Bottom pattern to confirm the low volume selloff phase :
Consider this quote : "Successful tape reading is a study of force, it requires ability to judge which side has the greatest pulling power and one must have the courage to go with that side."
Richard Wyckoff understood that speculating markets is more than just analysis - you also need the courage to follow through on your analysis.
_______________________
📢Follow us here on TradingView for daily updates and trade ideas on crypto , stocks and commodities 💎Hit like & Follow 👍
We thank you for your support !
CryptoCheck

Wyckoff accumulation 2070 Daily ChannelThis my main long term perspective on gold's loooong descending channel since 2070.
In my view, this is just an over-extended bearsqueeze due to the strengthening Dollar Index which would ultimately reach 120 soon, and ultimately peak.
Market Makers are bullish overall and choosing to extend price action for as long as it needs to, and exhausting off as many sellers from the market as possible in the process to secure a decisive break out to the upside.

ALGO completing Wyckoff accumulation phaseAfter a multi-month period of mark-down ALGO is exhibiting the final stages of Wyckoff's accumulation model:
1. Preliminary Support (PS) established
2. Selling Climax (SC) achieved
3. Automatic Rally (AR) occurred
4. Secondary Tests (ST) occurred
5. Price broke key resistance level (Sign Of Strength / "crossed the creek"
6. Price Backed Up ("walk back to creek")
The next phase is the mark-up phase.
This could correspond well with a mid-term rally off SPY support level.

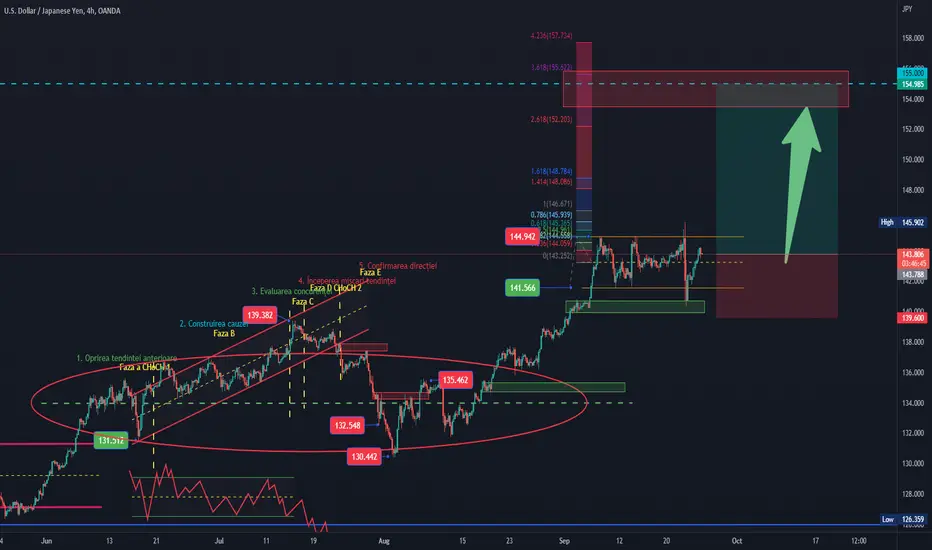
Wyckoff Supply and DemandUSDJPY
Technical analysis
Cause, re-accumulation, equilibrium sequence between demand and supply between quotas , supply zone 144.942 & 141.566 demand zone .
Demand greater than Supply !
Implications,long!
Pattern Rally base Rally!
Effect generated by approx
1115 pips.
SL 138.948
Entry , buy! 143.759
TP 155.000
⭕ = circle
⏹ = square
🔺️ = triangle
Unit = ⭕ market
Polarity = 🔺️demand & 🔻supply
Equilibrium = ⏹ range ("the ratio between supply and demand is =")
PRINCIPLE OF DEMAND AND SUPPLY
The law of supply and demand
- here the analysts study the relationship between supply and demand , having as a reference point the price and
volume over a period of time as shown on the chart.
KEY DEFINITION
The law of supply and demand is of the utmost importance. If the application to
buy an instrument (currency pairs, stocks, commodities , metals, bonds, cryptocurrencies)
is higher than the available supply, the only way the demand can be met is
for the price to rise to a level that attracts enough supply to match demand.
When this point is reached, the price does not advance. If the offer to sell is
higher than the demand to buy, the only way the supply will be absorbed is as
the price drops to a point that attracts enough demand to absorb all
the amount. When that happens, the price doesn't go down.
Readjusted Possible Wyckoff Accumulation range on LUNCTracking this possible range of accumulation a bit early but it looks like we've hit a secondary test (ST) in phase B and possibly going into phase C with the last point of supply ( LPS ) being accumulated by holders and market makers. It goes with the narrative that everyone just jumping onboard with staking and becoming a validator node for the network.


EURUSD The Wyckoff (Accumulation SCHEMATIC 2 ) setup bullish EURUSD The Wyckoff (Accumulation SCHEMATIC 2 ) setup bullish #eurusd
not a financial advice


Wyckoffian logicWhen you understand the Wyckoffian phases of the market, you can determine when to be in or out of the market. You begin to understand how the large accounts determining market the trend, change of trend and price action.
Wyckoff Phases of Accumulation
Phase A: In phase A, supply has been dominant and it appears that finally the exhaustion of supply is becoming evident. The approaching exhaustion of supply or selling is evidenced in preliminary support (PS) and the selling climax (SC) where a widening spread often climaxed and where heavy volume or panicky selling by the public is being absorbed by larger professional interests. Once these intense selling pressures have been expressed, and automatic rally (AR) follows the selling climax. A successful secondary test on the downside shows less selling that on the SC and with a narrowing of spread and decreased volume. A successful secondary test (ST) should stop around the same price level as the selling climax. The lows of the SC and the ST and the high of the AR set the boundaries of the trading range (TR). Horizontal lines may be drawn to help focus attention on market behavior.
It is possible that phase A will not include a dramatic expansion in spread and volume. However, it is better if it does, because the more dramatic selling will clear out more of the sellers and pave the way for a more pronounced and sustained markup.
Where a TR represents a reaccumulation (a TR within a continuing up-move), you will not have evidence of PS, SC, and ST. Instead, phase A will look more like phase A of the basic Wyckoff distribution schematic. Nonetheless, phase A still represents the area where the stopping of the previous trend occurs. Trading range phases B through E generally unfold in the same manner as within an initial base area of accumulation.
Phase B: The function of phase B is to build a cause in preparation for the next effect. In phase B, supply and demand are for the most part in equilibrium and there is no decisive trend. Although clues to the future course of the market are usually more mixed and elusive, some useful generalizations can be made.
In the early stages of phase B, the price swings tend to be rather wide, and volume is usually greater and more erratic. As the TR unfolds, supply becomes weaker and demand stronger as professionals are absorbing supply. The closer you get to the end or to leaving the TR, the more volume tends to diminish. Support and resistance lines usually contain the price action in phase B and will help define the testing process that is to come in phase C. The penetrations or lack of penetrations of the TR enable us to judge the quantity and quality of supply and demand.
Phase C:In phase C, the stock goes through testing. It is during this testing phase that the smart money operators ascertain whether the stock is ready to enter the markup phase. The stock may begin to come out of the TR on the upside with higher tops and bottoms or it may go through a downside spring or shakeout by first breaking previous supports before the upward climb begins. This latter test is preferred by traders because it does a better job of cleaning out the remaining supply of weak holders and creates a false impression as to the direction of the ultimate move.
A spring is a price move below the support level of a trading range that quickly reverses and moves back into the range. It is an example of a bear trap because the drop below support appears to signal resumption of the downtrend. In reality, though, the drop marks the end of the downtrend, thus trapping the late sellers, or bears. The extent of supply, or the strength of the sellers, can be judged by the depth of the price move to new lows and the relative level of volume in that penetration.
Until this testing process, you cannot be sure the TR is accumulation and hence you must wait to take a position until there is sufficient evidence that markup is about to begin. If we have waited and followed the unfolding TR closely, we have arrived at the point where we can be quite confident of the probable upward move. With supply apparently exhausted and our danger point pinpointed, our likelihood of success is good and our reward/risk ratio favorable.
Phase D:If we are correct in our analysis and our timing, what should follow now is the consistent dominance of demand over supply as evidenced by a pattern of advances (SOSs) on widening price spreads and increasing volume, and reactions (LPSs) on smaller spreads and diminishing volumes. If this pattern does not occur, then we are advised not to add to our position but to look to close out our original position and remain on the sidelines until we have more conclusive evidence that the markup is beginning. If the markup of your stock progresses as described to this point, then you’ll have additional opportunities to add to your position.
Your aim here must be to initiate a position or add to your position as the stock or commodity is about to leave the TR. At this point, the force of accumulation has built a good potential as measured by the Wyckoff point-and-figure method.
In phase D, the markup phase blossoms as professionals begin to move into the stock. It is here that our best opportunities to add to our position exist, just as the stock leaves the TR.
Phase E: Depicts the unfolding of the uptrend; the stock or commodity leaves the trading range and demand is in control. Sell offs are usually feeble.
Wyckoff Accumulation Events
PS: Preliminary support, where substantial buying begins to provide pronounced support after a prolonged down-move. Volume increases and price spread widens, signaling that the down-move may be approaching its end.
SC: Selling climax, the point at which widening spread and selling pressure usually climaxes, as heavy or panicky selling by the public is being absorbed by larger professional interests at or near a bottom. Often price will close well off the low in a SC, reflecting the buying by these large interests.
AR: Automatic rally, which occurs because intense selling pressure has greatly diminished. A wave of buying easily pushes prices up; this is further fueled by short covering. The high of this rally will help define the upper boundary of an accumulation TR.
ST: Secondary test, in which price revisits the area of the SC to test the supply/demand balance at these levels. If a bottom is to be confirmed, volume and price spread should be significantly diminished as the market approaches support in the area of the SC. It is common to have multiple STs after a SC.
Shakeouts: (and or Springs) usually occur late within a TR and allow the stock’s dominant players to make a definitive test of available supply before a markup campaign unfolds. A “spring” takes price below the low of the TR and then reverses to close within the TR; this action allows large interests to mislead the public about the future trend direction and to acquire additional shares at bargain prices. A terminal shakeout at the end of an accumulation TR is like a spring on steroids. Shakeouts may also occur once a price advance has started, with rapid downward movement intended to induce retail traders and investors in long positions to sell their shares to large operators. However, springs and terminal shakeouts are not required elements..
Test: Large operators always test the market for supply throughout a TR (e.g., STs and springs) and at key points during a price advance. If considerable supply emerges on a test, the market is often not ready to be marked up. A spring is often followed by one or more tests; a successful test (indicating that further price increases will follow) typically makes a higher low on diminished volume.
SOS: Sign of strength, a price advance on increasing spread and relatively higher volume. Often a SOS takes place after a spring, validating the analyst’s interpretation of the prior price action.
LPS: Last point of support, the low point of a reaction or pullback after a SOS. Backing up to an LPS means a pullback to support that was formerly resistance, on diminished spread and volume. On some charts, there may be more than one LPS, despite the ostensibly singular precision of this term.
BU: Back-up. This term is short-hand for a colorful metaphor coined by Robert Evans, one of the leading teachers of the Wyckoff method from the 1930s to the 1960s. Evans analogized the SOS to a “jump across the creek” of price resistance, and the “back up to the creek” represented both short-term profit-taking and a test for additional supply around the area of resistance. A back-up is a common structural element preceding a more substantial price mark-up, and can take on a variety of forms, including a simple pullback or a new TR at a higher level.
Wyckoff Phases of Distribution
Phase A: In Phase A, demand has been dominant and the first significant evidence of demand becoming exhausted comes at preliminary supply (PSY) and at the buying climax (BC). It often occurs in wide price spread and at climactic volume. This is usually followed by an automatic reaction (AR) and then a secondary test (ST) of the BC, usually upon diminished volume. This is essentially the inverse of phase A in accumulation.
As with accumulation, phase A in distribution price may also end without climactic action; the only evidence of exhaustion of demand is diminishing spread and volume.
Where redistribution is concerned (a trading range within a larger continuing down-move), you will see the stopping of a down-move with or without climactic action in phase A. However, in the remainder of the trading range (TR) for redistribution, the guiding principles and analysis within phases B through E will be the same as within a TR of a distribution market top.
Phase B: The building of the cause takes place during phase B. The points to be made here about phase B are the same as those made for phase B within accumulation, except clues may begin to surface here of the supply/demand balance moving toward supply instead of demand.
Phase C: One of the ways phase C reveals itself after the standoff in phase B is by the sign of weakness (SOW). The SOW is usually accompanied by significantly increased spread and volume to the downside that seem to break the standoff in phase B the SOW may or may not “fall through the ice,” but the subsequent rally back to a “last point of supply” (LPSY), is usually unconvincing for the bullish case and likely to be accompanied by less spread and/or volume.
Last point of supply gives you your last opportunity to exit any remaining longs and your first inviting opportunity to exit any remaining longs and your first inviting opportunity to take a short position. An even better place would be on the rally that tests LPSY, because it may give more evidence (diminished spread and volume) and/or a more tightly defined danger point.
An upthrust is the opposite of a spring. It is a price move above the resistance level of a trading range that quickly reverses itself and moves back into the trading range. An upthrust is a bull trap — it appears to signal a start of an uptrend but in reality marks the end of the up-move. The magnitude of the upthrust can be determined by the extent of the price move to new highs and the relative level of volume in that movement.
Phase C may also reveal itself by a pronounced move upward, breaking through the highs of the trading range. This is shown as an upthrust after distribution (UTAD). Like the terminal shakeout in the accumulation schematic, this gives a false impression of the direction of the market and allows further distribution at high prices to new buyers. It also results in weak holders of short positions surrendering their positions to stronger players just before the down-move begins. Should the move to new high ground be on increasing volume and relative narrowing spread, and price returns to the average level of closes of the TR, this would indicate lack of solid demand and confirm that the breakout to the upside did not indicate a TR of accumulation, but rather a formation of distribution.
Successful understanding and analysis of a trading range enables traders to identify special trading opportunities with potentially very favorable reward/risk parameters. When analyzing a trading range, we are first seeking to uncover what the law of supply and demand is revealing to us. However, when individual movements, rallies, or reactions are not revealing with respect to supply and demand, it is important to remember the law of effort versus result. By comparing rallies and reactions within the trading range to each other in terms of price spread, volume, and time, additional clues may be discovered as to the stock’s strength, position, and probable future course.
It will also be useful to employ the law of cause and effect. Within the dynamics of a trading range, the force of accumulation or distribution gives us the cause and the potential opportunity for substantial trading profits. The trading range will also give us the ability, with the use of point-and-figure charts, to project the extent of the eventual move out of the trading range and will help us determine if those trading opportunities favorably meet or exceed our reward/risk parameters.
Phase D: Phase D arrives and reveals itself after the tests in phase C show us the last gasps or the last hurrah of demand. In phase D, the evidence of supply becoming dominant increases either with a break through the ice or with a further SOW into the trading range after an upthrust.
In phase D, you are also given more evidence of the probable direction of the market and the opportunity to take your first or additional short positions. Your best opportunities are at rallies representing LPSYs before a markdown cycle begins. Your legging in of the set of positions taken within phases C and D represents a calculated approach to protect capital and maximize profit. It is important that additional short positions be added or pyramided only if your initial positions are in profit.
Phase E: Depicts the unfolding of the downtrend; the stock or commodity leaves the trading range and supply is in control. Rallies are usually feeble.
Wyckoff Distribution Events
PSY: Preliminary supply, where large interests begin to unload shares in quantity after a pronounced up-move. Volume expands and price spread widens, signaling that a change in trend may be approaching.
BC: Buying climax, during which there are often marked increases in volume and price spread. The force of buying reaches a climax, and heavy or urgent buying by the public is being filled by professional interests at prices near a top. A BC often occurs coincident with a great earnings report or other good news, since the large operators require huge demand from the public to sell their shares without depressing the stock price.
AR: Automatic reaction. With demand substantially diminished after the BC and heavy supply continuing, an AR takes place. The low of this selloff helps define the lower boundary of a distribution TR.
ST: Secondary test, in which price revisits the area of the BC to test the demand/supply balance at these price levels. If a top is to be confirmed, supply will outweigh demand, and volume and spread should decrease as price approaches the resistance area of the BC. A ST may take the form of an upthrust (UT), in which price moves above the resistance represented by the BC and possibly other STs, then quickly reverses to close below resistance. After a UT, price often tests the lower boundary of the TR.
SOW: Sign of weakness, observable as a down-move to (or slightly past) the lower boundary of the TR, usually occurring on increased spread and volume. The AR and the initial SOW(s) indicate a change of character in the price action of the stock: supply is now dominant.
LPSY: Last point of supply. After testing support on a SOW, a feeble rally on narrow spread shows that the market is having difficulty advancing. This inability to rally may be due to weak demand, substantial supply or both. LPSYs represent exhaustion of demand and the last waves of large operators’ distribution before markdown begins in earnest.
UTAD: Upthrust after distribution. A UTAD is the distributional counterpart to the spring and terminal shakeout in the accumulation TR. It occurs in the latter stages of the TR and provides a definitive test of new demand after a breakout above TR resistance. Analogous to springs and shakeouts, a UTAD is not a required structural element: the TR in Distribution.
AR - Automatic rally or reaction
BC - Buying Climax
BOI - Backing upto ice
BTI - Breaking the ice
BUEC - Backup to edge of creek
CREEK - Critical support
FTI - First time over ice
ICE - Critical resistance
JAC - Jumping across the creek (or JOC)
LPS - Last point of Support (Demand)
LPSY - Last point of Supply
MD - Mark down
MU - Mark up
PS - Preliminary support (Demand)
PSY - Preliminary supply
SOS - Sign of strength
SOW - sign of weakness
ST - Secondary test
TSO - Terminal shake out (Spring)
TUT - Terminal thrust
UTAD - Up thrust after distribution
SC - Selling Climax
TR - Trading Range
UT - Up thrust
Best regards
EXCAVO

WYCKOFF accumulation in process IIKeep an eye on the trading zone for a probably re-test at the spring event of the Wyckoff schematic.
If the re-test happens, we can go to LT and look for a long entry.
T1: the superior extreme of the range
T2: depends of the price action behavior. If it play out of the superior range we could look for another long entry. If the price re-enters in the range we wait for a short opportunity.

Wyckoff Method #2 Distribution Schematic
What is the Wyckoff Method? #2 Distribution Schematic
👇👇👇
I am waiting for this pattern to complete in November, before that anything can happen, the bear market is usually long and exhausting
I follow my analysis
1)
2)
I am waiting for this pattern to complete in November, before that anything can happen, the bear market is usually long and exhausting
I started posting less, quality is better than quantity.
If you have questions for me or ideas that you want to share, I'm waiting for you in the comments.
Best regards EXCAVO

WYCKOFF accumulation in processHT context: bearish to the target 0.83$
LT context: It needs to mitigate a daily supply zone before dropping again, in H1 we can see an accumulation schematic almost formed.
ENTRY 1: We can wait for a spring to clean up all the liquidity below the creek and then we can go long till the superior extreme of the range.
ENTRY 2: Wait for a retest after the JAC.

MONDAY OVERVIEW - Long Term and Intraday Setups on INDEX and AUDHi Traders,
This is my view for this week on:
- SPX500
- NAS100
- AUDUSD
- EURAUD
I remind you that this is only a forecast based on what current data are.
Therefore the following signal will be activated only if specific rules are strictly respected.
If you follow my strategy you will be able to identify the right filters and triggers to enter correctly the market and avoid fake signals.
I really hope you liked this video and I would like to know what do you think about this analysis, so please use the comment section below this video to give me your point of view.
Pit
DISCLAIMER:
Trading activity is very dangerous. All the contents, suggestions, strategies, videos, images, trade setups and forecast, everything you see on this website and are the result of my personal evaluations and was created for educational purposes only and not as an incentive to invest. Do not consider them as financial advice.
———————————
