Wyckoff method - lets see whats happns ok guys we still dont know where exactly spring is or when phase c , d , e will be created but when we locate the spring ... it will be so ez
Wyckoffmethod

Bitcoin 4H range. My thoughtsBitcoin has been consolidating inside of a range since the beginning of 2022. This range is showing obvious signs of a distribution phase (manipulated highs/higher highs).
Right now it seems like there are equal lows at around 37k ready to be wiped for liquidity. There is also a daily supply zone at 46-48k which I think price is very likely to tap for one more higher high before topping out and moving lower. Now whether 37k gets manipulated first or 46-48k I have no clue tbh but it makes more sense for it to move up to the daily supply before going down to tap the lows at 36k and later 30k. So if I had to choose, money is on 46-48k first then 37k. Now do with that information as you will, and as always, gl traders!
NOT FINANCIAL ADVICE!

Long BTC at Selling ClimaxPreviously, I’ve demonstrated stepping-stone descending horizontal Wyckoff re-distribution trading ranges for BTC. Interestingly, the last 3 transitions from Wyckoff re-distribution Phase E to Phase A were similar. In all 3 cases, we observed a climatic level of volume. In all 3 cases, we observed sell bars with a large spread. The percent change in price for these Phase E/Phase A transitions were -26.84%, -21.28%, and -24.98% in Dec 2021, Jan 2022, and May 2022, respectively. In all 3 cases, we observed a selling climax (SC), which serves the purpose of stopping the down trend, followed by an automatic rally (ARa). I expect that we will observe an ARa to the first area of important resistance, which is the open of the May 9 sell bar ($33,945).
I have opened a long position at $30,476 and I have a take profit target of $33,945, which is an 11.38% profit.
Significant bars, which help define important areas of support and resistance, are given by the blue shading. The blue arrows point to volume spikes.
Wyckoff abbreviations: automatic rally (ARa), selling climax (SC), secondary test (ST), upthrust (UT), failed upthrust (FUT), last point of supply (LPSY), shakeout (SO), sign of weakness (SOW), Phase A (Ph A), Phase B (Ph B), Phase C (Ph C), Phase D (Ph D), Phase E (Ph E).
This is not financial advice. I am not your financial advisor. This is my opinion.

LUNA/USDT Effort v. ResultBottoms are usually resultant from increased effort and less result. The current candle suggests that a bottom may be forming for a bounce at the least, if not a full reversal. We will need to see how the daily closes.

BTC/USD Wyckoff Accumulation Updated May 2022Let me start by saying this is not financial advice and this prediction is purely based Wyckoff Accumulation theory. Current Bearish sentiment and global financial state could change everything anytime so please DYOR before making investment decisions. Also please do not take the price point and timeline literally because this is a pattern prediction.
This prediction is based on assuming BTC has found some support at 30k or in this area which makes an ST in phase B. Based on this, BTC looks like forming the following Wykoff Auumulation patterns -
Schematics 1 - Green
Schematics 2 - Orange
According to Schematics 1 - Spring could be anywhere between 20k to 30k depending on market sentiment and assuming 30k is the ST in phase B.

BTC Short Near Trading Range SupportThis chart builds on previous ideas I’ve shared regarding the BTC price action since October, 2021. In a previous publication, I stated that we likely had observed a shakeout (SO)/sign of weakness (SOW) in potential Phase D of Wyckoff re-distribution. I presented a scenario that would confirm my idea (solid red line). According to this scenario, we would observe a last point of supply (LPSY) event followed by the price breaking the trading range support to the downside. I presented a scenario that would disconfirm my idea (solid green line). According to this scenario, we had observed a SO/Spring event, which would be followed by a sign of strength (SOS) rally. The price data from over the last 12 days seems to confirm my idea of stepping-stone BTC Wyckoff re-distribution.
Given the observation of a likely LPSY, we may open a short position near the trading range support (approximately $41,000) or at the present price. The take profit targets are at the next support levels; specifically, $37,400 (-5.4%), $33,700 (-14.4%), and $29,900 (-25.2%).
The upper and lower boundaries of the trading ranges are given by the solid black lines and black dotted line. Significant bars, which help define important areas of support and resistance, are given by the blue shading. The blue arrows point to volume spikes.
Wyckoff abbreviations: automatic rally (ARa), automatic reaction (ARe), buying climax (BC), secondary test (ST), upthrust (UT), failed upthrust (FUT), last point of supply (LPSY), shakeout (SO), sign of weakness (SO), Phase A (Ph A), Phase B (Ph B), Phase C (Ph C), Phase D (Ph D), Phase E (Ph E).
The Phoenix Ascending (PA) indicator by @WyckoffMode is given in the bottom panel. The projected path for the red relative strength index (RSI), blue least squared moving average (LMSA), and energy (E), are given by the red, blue, and grey dotted lines.
This is not financial advice. I am not your financial advisor. This is my opinion.

BTC/USD Triangle in play? variation #2As I've mentioned on my stream, a breakdown below the current wave C low at 32933.33 just invalidates that particular triangle. There is the possibility that another triangle could be printing in that scenario as shown in this chart. Wave C could still be in progress. However, it would need to reverse prior to the wave A support at 28800. Breaking down below that level will invalidate all the triangle scenarios.
This only becomes possible if price breaks down below 32933.33.

Wyckoff Logic Supply and Demand GBPUSD
Technical analysis
Cause, distribution, equilibrium sequence between demand and supply between quotas , supply zone 1.26179 & 1.24113 demand zone .
Supply greater than Demand!
Implications, bearish!
Pattern Rally base Drop!
Effect generated by approx
300 pips.
SL 1.25162
Entry 1.23318, sell!
TP 1.20000
⭕ = circle
⏹ = square
🔺️ = triangle
Unit = ⭕ market
Polarity = 🔺️demand & 🔻supply
Equilibrium = ⏹ range ("the ratio between supply and demand is =")
PRINCIPLE OF DEMAND AND SUPPLY
The law of supply and demand
- here the analysts study the relationship between supply and demand , having as a reference point the price and
volume over a period of time as shown on the chart.
KEY DEFINITION
The law of supply and demand is of the utmost importance. If the application to
buy an instrument (currency pairs, stocks, commodities , metals, bonds, cryptocurrencies)
is higher than the available supply, the only way the demand can be met is
for the price to rise to a level that attracts enough supply to match demand.
When this point is reached, the price does not advance. If the offer to sell is
higher than the demand to buy, the only way the supply will be absorbed is as
the price drops to a point that attracts enough demand to absorb all
the amount. When that happens, the price doesn't go down.

ETH/USD Triangle in play?Wyckoff and Elliott Wave analysis signals we may be seeing a triangle completing. This is the chart I've been discussing for quite a while in various public live streams on YouTube and Twitter.

EU breakdown + an IdeaHere we take a look at a few opportunities Thursday and Friday as well as give an idea of what might happen next, cheers

Wyckoff trading using the example of ADA/BTC Accumulation schemePay attention to the phases and letter designations on the graph that I showed on the ADA / BTC pair. (Cardano). A diagram of the accumulation phases is shown. Which are relevant for trading now. Several trading methods are combined on the chart:
1) Trading by the Wyckoff method.
2) Trade in horizontal channels.
3) Trade from important areas (price reversal points).
4) Trading in secondary local trends.
Now the price is at the important zone of the mirror level which, from the development of the situation, can act as support or resistance. Channel pitch 30%. You can work in two directions.
_________________________________
About Wyckoff's trading method.
The forerunner of volume analysis (VSA) is Richard Wyckoff. Roughly speaking, the whole point of the method can be expressed - trade for a major market player. The creator of this technique himself was a man who had a system-forming influence on stock trading. It was not a poor theorist who got rich after publishing books! He was a very successful trader and earned impressive capital in his day. The very method that he was allowed to achieve and the entire 40 years of experience in trading, he published in his book in the public domain is already closer to his death Wall Street Ventures and Adventures Through Forty Years. At the end of his life's journey, Wyckoff became more altruistic, and decided to share the knowledge that led him to wealth. He died in 1934.
The Wyckoff trading method was developed in the early 1930s. It consists of a number of principles and strategies originally developed for traders and investors. Wyckoff devoted much of his life experience to studying market behavior, and his work still has an impact on much of modern technical analysis (TA). Currently, the Wyckoff method is applied to all types of financial markets, although initially it was focused only on stocks.
During the creation of his work, Wyckoff was inspired by the trading methods of other successful traders (especially Jesse Livermore). Today, he enjoys the same respect as other key figures such as Charles Dow and Ralph Nelson Elliott. But for example, unlike Elliot’s theory, which is good in theory, but not always applicable in practice, the Wyckoff method is many times more effective for making money not in theory, but in practice.
_________________________________________
According to Richard Wyckoff's trading method, there are 3 laws:
1) The law of supply and demand.
2) The law of causation.
3) The law of communication efforts and results.
The first law states that the value of assets begins to rise when demand exceeds supply, and accordingly falls in the reverse order. This is one of the most basic principles in the financial markets, which does not exclude Wyckoff in his work.
We can represent the first law in the form of three simple equations:
1) Demand> supply = price increases.
2) Demand <offer = price falls.
3) Demand = supply = no significant price change (low volatility).
The second law states that the differences between supply and demand are not a coincidence. Instead, they reflect preparatory actions resulting from certain events. In Wyckoff's terminology, the accumulation period (cause) ultimately leads to an uptrend (consequence). In turn, the distribution period (cause) provokes the development of a downtrend (consequence).
Wyckoff’s third law states that price changes are the result of common efforts that are displayed on the trading volume. In the case when the growth in the value of the asset corresponds to a high volume of trading, there is a high probability that the trend will continue to move. But if volumes are too small at a high price, growth is likely to stop and the trend may change direction.
_____________________________________
Wyckoff Price Cycles.
According to Wyckoff, the market can be understood and predicted using a detailed analysis of supply and demand. This can be done based on price action, volume and timeframe. By observing the behavior of large groups of investors, Wyckoff was able to learn to notice certain points during which preparations were made before a large price move. These moments were called accumulation (before the upward movement of prices) and distribution (before the fall of prices).
_____________________________________
“Composite person” (major player) and phases.
Wyckoff created the idea of a “composite man” (from the English composite man, composite operator), which embodies the imaginary personality of the market. He invited all investors and traders to study the stock market from the point of view if it were controlled by one subject, as this could facilitate their further following the trends.
At its core, the composite person represents the largest players (market makers), wealthy people and institutional investors. The behavior of a composite person is the opposite of most investors and traders that Wyckoff often observed, given their financial losses. This is the opposite of crowd action.
The cycle described in the Wyckoff method consists of four main phases:
1) Accumulation (accumulation).
2) Impulse or uptrend.
3) Distribution.
4) Markdown (correction, downtrend).
1 phase. Accumulation .
A composite person accumulates assets before most investors and traders begin to do so. This phase is usually marked by lateral movement. Accumulation occurs in a gradual manner to avoid significant price changes.
2 phase. Impulse or uptrend.
When a composite person takes possession of a sufficient amount of assets, while the sales force is depleted, he begins to push the market upward, forming an emerging trend that gradually attracts more and more new investors, which subsequently leads to an increase in demand.
3 phase. Distribution.
Then the “composite person” distributes the purchased assets. He begins to sell his profitable positions to those who enter the market at a late stage (“hamsters”).
4 phase. Markdown (correction, downtrend).
Shortly after the distribution phase, the market begins to fall. In other words, after the composite person has completed the sale of a significant amount of his position, he begins to push the market down. To repeat the cycle again. The hamster is not a mammoth - it will not die out. In the end, supply becomes much larger than demand, and a downtrend will follow.
_________________________________________
Approach to the Wyckoff market in five steps.
Wyckoff also developed a five-step approach to the market based on numerous principles and methods. Simply put, such an approach can be considered as the procedure for applying his work in practice.
S tep one: identify the current trend.
The primary task is to determine the current trend and a superficial assumption where and how far it can go, in connection with which the following questions arise: "what is the current trend?", "What is the relationship between supply and demand?".
Step two: determine the strength of the asset.
How strong is the asset in relation to the market? Does its value move with the market or the opposite of it?
Step three: find an asset with a reason for further growth.
Are there enough reasons to open a position? Is the reason good enough for the potential benefit (consequence) to justify the possible risks in the future?
Fourth step: determine the likelihood of cost increases.
Is the asset ready for the intended move? What is its position relative to the current trend? Does the price and volume of trades correspond to possible growth? This step often includes Wyckoff tests for the purchase and sale of the selected asset.
Step Five: Your Login Time.
The last step contains all the timing information. For the most part, this is due to the analysis of a trading instrument to compare their behavior with the main market. In cryptocurrency, for example, with bitcoin.
__________________________________________
Wyckoff Trading Schemes.
Accumulation and distribution schemes are the most popular part of Wyckoff’s work, at least among cryptocurrency communities. This model breaks down these two schemes into smaller sections of five phases (from A to E), as well as several events that are briefly described below.
Pay attention to the phases and letter designations on the graph that I showed on the ADA / BTC pair. A diagram of the accumulation phases is shown. Which are relevant for trading now
ACCUMULATION DIAGRAM
PS - preliminary support (initial support) the first resistance - appears after a significant decrease in the price, the volume increases, and the price accelerates the decrease over time.
SC - the culmination of sales - there is a sharp drop in prices for large volumes.
AR - automatic rally (automatic upward movement) appears because there are very few sellers in the market, and buyers quickly raise the price up.
ST- secondary test (repeated test) - occurs to check the forces of supply and demand. There may be several ST and SC. ST can even slightly break the price level set by SC.
Spring ("Spring") - does not always occur, in the late stages of accumulation. The logic of false breakdown.
Test - Occurs after Spring is formed and should be on a small volume. Usually above the low at a lower level.
SOS - a sign of strength (signs of strength) the price begins to rise and stands out from the price range TR (trading range) with an increased volume.
LPS - the last support point, the last resistance level, occurs after a breakdown (SOS), this is a return of prices in the vicinity of TR with low volume and low price dynamics.
BU (back up) - the return of prices to the accumulation channel, which follows the realization of the profit of short-term investors and is a demand test. It does not always happen, for obvious reasons.
Phase A.
The strength of sales decreases and the downtrend begins to slow down. This stage is usually marked by an increase in trading volume. Preliminary support (from the English preliminary support, abbr. PS) indicates that new customers are starting to appear, but this is still not enough to stop the downward movement.
The culmination of sales (from the English selling climax, abbr. SC) is formed through intense activity aimed at selling assets, as a result of which investors begin to capitulate. This often manifests itself as the highest point of volatility, when panic sales form high candles and wicks. A strong drop quickly develops into a jump or automatic rally (AR), due to the fact that buyers begin to absorb excess supply. Thus, the trading range (TR) of the accumulation scheme is determined as the distance between the minimum culmination of sales and the maximum of automatic rally.
A secondary test (ST) occurs when a drop in market prices crosses the sales climax (SC) to verify the validity of a downtrend. In this case, trading volume and market volatility are usually lower than usual. While the second test often forms a higher minimum relative to the culmination of sales, this does not always happen according to plan.
Phase B.
Based on the Wyckoff law of causation, phase B can be considered as a cause that leads to a certain effect.
Phase B is the consolidation phase in which a composite person accumulates the largest amount of assets. At this stage, the market tends to test various levels of resistance and support in the area of its trading range.
Numerous secondary tests (STs) may occur during phase B. In some cases, they show higher highs (bull traps) and lows (bear traps) with respect to the culmination of sales and the automatic rally, like phase A.
Phase C.
This phase is a typical period of asset accumulation. It is often the last bear trap before the market begins to show higher lows. During phase C, the composite person provides a small proposal, and in fact, those who were supposed to sell their assets have already done so.
During this phase, support levels begin to break through to stop traders and mislead investors. We can describe this as the last attempt to buy an asset at a lower price before the start of an uptrend. Thus, the bear trap encourages small investors to abandon the holding of their assets.
However, in some cases, support levels can be maintained, and the "spring" simply does not begin. In other words, there may be another accumulation scheme, which includes slightly different elements, but not “spring”. However, the overall structure of the circuit remains valid.
Phase D.
Phase D represents the transition between cause and effect. It is located between the accumulation zone (phase C) and the breakout of the trading range (phase E).
Typically, a significant increase in trading volume and volatility occurs during phase D. Usually it assumes the last point of support (from the English last point support, abbr. LPS), demonstrating a lower minimum before the market begins to move up. LPS often precedes breakthrough resistance levels, which in turn creates higher highs. This indicates the manifestation of signs of strength (from the English. Signs of strength, abbr. SOS), as the previous resistance levels become new levels of support.
Despite a somewhat confusing terminology, there may be several last points of support during this phase. They often increase trading volume when testing new zones. In some cases, the price may create a small consolidation zone before effectively breaking through a larger trading range and moving on to phase E.
Phase E.
Phase E is the last step in the accumulation pattern. It is marked by a clear penetration of the trading range due to increased demand in the market, which indicates the beginning of an uptrend.
__________________________________________
Volume in separate phases (VSA).
A key element in the analysis of the Wyckoff method is the preservation of volume at the individual stages of accumulation / distribution.
Phase A.
In this phase, dynamic movements of prices with an increased volume occur. We have new highs / lows and climax points, followed by automatic price rallies in the opposite direction, and then retest on a smaller volume. This phase forms the border of the TR (trading range) channel, in which the price will consolidate until the rebound in phase D and E
Stage B.
Here, large investors get rid of their last position from the previous trend and prepare for its reversal.
Phase C.
This is a very important phase, because in phase C it comes to the end of the current trend. Weak players leave the market for Spring (accumulation) or UTAD (distribution). If these formations do not exist, then we are dealing with LPS, where the inability to continue the current trend is visible, the price practically does not move.
Phase D.
With signs of weakness in the current trend from phase C, the time comes to show the strength of the adversary. The price breaks the level in the expected direction, with high dynamics and increased volume.
Phase E.
Confirmation of our assumptions and completion of the accumulation / distribution process. Price accelerates in the expected direction. If we were unable to join the movement during phase D, then further problems may already arise with this. And this deal will be less profitable.
______________________________
Conclusion on the Wyckoff trading method.
Almost a hundred years have passed since the publication of the work, but the Wyckoff method is still in demand to this day. By nature, the market does not always exactly follow similar trading patterns. In practice, accumulation and distribution patterns can occur in different ways. For example, in some cases, phase B can last much longer than expected. For this reason, spring, UTAD and other tests may simply be absent.
However, Wyckoff's work offers a wide range of reliable trading techniques that are based on numerous theories and principles. His work is certainly valuable to thousands of investors, traders and analysts around the world. The accumulation and distribution schemes described in this article may be suitable for understanding the general order of cycles in financial markets.
But recently, due to the widespread introduction of algorithmic trading and the use of it by large players, it has become increasingly difficult to notice a large player on highly liquid instruments, but it is possible. According to three schemes of dialing / resetting by the position algorithm.
This analysis method is more relevant for medium-liquid instruments, where fewer algorithms and highly professional traders are clearly hard to see. One person can hide his real work, and do fake trade for dozens of people. It is clear that with good preparation, it is possible to calculate and understand what will happen next, but naturally this is not an analysis of the schedule. Analysis of the schedule in the work of a truly successful trader in fact takes no more than 20-30% of the work.
__________________________________
It is impossible to describe everything in one article. The Wyckoff method at first glance seems complicated, but it is not. The main thing is to understand the essence of the work and practice trading tools. To start, start trading with a symbolic amount.
Always remember, a theory without practice is zero.
Once again, the Wyckoff method works well on medium-liquid instruments such as cryptocurrencies, but not lower than the top 100.

Wyckoff trading using the example of ADA/BTC Accumulation schemePay attention to the phases and letter designations on the graph that I showed on the ADA / BTC pair. (Cardano). A diagram of the accumulation phases is shown. Which are relevant for trading now. Several trading methods are combined on the chart:
1) Trading by the Wyckoff method.
2) Trade in horizontal channels.
3) Trade from important areas (price reversal points).
4) Trading in secondary local trends.
Now the price is at the important zone of the mirror level which, from the development of the situation, can act as support or resistance. Channel pitch 30%. You can work in two directions.
_________________________________
About Wyckoff's trading method.
The forerunner of volume analysis (VSA) is Richard Wyckoff. Roughly speaking, the whole point of the method can be expressed - trade for a major market player. The creator of this technique himself was a man who had a system-forming influence on stock trading. It was not a poor theorist who got rich after publishing books! He was a very successful trader and earned impressive capital in his day. The very method that he was allowed to achieve and the entire 40 years of experience in trading, he published in his book in the public domain is already closer to his death Wall Street Ventures and Adventures Through Forty Years. At the end of his life's journey, Wyckoff became more altruistic, and decided to share the knowledge that led him to wealth. He died in 1934.
The Wyckoff trading method was developed in the early 1930s. It consists of a number of principles and strategies originally developed for traders and investors. Wyckoff devoted much of his life experience to studying market behavior, and his work still has an impact on much of modern technical analysis (TA). Currently, the Wyckoff method is applied to all types of financial markets, although initially it was focused only on stocks.
During the creation of his work, Wyckoff was inspired by the trading methods of other successful traders (especially Jesse Livermore). Today, he enjoys the same respect as other key figures such as Charles Dow and Ralph Nelson Elliott . But for example, unlike Elliot’s theory, which is good in theory, but not always applicable in practice, the Wyckoff method is many times more effective for making money not in theory, but in practice.
_________________________________________
According to Richard Wyckoff's trading method, there are 3 laws:
1) The law of supply and demand .
2) The law of causation.
3) The law of communication efforts and results.
The first law states that the value of assets begins to rise when demand exceeds supply, and accordingly falls in the reverse order. This is one of the most basic principles in the financial markets, which does not exclude Wyckoff in his work.
We can represent the first law in the form of three simple equations:
1) Demand> supply = price increases.
2) Demand <offer = price falls.
3) Demand = supply = no significant price change (low volatility ).
The second law states that the differences between supply and demand are not a coincidence. Instead, they reflect preparatory actions resulting from certain events. In Wyckoff's terminology, the accumulation period (cause) ultimately leads to an uptrend (consequence). In turn, the distribution period (cause) provokes the development of a downtrend (consequence).
Wyckoff’s third law states that price changes are the result of common efforts that are displayed on the trading volume . In the case when the growth in the value of the asset corresponds to a high volume of trading, there is a high probability that the trend will continue to move. But if volumes are too small at a high price, growth is likely to stop and the trend may change direction.
_____________________________________
Wyckoff Price Cycles.
According to Wyckoff, the market can be understood and predicted using a detailed analysis of supply and demand . This can be done based on price action, volume and timeframe. By observing the behavior of large groups of investors, Wyckoff was able to learn to notice certain points during which preparations were made before a large price move. These moments were called accumulation (before the upward movement of prices) and distribution (before the fall of prices).
_____________________________________
“Composite person” (major player) and phases.
Wyckoff created the idea of a “composite man” (from the English composite man, composite operator), which embodies the imaginary personality of the market. He invited all investors and traders to study the stock market from the point of view if it were controlled by one subject, as this could facilitate their further following the trends.
At its core, the composite person represents the largest players (market makers), wealthy people and institutional investors. The behavior of a composite person is the opposite of most investors and traders that Wyckoff often observed, given their financial losses. This is the opposite of crowd action.
The cycle described in the Wyckoff method consists of four main phases:
1) Accumulation (accumulation).
2) Impulse or uptrend.
3) Distribution.
4) Markdown (correction, downtrend).
1 phase. Accumulation.
A composite person accumulates assets before most investors and traders begin to do so. This phase is usually marked by lateral movement. Accumulation occurs in a gradual manner to avoid significant price changes.
2 phase. Impulse or uptrend.
When a composite person takes possession of a sufficient amount of assets, while the sales force is depleted, he begins to push the market upward, forming an emerging trend that gradually attracts more and more new investors, which subsequently leads to an increase in demand.
3 phase. Distribution.
Then the “composite person” distributes the purchased assets. He begins to sell his profitable positions to those who enter the market at a late stage (“hamsters”).
4 phase. Markdown (correction, downtrend).
Shortly after the distribution phase, the market begins to fall. In other words, after the composite person has completed the sale of a significant amount of his position, he begins to push the market down. To repeat the cycle again. The hamster is not a mammoth - it will not die out. In the end, supply becomes much larger than demand, and a downtrend will follow.
_________________________________________
Approach to the Wyckoff market in five steps.
Wyckoff also developed a five-step approach to the market based on numerous principles and methods. Simply put, such an approach can be considered as the procedure for applying his work in practice.
Step one: identify the current trend.
The primary task is to determine the current trend and a superficial assumption where and how far it can go, in connection with which the following questions arise: "what is the current trend?", "What is the relationship between supply and demand?".
Step two: determine the strength of the asset.
How strong is the asset in relation to the market? Does its value move with the market or the opposite of it?
Step three: find an asset with a reason for further growth.
Are there enough reasons to open a position? Is the reason good enough for the potential benefit (consequence) to justify the possible risks in the future?
Fourth step: determine the likelihood of cost increases.
Is the asset ready for the intended move? What is its position relative to the current trend? Does the price and volume of trades correspond to possible growth? This step often includes Wyckoff tests for the purchase and sale of the selected asset.
Step Five: Your Login Time.
The last step contains all the timing information. For the most part, this is due to the analysis of a trading instrument to compare their behavior with the main market. In cryptocurrency, for example, with bitcoin .
__________________________________________
Wyckoff Trading Schemes.
Accumulation and distribution schemes are the most popular part of Wyckoff’s work, at least among cryptocurrency communities. This model breaks down these two schemes into smaller sections of five phases (from A to E), as well as several events that are briefly described below.
Pay attention to the phases and letter designations on the graph that I showed on the ADA / BTC pair. A diagram of the accumulation phases is shown. Which are relevant for trading now
ACCUMULATION DIAGRAM
PS - preliminary support (initial support) the first resistance - appears after a significant decrease in the price, the volume increases, and the price accelerates the decrease over time.
SC - the culmination of sales - there is a sharp drop in prices for large volumes.
AR - automatic rally (automatic upward movement) appears because there are very few sellers in the market, and buyers quickly raise the price up.
ST- secondary test (repeated test) - occurs to check the forces of supply and demand . There may be several ST and SC . ST can even slightly break the price level set by SC .
Spring - does not always occur, in the late stages of accumulation. The logic of false breakdown.
Test - Occurs after Spring is formed and should be on a small volume . Usually above the low at a lower level.
SOS - a sign of strength (signs of strength) the price begins to rise and stands out from the price range TR (trading range) with an increased volume .
LPS - the last support point, the last resistance level , occurs after a breakdown (SOS), this is a return of prices in the vicinity of TR with low volume and low price dynamics.
BU (back up) - the return of prices to the accumulation channel, which follows the realization of the profit of short-term investors and is a demand test. It does not always happen, for obvious reasons.
Phase A.
The strength of sales decreases and the downtrend begins to slow down. This stage is usually marked by an increase in trading volume . Preliminary support (from the English preliminary support, abbr. PS) indicates that new customers are starting to appear, but this is still not enough to stop the downward movement.
The culmination of sales (from the English selling climax, abbr. SC ) is formed through intense activity aimed at selling assets, as a result of which investors begin to capitulate. This often manifests itself as the highest point of volatility , when panic sales form high candles and wicks. A strong drop quickly develops into a jump or automatic rally (AR), due to the fact that buyers begin to absorb excess supply. Thus, the trading range ( TR ) of the accumulation scheme is determined as the distance between the minimum culmination of sales and the maximum of automatic rally.
A secondary test ( ST ) occurs when a drop in market prices crosses the sales climax ( SC ) to verify the validity of a downtrend. In this case, trading volume and market volatility are usually lower than usual. While the second test often forms a higher minimum relative to the culmination of sales, this does not always happen according to plan.
Phase B.
Based on the Wyckoff law of causation, phase B can be considered as a cause that leads to a certain effect.
Phase B is the consolidation phase in which a composite person accumulates the largest amount of assets. At this stage, the market tends to test various levels of resistance and support in the area of its trading range.
Numerous secondary tests ( STs ) may occur during phase B. In some cases, they show higher highs (bull traps) and lows (bear traps) with respect to the culmination of sales and the automatic rally, like phase A.
Phase C.
This phase is a typical period of asset accumulation. It is often the last bear trap before the market begins to show higher lows. During phase C, the composite person provides a small proposal, and in fact, those who were supposed to sell their assets have already done so.
During this phase, support levels begin to break through to stop traders and mislead investors. We can describe this as the last attempt to buy an asset at a lower price before the start of an uptrend. Thus, the bear trap encourages small investors to abandon the holding of their assets.
However, in some cases, support levels can be maintained, and the "spring" simply does not begin. In other words, there may be another accumulation scheme, which includes slightly different elements, but not “spring”. However, the overall structure of the circuit remains valid.
Phase D.
Phase D represents the transition between cause and effect. It is located between the accumulation zone (phase C) and the breakout of the trading range (phase E).
Typically, a significant increase in trading volume and volatility occurs during phase D. Usually it assumes the last point of support (from the English last point support, abbr. LPS ), demonstrating a lower minimum before the market begins to move up. LPS often precedes breakthrough resistance levels, which in turn creates higher highs. This indicates the manifestation of signs of strength (from the English. Signs of strength, abbr. SOS), as the previous resistance levels become new levels of support.
Despite a somewhat confusing terminology, there may be several last points of support during this phase. They often increase trading volume when testing new zones. In some cases, the price may create a small consolidation zone before effectively breaking through a larger trading range and moving on to phase E.
Phase E.
Phase E is the last step in the accumulation pattern. It is marked by a clear penetration of the trading range due to increased demand in the market, which indicates the beginning of an uptrend.
__________________________________________
Volume in separate phases (VSA).
A key element in the analysis of the Wyckoff method is the preservation of volume at the individual stages of accumulation / distribution.
Phase A.
In this phase, dynamic movements of prices with an increased volume occur. We have new highs / lows and climax points, followed by automatic price rallies in the opposite direction, and then retest on a smaller volume . This phase forms the border of the TR (trading range) channel, in which the price will consolidate until the rebound in phase D and E
Stage B.
Here, large investors get rid of their last position from the previous trend and prepare for its reversal.
Phase C.
This is a very important phase, because in phase C it comes to the end of the current trend. Weak players leave the market for Spring (accumulation) or UTAD (distribution). If these formations do not exist, then we are dealing with LPS , where the inability to continue the current trend is visible, the price practically does not move.
Phase D.
With signs of weakness in the current trend from phase C, the time comes to show the strength of the adversary. The price breaks the level in the expected direction, with high dynamics and increased volume .
Phase E.
Confirmation of our assumptions and completion of the accumulation / distribution process. Price accelerates in the expected direction. If we were unable to join the movement during phase D, then further problems may already arise with this. And this deal will be less profitable.
______________________________
Conclusion on the Wyckoff trading method.
Almost a hundred years have passed since the publication of the work, but the Wyckoff method is still in demand to this day. By nature, the market does not always exactly follow similar trading patterns. In practice, accumulation and distribution patterns can occur in different ways. For example, in some cases, phase B can last much longer than expected. For this reason, spring, UTAD and other tests may simply be absent.
However, Wyckoff's work offers a wide range of reliable trading techniques that are based on numerous theories and principles. His work is certainly valuable to thousands of investors, traders and analysts around the world. The accumulation and distribution schemes described in this article may be suitable for understanding the general order of cycles in financial markets.
But recently, due to the widespread introduction of algorithmic trading and the use of it by large players, it has become increasingly difficult to notice a large player on highly liquid instruments, but it is possible. According to three schemes of dialing / resetting by the position algorithm.
This analysis method is more relevant for medium-liquid instruments, where fewer algorithms and highly professional traders are clearly hard to see. One person can hide his real work, and do fake trade for dozens of people. It is clear that with good preparation, it is possible to calculate and understand what will happen next, but naturally this is not an analysis of the schedule. Analysis of the schedule in the work of a truly successful trader in fact takes no more than 20-30% of the work.
__________________________________
It is impossible to describe everything in one article. The Wyckoff method at first glance seems complicated, but it is not. The main thing is to understand the essence of the work and practice trading tools. To start, start trading with a symbolic amount.
Always remember, a theory without practice is zero.
Once again, the Wyckoff method works well on medium-liquid instruments such as cryptocurrencies, but not lower than the top 100.

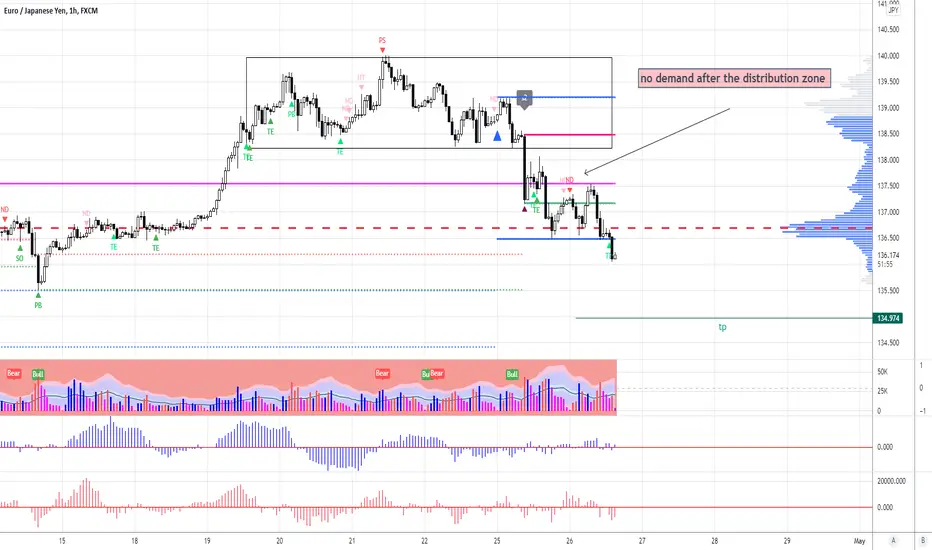
eurjpyno demand after the distribution zone
after the distribution zone we see a check of the herd on the rise in the form of no demand
Eurjpy An example of my dealAn example of my deal
When the euro was well caught against the dollar on the lack of demand in the liquidity zone

US30 wyckoff analiseAccumulation zone at 12 o'clock
The price is in the high volume bar zone
Spring at 12 o'clock
Phase C Accumulation Confirmation
Looking for entry point

Basic of WyckoffWhat is the Wyckoff Method?
The Wyckoff Method was developed by Richard Wyckoff in the early 1930s. It consists of a series of principles and strategies initially designed for traders and investors. Wyckoff dedicated a significant part of his life teaching, and his work impacts much of modern technical analysis (TA). While the Wyckoff Method was originally focused on stocks, it is now applied to all sorts of financial markets.
A lot of Wyckoff’s work was inspired by the trading methods of other successful traders (especially Jesse L. Livermore). Today, Wyckoff is held in the same high regard as other key figures, such as Charles H. Dow, and Ralph N. Elliott.
Wyckoff did extensive research, which led to the creation of several theories and trading techniques. This article gives an overview of his work. The discussion includes:
Three fundamental laws;
The Composite Man concept;
A methodology for analyzing charts (Wyckoff’s Schematics);
A five-step approach to the market.
Wyckoff also developed specific Buying and Selling Tests, as well as a unique charting method based on Point and Figure (P&F) charts. While the tests help traders spot better entries, the P&F method is used to define trading targets. However, this article won’t dive into these two topics.
The three laws of Wyckoff
The Law of Supply and Demand
The first law states that prices rise when demand is greater than supply, and drop when the opposite is true. This is one of the most basic principles of financial markets and is certainly not exclusive to Wyckoff’s work. We may represent the first law with three simple equations:
Demand > Supply = Price rises
Demand < Supply = Price drops
Demand = Supply = No significant price change (low volatility)
In other words, the first Wyckoff law suggests that an excess of demand over supply causes prices to go up because there are more people buying than selling. But, in a situation where there is more selling than buying, the supply exceeds demand, causing the price to drop.
Many investors who follow the Wyckoff Method compare price action and volume bars as a way to better visualize the relation between supply and demand. This often provides insights into the next market movements.
The Law of Cause and Effect
The second law states that the differences between supply and demand are not random. Instead, they come after periods of preparation, as a result of specific events. In Wyckoff's terms, a period of accumulation (cause) eventually leads to an uptrend (effect). In contrast, a period of distribution (cause) eventually results in a downtrend (effect).
Wyckoff applied a unique charting technique to estimate the potential effects of a cause. In other terms, he created methods of defining trading targets based on the periods of accumulation and distribution. This allowed him to estimate the probable extension of a market trend after breaking out of a consolidation zone or trading range (TR).
The Law of Effort vs. Result
The third Wyckoff law states that the changes in an asset’s price are a result of an effort, which is represented by the trading volume. If the price action is in harmony with the volume, there is a good chance the trend will continue. But, if the volume and price diverge significantly, the market trend is likely to stop or change direction.
For instance, imagine that the Bitcoin market starts to consolidate with a very high volume after a long bearish trend. The high volume indicates a big effort, but the sideways movement (low volatility) suggests a small result. So, there is a lot of Bitcoins changing hands, but no more significant price drops. Such a situation could indicate that the downtrend may be over, and a reversal is near.
The Composite Man
Wyckoff created the idea of the Composite Man (or Composite Operator) as an imaginary identity of the market. He proposed that investors and traders should study the stock market as if a single entity was controlling it. This would make it easier for them to go along the market trends.
In essence, the Composite Man represents the biggest players (market makers), such as wealthy individuals and institutional investors. It always acts in his own best interest to ensure he can buy low and sell high.
The Composite Man’s behavior is the opposite of the majority of retail investors, which Wyckoff often observed losing money. But according to Wyckoff, the Composite Man uses a somewhat predictable strategy, from which investors can learn from.
Let’s use the Composite Man concept to illustrate a simplified market cycle. Such a cycle consists of four main phases: accumulation, uptrend, distribution, and downtrend.
Accumulation
The Composite Man accumulates assets before most investors. This phase is usually marked by a sideways movement. The accumulation is done gradually to avoid the price from changing significantly.
Uptrend
When the Composite Man is holding enough shares, and the selling force is depleted, he starts pushing the market up. Naturally, the emerging trend attracts more investors, causing demand to increase.
Notably, there may be multiple phases of accumulation during an uptrend. We may call them re-accumulation phases, where the bigger trend stops and consolidates for a while, before continuing its upward movement.
As the market moves up, other investors are encouraged to buy. Eventually, even the general public become excited enough to get involved. At this point, demand is excessively higher than supply.
Distribution
Next, the Composite Man starts distributing his holdings. He sells his profitable positions to those entering the market at a late stage. Typically, the distribution phase is marked by a sideways movement that absorbs demand until it gets exhausted.
Downtrend
Soon after the distribution phase, the market starts reverting to the downside. In other words, after the Composite Man is done selling a good amount of his shares, he starts pushing the market down. Eventually, the supply becomes much greater than demand, and the downtrend is established.
Similar to the uptrend, the downtrend may also have re-distribution phases. These are basically short-term consolidation between big price drops. They may also include Dead Cat Bounces or the so-called bull traps, where some buyers get trapped, hoping for a trend reversal that doesn’t happen. When the bearish trend is finally over, a new accumulation phase begins.
Wyckoff’s Schematics
The Accumulation and Distribution Schematics are likely the most popular part of Wyckoff’s work - at least within the cryptocurrency community. These models break down the Accumulation and Distribution phases into smaller sections. The sections are divided into five Phases (A to E), along with multiple Wyckoff Events, which are briefly described below.
Accumulation Schematic
Wyckoff method accumulation schematic
Phase A
The selling force decreases, and the downtrend starts to slow down. This phase is usually marked by an increase in trading volume. The Preliminary Support (PS) indicates that some buyers are showing up, but still not enough to stop the downward move.
The Selling Climax (SC) is formed by an intense selling activity as investors capitulate. This is often a point of high volatility, where panic selling creates big candlesticks and wicks. The strong drop quickly reverts into a bounce or Automatic Rally (AR), as the excessive supply is absorbed by the buyers. In general, the trading range (TR) of an Accumulation Schematic is defined by the space between the SC low and the AR high.
As the name suggests, the Secondary Test (ST) happens when the market drops near the SC region, testing whether the downtrend is really over or not. At this point, the trading volume and market volatility tend to be lower. While the ST often forms a higher low in relation to the SC, that may not always be the case.
Phase B
Based on Wyckoff’s Law of Cause and Effect, Phase B may be seen as the Cause that leads to an Effect.
Essentially, Phase B is the consolidation stage, in which the Composite Man accumulates the highest number of assets. During this stage, the market tends to test both resistance and support levels of the trading range.
There may be numerous Secondary Tests (ST) during Phase B. In some cases, they may produce higher highs (bull traps) and lower lows (bear traps) in relation to the SC and AR of the Phase A.
Phase C
A typical Accumulation Phase C contains what is called a Spring. It often acts as the last bear trap before the market starts making higher lows. During Phase C, the Composite Man ensures that there is little supply left in the market, i.e., the ones that were to sell already did.
The Spring often breaks the support levels to stop out traders and mislead investors. We may describe it as a final attempt to buy shares at a lower price before the uptrend starts. The bear trap induces retail investors to give up their holdings.
In some cases, however, the support levels manage to hold, and the Spring simply does not occur. In other words, there may be Accumulation Schematics that present all other elements but not the Spring. Still, the overall scheme continues to be valid.
Phase D
The Phase D represents the transition between the Cause and Effect. It stands between the Accumulation zone (Phase C) and the breakout of the trading range (Phase E).
Typically, the Phase D shows a significant increase in trading volume and volatility. It usually has a Last Point Support (LPS), making a higher low before the market moves higher. The LPS often precedes a breakout of the resistance levels, which in turn creates higher highs. This indicates Signs of Strength (SOS), as previous resistances become brand new supports.
Despite the somewhat confusing terminology, there may be more than one LPS during Phase D. They often have increased trading volume while testing the new support lines. In some cases, the price may create a small consolidation zone before effectively breaking the bigger trading range and moving to Phase E.
Phase E
The Phase E is the last stage of an Accumulation Schematic. It is marked by an evident breakout of the trading range, caused by increased market demand. This is when the trading range is effectively broken, and the uptrend starts.
Distribution Schematic
In essence, the Distribution Schematics works in the opposite way of the Accumulation, but with slightly different terminology.
Wyckoff method distribution schematic
Phase A
The first phase occurs when an established uptrend starts to slow down due to decreasing demand. The Preliminary Supply (PSY) suggests that the selling force is showing up, although still not strong enough to stop the upward movement. The Buying Climax (BC) is then formed by an intense buying activity. This is usually caused by inexperienced traders that buy out of emotions.
Next, the strong move up causes an Automatic Reaction (AR), as the excessive demand is absorbed by the market makers. In other words, the Composite Man starts distributing his holdings to the late buyers. The Secondary Test (ST) occurs when the market revisits the BC region, often forming a lower high.
Phase B
The Phase B of a Distribution acts as the consolidation zone (Cause) that precedes a downtrend (Effect). During this phase, the Composite Man gradually sells his assets, absorbing and weakening market demand.
Usually, the upper and lower bands of the trading range are tested multiple times, which may include short-term bear and bull traps. Sometimes, the market will move above the resistance level created by the BC, resulting in an ST that can also be called an Upthrust (UT).
Phase C
In some cases, the market will present one last bull trap after the consolidation period. It’s called UTAD or Upthrust After Distribution. It is, basically, the opposite of an Accumulation Spring.
Phase D
The Phase D of a Distribution is pretty much a mirror image of the Accumulation one. It usually has a Last Point of Supply (LPSY) in the middle of the range, creating a lower high. From this point, new LPSYs are created - either around or below the support zone. An evident Sign of Weakness (SOW) appears when the market breaks below the support lines.
Phase E
The last stage of a Distribution marks the beginning of a downtrend, with an evident break below the trading range, caused by a strong dominance of supply over demand.
Does the Wyckoff Method work?
Naturally, the market doesn’t always follow these models accurately. In practice, the Accumulation and Distribution Schematics can occur in varying ways. For example, some situations may have a Phase B lasting much longer than expected. Or else, the Spring and UTAD Tests may be totally absent.
Still, Wyckoff’s work offers a wide range of reliable techniques, which are based on his many theories and principles. His work is certainly valuable to thousands of investors, traders, and analysts worldwide. For instance, the Accumulation and Distribution schematics may come handy when trying to understand the common cycles of financial markets.
Wyckoff’s five-step approach
Wyckoff also developed a five-step approach to the market, which was based on his many principles and techniques. In short, this approach may be seen as a way to put his teaching into practice.
Step 1: Determine the trend.
What is the current trend and where it is likely to go? How is the relation between supply and demand?
Step 2: Determine the asset’s strength.
How strong is the asset in relation to the market? Are they moving in a similar or opposite fashion?
Step 3: Look for assets with sufficient Cause.
Are there enough reasons to enter a position? Is the Cause strong enough that makes the potential rewards (Effect) worth the risks?
Step 4: Determine how likely is the move.
Is the asset ready to move? What is its position within the bigger trend? What do the price and volume suggest? This step often involves the use of Wyckoff’s Buying and Selling Tests.
Step 5: Time your entry.
The last step is all about timing. It usually involves analyzing a stock in comparison to the general market.
For example, a trader can compare the price action of a stock in relation to the S&P 500 index. Depending on their position within their individual Wyckoff Schematic, such an analysis may provide insights into the next movements of the asset. Eventually, this facilitates the establishment of a good entry.
Notably, this method works better with assets that move together with the general market or index. In cryptocurrency markets, though, this correlation isn’t always present but definitely you can find a lot of wyckoff pattern in Crypto.

APP Potential Spring - Waiting for backtestEyeballing APP here. On the daily we have three drives of classic bullish divergence on the MACD indicating price action reversal. So far, the price has indeed rallied. If APP can successfully backtest that $49.86 previous all-time low close here in late march, then I'll take a long with the chance for a very nice April/May return.
Also, the sellers failed to push the price down to the bottom of that descending channel. Further signalling a greater chance of a reversal and eventual breakout to the upside.
Entry: None yet, need a successful backtest of the spring.

Bitcoin Wyckoff AccumulationAs the Crypto bullrun possibly comes to end, there have been suggestions of a third run to 72k - marking the wyckoff distribution pattern and the retest of the All Time High (69K) and then back down.
However, with Bitcoin and Ethereum rejecting 200MA's and 200EMA's on the 1D / 4Hour charts with weak buying volume, this is becoming less and less likely a possibility.
That coupled with higher interest rates and the stock market falling, we could be in for a tough few months, with Bitcoin ranging between 30K and 48K.
I have noticed a possible accumulation pattern that could be taking place as we speak (please see the chart and explanation below).
Our Daily SELL indicator suggests we SHORT, so we went SHORT at 41.8k to hold until the low 30's.
Suggestions of Bitcoin going lower than 28.8K is probably exaggerated - there are some very big players in the market right now such as Microstrategy, Grayscale, Tesla who's average is higher than this. You can bet manipulation will hold Bitcoin above this price and we will never go lower than 28.8K (UNLESS there is a Great Depression).
Early 2023 should mark the start of Phase C/D - 1 year BEFORE the next halving, usually a point where smart money accumulates the most coins.
I also imagine the Fed's inflation problem is going to start becoming more of a problem again, with higher interest rates not having the same effect it has in 2022.
Here is a detailed explanation of Wyckoff accumulation and the levels as shown on the chart:
Phase A: Phase A marks the stopping of the prior downtrend. Up to this point, supply has been dominant. The approaching diminution of supply is evidenced in preliminary support (PS) and a selling climax (SC). These events are often very obvious on bar charts, where widening spread and heavy volume depict the transfer of huge numbers of shares from the public to large professional interests. Once these intense selling pressures have been relieved, an automatic rally (AR), consisting of both institutional demand for shares as well as short-covering, typically ensues. A successful secondary test (ST) in the area of the SC will show less selling than previously and a narrowing of spread and decreased volume, generally stopping at or above the same price level as the SC. If the ST goes lower than that of the SC, one can anticipate either new lows or prolonged consolidation. The lows of the SC and the ST and the high of the AR set the boundaries of the TR. Horizontal lines may be drawn to help focus attention on market behavior, as seen in the two Accumulation Schematics above.
Sometimes the downtrend may end less dramatically, without climactic price and volume action. In general, however, it is preferable to see the PS, SC, AR and ST, as these provide not only a more distinct charting landscape but a clear indication that large operators have definitively initiated accumulation.
In a re-accumulation TR (which occurs during a longer-term uptrend), the points representing PS, SC and ST are not evident in Phase A. Rather, in such cases, Phase A resembles that more typically seen in distribution (see below). Phases B-E generally have a shorter duration and smaller amplitude than, but are ultimately similar to, those in the primary accumulation base.
Phase B: In Wyckoffian analysis, Phase B serves the function of “building a cause” for a new uptrend (see Wyckoff Law #2 – “Cause and Effect”). In Phase B, institutions and large professional interests are accumulating relatively low-priced inventory in anticipation of the next markup. The process of institutional accumulation may take a long time (sometimes a year or more) and involves purchasing shares at lower prices and checking advances in price with short sales. There are usually multiple STs during Phase B, as well as upthrust-type actions at the upper end of the TR. Overall, the large interests are net buyers of shares as the TR evolves, with the goal of acquiring as much of the remaining floating supply as possible. Institutional buying and selling imparts the characteristic up-and-down price action of the trading range.
Early on in Phase B, the price swings tend to be wide and accompanied by high volume. As the professionals absorb the supply, however, the volume on downswings within the TR tends to diminish. When it appears that supply is likely to have been exhausted, the stock is ready for Phase C.
Phase C: It is in Phase C that the stock price goes through a decisive test of the remaining supply, allowing the “smart money” operators to ascertain whether the stock is ready to be marked up. As noted above, a spring is a price move below the support level of the TR (established in Phases A and B) that quickly reverses and moves back into the TR. It is an example of a bear trap because the drop below support appears to signal resumption of the downtrend. In reality, though, this marks the beginning of a new uptrend, trapping the late sellers (bears). In Wyckoff's method, a successful test of supply represented by a spring (or a shakeout) provides a high-probability trading opportunity. A low-volume spring (or a low-volume test of a shakeout) indicates that the stock is likely to be ready to move up, so this is a good time to initiate at least a partial long position.
The appearance of a SOS shortly after a spring or shakeout validates the analysis. As noted in Accumulation Schematic #2, however, the testing of supply can occur higher up in the TR without a spring or shakeout; when this occurs, the identification of Phase C can be challenging.
Phase D: If we are correct in our analysis, what should follow is the consistent dominance of demand over supply. This is evidenced by a pattern of advances (SOSs) on widening price spreads and increasing volume, as well as reactions (LPSs) on smaller spreads and diminished volumes. During Phase D, the price will move at least to the top of the TR. LPSs in this phase are generally excellent places to initiate or add to profitable long positions.
Phase E: In Phase E, the stock leaves the TR, demand is in full control and the markup is obvious to everyone. Setbacks, such as shakeouts and more typical reactions, are usually short-lived. New, higher-level TRs comprising both profit-taking and acquisition of additional shares (“re-accumulation”) by large operators can occur at any point in Phase E. These TRs are sometimes called “stepping stones” on the way to even higher price targets.
And here are the terms related to what you see in the chart:
GLOSSARY:
PS—preliminary support, where substantial buying begins to provide pronounced support after a prolonged down-move. Volume increases and price spread widens, signaling that the down-move may be approaching its end.
SC—selling climax, the point at which widening spread and selling pressure usually climaxes and heavy or panicky selling by the public is being absorbed by larger professional interests at or near a bottom. Often price will close well off the low in a SC, reflecting the buying by these large interests.
AR—automatic rally, which occurs because intense selling pressure has greatly diminished. A wave of buying easily pushes prices up; this is further fueled by short covering. The high of this rally will help define the upper boundary of an accumulation TR.
ST—secondary test, in which price revisits the area of the SC to test the supply/demand balance at these levels. If a bottom is to be confirmed, volume and price spread should be significantly diminished as the market approaches support in the area of the SC. It is common to have multiple STs after a SC.
Note: Springs or shakeouts usually occur late within a TR and allow the stock’s dominant players to make a definitive test of available supply before a markup campaign unfolds. A “spring” takes price below the low of the TR and then reverses to close within the TR; this action allows large interests to mislead the public about the future trend direction and to acquire additional shares at bargain prices. A terminal shakeout at the end of an accumulation TR is like a spring on steroids. Shakeouts may also occur once a price advance has started, with rapid downward movement intended to induce retail traders and investors in long positions to sell their shares to large operators. However, springs and terminal shakeouts are not required elements: Accumulation Schematic 1 depicts a spring, while Accumulation Schematic 2 shows a TR without a spring.
Test—Large operators always test the market for supply throughout a TR (e.g., STs and springs) and at key points during a price advance. If considerable supply emerges on a test, the market is often not ready to be marked up. A spring is often followed by one or more tests; a successful test (indicating that further price increases will follow) typically makes a higher low on lesser volume.
SOS—sign of strength, a price advance on increasing spread and relatively higher volume. Often a SOS takes place after a spring, validating the analyst’s interpretation of that prior action.
LPS—last point of support, the low point of a reaction or pullback after a SOS. Backing up to an LPS means a pullback to support that was formerly resistance, on diminished spread and volume. On some charts, there may be more than one LPS, despite the ostensibly singular precision of this term.
BU—“back-up”. This term is short-hand for a colorful metaphor coined by Robert Evans, one of the leading teachers of the Wyckoff method from the 1930s to the 1960s. Evans analogized the SOS to a “jump across the creek” of price resistance, and the “back up to the creek” represented both short-term profit-taking and a test for additional supply around the area of resistance. A back-up is a common structural element preceding a more substantial price mark-up, and can take on a variety of forms, including a simple pullback or a new TR at a higher level.

XDB Long at $0.25Price action for XDB from March 14, 2022 to the present has been pretty remarkable. From a Wyckoffian perspective, we observe a hyperdermic distribution after the buying climax (BC) on March 23. The red arrows point to volume spikes. In these 3 instances they illustrate heavy selling. It’s possible that we have observed a local selling climax (SC) on April 7. If it was a SC, it’s likely the price will enter a trading range. The first level of significant resistance is around $0.34; this corresponds to the price level at which the last significant amount of selling started.
I have opened a long position at $0.25 and expect the price to pause around $0.34.
Wyckoff abbreviations: preliminary supply (PSY), buying climax (BC), automatic reaction (AR), sign of weakness (SOW), last point of supply (LPSY), selling climax (SC).
This is not financial advice. I am not your financial advisor. This is my opinion.

BTC Potential Sign of Weakness in Re-DistributionThis chart builds on my previous ideas that I’ve shared regarding the BTC price since October, 2021. It appears that the BTC price has been observed in descending stepping-stone horizontal Wyckoff re-distribution trading ranges. The down trend was stopped on Jan 22, 2022 with a selling climax (SC) and the BTC price entered an upward sloping re-distribution trading range (to be confirmed or to fail). Since the BTC price was in a down trending environment from Nov 10, 2021 to Jan 22, 2022, our bias for the current trading range should be in favor of Wyckoff re-distribution, although we should be open to the possibility that the volume and price will demonstrate that our bias was incorrect and that the current trading range was, in fact, Wyckoff re-accumulation.
With regard to the more recent price action, we likely have observed a shakeout (SO)/sign of weakness (SOW) in potential Phase D of Wyckoff re-distribution. If this is correct, then we will likely observe upward price movement back into the trading range for a last point of supply (LPSY) event followed by the price breaking the trading range support to the downside. The other possibility is that we have observed a SO/Spring event. If this is correct, then we will observe a sign of strength (SOS) rally.
The upper and lower boundaries of the trading ranges are given by the solid black dotted lines. Significant bars, which help define important areas of support and resistance, are given by the blue shading. The blue arrows point to volume spikes.
Wyckoff abbreviations: automatic rally (ARa), automatic reaction (ARe), buying climax (BC), secondary test (ST), upthrust (UT), failed upthrust (FUT), last point of supply (LPSY), shakeout (SO), sign of weakness (SO), Phase A (Ph A), Phase B (Ph B), Phase C (Ph C), Phase D (Ph D), Phase E (Ph E).
This is not financial advice. I am not your financial advisor. This is my opinion.

BTC SHORT Descending TriangleBTC SHORT Descending Triangle Currently in a Bear market, This is a Bear flag to my beautiful eyes.
Risk reward 1:2

GLMR.Usdt (Y22.P1.E4).Wyckoff works
Hi All,
#Wyckoff Method #GLMR #GLIMMER #MOONBEAM
If you followed my posts, even better our group, you would have made some gains with this.
Just wanted to share how accurate this Bottom reversal was aligned to one of Wyckoff accumulation model.
Previous posts below.
Please like and share,
All the best,
S.SAri
strong resistance level
1.618

ETH Wyckoff BearishHere Comes Nothing lol Wyckoff method currently in Distribution phase , Short time baby
