ACM Divergence play could be stronger than the HD play!ACM or AECOM infrastructure and construction has just signed a deal to build infrastructure in the middle east. These guys are global! They already do a ton of business for our govt. If you havent looked at them before. Pull up a Daily chart and look at the run ups. This pulls a divergence using a macd on settings of 8-13-5. This is the setup Richard my millionaire mentor gave me. Everytime this stock drops down like this it immediately gaps up and runs to the last previous high and then repeats the move at about a 65% retracement bounce each time.
Usually takes about a month to complete the move. SO give yourself sometime.
I also used the keycode to track the most liklely path based on previous moves doing the same thing.
by iCantw84it
06.15.2021
Wyckoffmethod

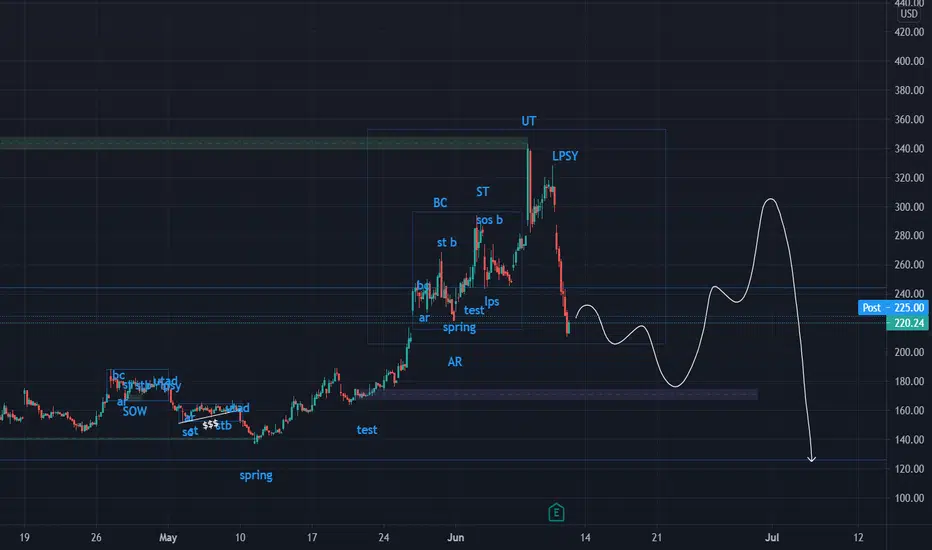
HD Divergence play with KeyCode Paths + they just bought a SHIPMy millionaire Mentor Richard taught me his divergence play set up and said if HD ever comes down start looking for Divergence.... So here we are. We have Divergence and Keycode is set to a strong play in the past where price action is contained inside of it at at least 95% or better.
I made a key code of the price action then found an exact match to this move in the past.... one that matched at lease 95% or better. That way if the move is that close to the same shape we have now it must mean the sentiment of the market was the same at that time. Therefore, the outcome should be the same coming out of the move. I then used PTP which is Past Trend Prediction by tracing the trend it made after this move in the past and projecting it forward on to the current move.
Then I took the same move on the Daily which is a different Time frame then the first..and found the same move with out a key and traced its path and projected it forward as well.
Sometimes I use about 5 other Price Action tricks I have have developed over the last 10 months or chart out the Curve and what Stage it is in. The Curve is my own brain child and I compare that to Wycoff method. Taking all of these into account You have several different approaches to confirming direction and intent of the institutional buyers and where Retail resides during this move.
If you would like to have more information or videos on Any of the ways I chart pls comment below. Like, follow, Subscribe...share.
Thank you,
iCantw84it
06.15.2021

Decisive Bullish Signal on USDCAD As was projected by our last analysis of the USDCAD (link below), the price established a throwback to the upper boundary of the Accumulation at 1.21350. The subsequent rebound from it confirmed the new uptrend.
The price is thus extremely likely to continue rising. This is further supported by the current reading of the MACD indicator. Therefore, the SL can be moved higher (just below 1.21350). The first TP remains the same - the minor resistance at 1.22700.

SPY I spy a New High for SPY
I made a key code of the price action then found an exact match to this move in the past.... one that matched at lease 95% or better. That way if the move is that close to the same shape we have now it must mean the sentiment of the market was the same at that time. Therefore, the outcome should be the same coming out of the move. I then used PTP which is Past Trend Prediction by tracing the trend it made after this move in the past and projecting it forward on to the current move.
Then I took the same move on the Daily which is a different Time frame then the first..and found the same move with out a key and traced its path and projected it forward as well.
Sometimes I use about 5 other Price Action tricks I have have developed over the last 10 months or chart out the Curve and what Stage it is in. The Curve is my own brain child and I compare that to Wycoff method. Taking all of these into account You have several different approaches to confirming direction and intent of the institutional buyers and where Retail resides during this move.
If you would like to have more information or videos on Any of the ways I chart pls comment below. Like, follow, Subscribe...share.
Thank you,
iCantw84it
06.14.2021

UWMC Small Accumulation In Wedge, Looking At Option StraddleLooking at the picture I see a small Accumulation to the upside. Even If I am wrong and we see a dip from the wedge I will be playing straddle options tomorrow on the weekly's depending on how premarket movement goes. Straddle at current price right now, if underlying hits $10.50 that would be close to 100% profits.

GBPUSD's Bearish Bias Growing Ahead of FED's Meeting The current ranging environment is demonstrated by the ADX indicator, which has been threading below the 25-point benchmark since the 24th of May.
The development of a descending channel elucidates the gradual transition from one market stage into another. The recent reversal from the channel's upper boundary, which also represented a reversal from the 100-day MA (in blue) and the major resistance level at 1.41800, highlights the strengthening bearish bias in the short term.
The price action is testing the 200-day MA (in orange) for a second time while also consolidating below the 23.6 per cent Fibonacci retracement level at 1.41114. This represents the aforementioned preliminary stage in the development of a new markdown.
The next major target is underpinned by the 38.2 per cent Fibonacci retracement level at 1.40291, which is currently coinciding with the channel's lower boundary. If the price does not rebound from the two, the downtrend can be extended lower and towards the major support level at 1.40000.
In addition to its psychological significance (elucidated by the two rebounds in the past), this level also converges with the 300-day MA (purple). Hence, bears should eye the range between 1.40000 and 1.40291 as the first threshold in the development of a new broad downtrend.


BTC/XLM following Wyckoff You can look at XLM as well and put the same points on them. XLM is cheaper and could be a potential play if it mimics BTC. Been buying around the 31-34 cent ranges for a play to the upside.

Potential ReAccumilation to the upsideSQ at first looked like a distribution but the Apr 13th high never went above the previous high on Feb 11th. I do see a potential false 1st spring on march 4th to the upside which didnt play out but there is another potential spring to the upside on may 19th that is slightly lower than the march 4th 'Spring" . I cant post a pic on here but if anyone else is looking at this let me know what ya think. Possibly this week we will get a better picture of the puzzle <3

USDCAD Developing a New Uptrend Last week, the USDCAD was finally able to break out above the upper boundary of a massive Accumulation range. This happened after a prolonged period of consolidation above the 100-day MA (in blue), underpinning the steadily rising bullish bias.
The breakout above 1.21350 and the 200-day MA (in orange) implies that the USDCAD may finally commence establishing a new Markup. This transition from the preceding Accumulation into a new Markup occurs as per the expectations of the Wyckoff theory.
The price may yet drop to the upper end of the Accumulation from above before rebounding and continuing to head north. The first major target for the new uptrend is underscored by the 200-day MA (in green). This is the resistance at 1.22700.

BTCUSD Wyckoff Pattern Accumulation ZoneI can sketch something and I follow like this! Not financial advise.


AXTA When in doubt what is Warren Buffet looking at?Found this play off Warren Buffets play list. Looked juicy here. It is repeating a move that pops upwards in a huge way in previous moves that shared the same KeyCode as this one. I found about 3-4 and all popped upwards.
I made a key code of the price action then found an exact match to this move in the past.... one that matched at lease 95% or better. That way if the move is that close to the same shape we have now it must mean the sentiment of the market was the same at that time. Therefore, the outcome should be the same coming out of the move. I then used PTP which is Past Trend Prediction by tracing the trend it made after this move in the past and projecting it forward on to the current move.
Then I took the same move on the Daily which is a different Time frame then the first..and found the same move with out a key and traced its path and projected it forward as well.
Sometimes I use about 5 other Price Action tricks I have have developed over the last 10 months or chart out the Curve and what Stage it is in. The Curve is my own brain child and I compare that to Wycoff method. Taking all of these into account You have several different approaches to confirming direction and intent of the institutional buyers and where Retail resides during this move.
If you would like to have more information or videos on Any of the ways I chart pls comment below. Like, follow, Subscribe...share.
Thank you,
iCantw84it
06.11.2021

CWK for a quick $3 run Option calls are .38/per JulyI made a key code of the price action then found an exact match to this move in the past.... one that matched at lease 95% or better. That way if the move is that close to the same shape we have now it must mean the sentiment of the market was the same at that time. Therefore, the outcome should be the same coming out of the move. I then used PTP which is Past Trend Prediction by tracing the trend it made after this move in the past and projecting it forward on to the current move.
Then I took the same move on the Daily which is a different Time frame then the first..and found the same move with out a key and traced its path and projected it forward as well.
Sometimes I use about 5 other Price Action tricks I have have developed over the last 10 months or chart out the Curve and what Stage it is in. The Curve is my own brain child and I compare that to Wycoff method. Taking all of these into account You have several different approaches to confirming direction and intent of the institutional buyers and where Retail resides during this move.
If you would like to have more information or videos on Any of the ways I chart pls comment below. Like, follow, Subscribe...share.
Thank you,
iCantw84it
06.10.2021

Bitcoin - A Wyckoff Cycle Study (Update)With the resumption of the correction in the last few days, I thought it was a great time to provide an update to the previous analysis of the Wyckoff Cycle and to focus in on what appears to be Phase B of the Accumulation period.
In this daily chart in the standard scale, you can see that I have adjusted the way-points of the accumulation template to fit with the price action, but I would note, that there is no timing predictability in this, as the implication is that this is the hallmark signature of market manipulation by larger money powers working to their own schedule. With that said, you can still appreciate that the price movement is still following the guidelines of the template reasonably well.
- see www.wyckoffanalytics.com
I have added two other features to this chart since the original posting, that I summarise for your consideration below:
the Pitchfork Channel - adapted from @TradingShot, it provides an excellent guide for the previous and potentially future trading range, until there is a breakout from the channel that is;
the Symmetric Triangle - defined the trading pattern for the prior period of consolidation; and
the Ascending Wedge - conjecture on my part for a possible structure of price recovery
[/list
At this point it appears that we must fall below $30k for the Wyckoff pattern to be respected, and if you have seen my other BTC charts, you will know that I feel that this entire correction is an Elliott Wave 3-3-5 correction and that we are in the 5th wave of that final leg down, which also forecasts that BTC must (should) drop below $30k. Looking at the Fibonacci projections of this last leg down and they have not changed, but they do offer some interesting correspondences to the lines of the Pitchfork Channel that could suggest possible timings if the low is to touch on one of the lines.
It will be interesting indeed, to watch how price moves after (if) it makes a lower low and at what level it drops to.

LULU looking nice in those hot pants...KeyCode UpdateI made a key code of the price action then found an exact match to this move in the past.... one that matched at lease 95% or better. That way if the move is that close to the same shape we have now it must mean the sentiment of the market was the same at that time. Therefore, the outcome should be the same coming out of the move. I then used PTP which is Past Trend Prediction by tracing the trend it made after this move in the past and projecting it forward on to the current move.
Then I took the same move on the Daily which is a different Time frame then the first..and found the same move with out a key and traced its path and projected it forward as well.
Sometimes I use about 5 other Price Action tricks I have have developed over the last 10 months or chart out the Curve and what Stage it is in. The Curve is my own brain child and I compare that to Wycoff method. Taking all of these into account You have several different approaches to confirming direction and intent of the institutional buyers and where Retail resides during this move.
If you would like to have more information or videos on Any of the ways I chart pls comment below. Like, follow, Subscribe...share.
Thank you,
iCantw84it
06.08.2021

Continuation of Wyckoff Accumulation on Bitcoin 1HAs we saw spring last night it seems that the price action is now forming an elliott wave where we are just at the top of the third wave. This top is supported by several other resistance, and previous support lines, in combination with .618 fibonacci retracement of the very first wave of the accumulation phase. In addition we are now, around 36.5k, trying to reclaim a key resistance level . I think it is not very likely that we will break this level at first try, therefore, I expect the price to decrease to around 35k and flip this into support. When this happens an increase to 38-39k can happen.
Elliott wave without the wyckoff

Take Solutions + Wyckoff Model - LongHere we come across Accumulation phase as specified in Wyckoff Model. As per the model one can take a long position in Take Solutions. The details of the model is described below.
The four stages of Wyckoff model (Accumulation Scheme) are: -
1. Phase A
The selling force decreases, and the downtrend starts to slow down. This phase is usually marked by an increase in trading volume. The Preliminary Support (PS) indicates that some buyers are showing up, but still not enough to stop the downward move.
At Selling Climax (SC) the intense selling activity slows down and comes to an end. But as the selling drops the price quickly reverts into a bounce or Automatic Rally (AR), as the excessive supply is absorbed by the buyers. In general, the trading range (TR) of an Accumulation Schematic is defined by the space between the SC low and the AR high.
As the name suggests, the Secondary Test (ST) happens when the market drops near the SC region, testing whether the downtrend is really over or not. While the ST often forms a higher low in relation to the SC, that may not always be the case.
2. Phase B
Phase B is the consolidation stage, in which the Composite Man starts accumulating the assets at its lowest possible fair value. During this stage, the market tends to test both the resistance and support levels of the trading range. There may be numerous Secondary Tests (ST) during Phase B.
3.Phase C
During Phase C, the Composite Man ensures that there is little supply left in the market, i.e., he accumulates greater amount of shares. A typical Accumulation Phase C contains what is called a Spring. It often acts as the last bear trap before the market starts making higher lows. The Spring often breaks the support levels to stop out traders and mislead investors. We may describe it as a final attempt to buy shares at a lower price before the uptrend starts. The bear trap induces retail investors to give up their holdings. In some cases, however, the support levels manage to hold, and the Spring simply does not occur. Still, the overall scheme continues to be valid. Incidentally in the above case we do not find a Spring.
*See the tremendous accumulation of stock as is evident in volume. However the price shows sidewise movement. The buyer wants to buy maximum shares in a slow pace without letting others know about it.
4. Phase D
Typically, the Phase D shows a significant increase in trading volume and volatility. It usually has a Last Point Support (LPS), making a higher low before the market moves higher. The LPS often precedes a breakout of the resistance levels, which in turn creates higher highs. This indicates Signs of Strength (SOS), as previous resistances become brand new supports.
Despite the somewhat confusing terminology, there may be more than one LPS during Phase D. They often have increased trading volume while testing the new support lines. In some cases, the price may create a small consolidation zone before effectively breaking the bigger trading range and moving to Phase E.
Phase E
The Phase E is the last stage of an Accumulation Schematic. It is marked by an evident breakout of the trading range, caused by increased market demand. This is when the trading range is effectively broken, and the uptrend starts. As of now Phase E has not started. Since we are at Phase D hope Phase E starts soon.
*Now we are in the accumulation phase.
Wyckoff’s Composite Man Principle – Relevant to above theory
The Composite Man,proposed by Wyckoff in reality, represents the big players in the market such as rich individual and institutional investors. He states that the Composite Man, in theory, acts behind the scene and manipulates the market to the disadvantage of the traders if they do not understand the market game. Conversely, it acts to traders’ greatest advantage if traders truly understand the market game. Wyckoff always wanted retail investors to trade just like the Composite Man who acts in the below mentioned manner: -
(i) Accumulation
The Composite Man accumulates assets before most investors. This phase is usually marked by a sideways movement. The accumulation is done gradually to avoid the price from changing significantly.
(ii) Uptrend
When the Composite Man is holding enough shares, and the selling force is depleted, he starts pushing the market up. Naturally, the emerging trend attracts more investors, causing demand to increase.Notably, there may be multiple phases of accumulation during an uptrend. We may call them re-accumulation phases, where the bigger trend stops and consolidates for a while, before continuing its upward movement.As the market moves up, other investors are encouraged to buy. Eventually, even the general public become excited enough to get involved. At this point, demand is excessively higher than supply.
For more information look in the comments.

BE by requestI made a key code of the price action then found an exact match to this move in the past.... one that matched at lease 95% or better. That way if the move is that close to the same shape we have now it must mean the sentiment of the market was the same at that time. Therefore, the outcome should be the same coming out of the move. I then used PTP which is Past Trend Prediction by tracing the trend it made after this move in the past and projecting it forward on to the current move.
Then I took the same move on the Daily which is a different Time frame then the first..and found the same move with out a key and traced its path and projected it forward as well.
Sometimes I use about 5 other Price Action tricks I have have developed over the last 10 months or chart out the Curve and what Stage it is in. The Curve is my own brain child and I compare that to Wycoff method. Taking all of these into account You have several different approaches to confirming direction and intent of the institutional buyers and where Retail resides during this move.
If you would like to have more information or videos on Any of the ways I chart pls comment below. Like, follow, Subscribe...share.
Thank you,
iCantw84it
06.08.2021

NAK by RequestI made a key code of the price action then found an exact match to this move in the past.... one that matched at lease 95% or better. That way if the move is that close to the same shape we have now it must mean the sentiment of the market was the same at that time. Therefore, the outcome should be the same coming out of the move. I then used PTP which is Past Trend Prediction by tracing the trend it made after this move in the past and projecting it forward on to the current move.
Then I took the same move on the Daily which is a different Time frame then the first..and found the same move with out a key and traced its path and projected it forward as well.
Sometimes I use about 5 other Price Action tricks I have have developed over the last 10 months or chart out the Curve and what Stage it is in. The Curve is my own brain child and I compare that to Wycoff method. Taking all of these into account You have several different approaches to confirming direction and intent of the institutional buyers and where Retail resides during this move.
If you would like to have more information or videos on Any of the ways I chart pls comment below. Like, follow, Subscribe...share.
Thank you,
iCantw84it
06.08.2021

FCX by requestI made a key code of the price action then found an exact match to this move in the past.... one that matched at lease 95% or better. That way if the move is that close to the same shape we have now it must mean the sentiment of the market was the same at that time. Therefore, the outcome should be the same coming out of the move. I then used PTP which is Past Trend Prediction by tracing the trend it made after this move in the past and projecting it forward on to the current move.
Then I took the same move on the Daily which is a different Time frame then the first..and found the same move with out a key and traced its path and projected it forward as well.
Sometimes I use about 5 other Price Action tricks I have have developed over the last 10 months or chart out the Curve and what Stage it is in. The Curve is my own brain child and I compare that to Wycoff method. Taking all of these into account You have several different approaches to confirming direction and intent of the institutional buyers and where Retail resides during this move.
If you would like to have more information or videos on Any of the ways I chart pls comment below. Like, follow, Subscribe...share.
Thank you,
iCantw84it
06.08.2021

