IMMP per request....I made another mess.Ok So I put lines everywhere from all over the place and in the confusion of it all some areas started to have some confluence.....everything kept pointing to $6.80. I appreciate the request to take a look at this.
by iCantw84it
05.27.2021
Please Like Subscribe if you would like to see more of these.
Wyckoffmethod

NAKD is done skinny dipping?NAKD looks like its about to repeat a 6 month Blip to a new high or at least come up from skinny dipping because its getting to prunny. One or the other we should be able to profit off it.
Done for a request, thank you!
by iCantw84it
05.26.2021

UEC Uranium Play is Ready to go DEF CON 5!I had a random thought, voice, divine intervention, I don't know what it was but out of no where I had this, more than a thought or idea, but it was clear... "Look at URANIUM! " Subtle real Subtle......*slowly starts to run away*
Anyways in my dive into Uranium Plays I looked at URA which is a ETF and good but kind of slow....and about 4 other Uranium Stocks....Then I found this one UEC. UEC is not only a Company that stock piles Uranium, they invest in other companies stocks that have uranium! ETF Warehouse of URANIUM! AMAZON of URANIUM! ok I digress you get the idea. So that said I found the bottom, drew my trend lines from the past, slapped it and called it Sally......Waited for it to dip and then bought in on some option calls. I think where it is at currently isnt a bad place to get in $3.07. The option calls are .15 out of the money and .25 in the money! I mean I dont know what gets you all excited but I couldn't stand up for 15 mins when i found this.....Mostly because My back hurt and it was locked up....but thats besides the point.
If you are looking to add some something Nuclear in your plays this is the play to get in on. Just my .02 cent worth but i mean thats all i can afford so dont listen to me......or do. Either way I'll still be sitting here not standing up.
by iCantw84it
05.27.2021

IWM what a mess i have made....but I did find the Deep V ComboOk after about an hour of breaking this down every way possible I finally see something recognizable. Theres a combo(what I call repeating moves I see in price action. Over the last 9-10 months I memorized all kinds of combos and this is the Deep V Drop move. There is a chance it can rally and go long when it pops up to hit the Upper BB. However, thats a rare one. I believe it hits upper BB might be 1 and done or could print 3 -4 candles moving diagnally hugging the BB as it does. When it finally prints a candle that isnt connected to the BB. Thats your trigger. if you arent as high risk as me. Wait for it to drop and hit the bottom bb. it will print 3-4 candles there and then pop back up to hit the mean one last time before free falling.
in the video I intertwine this with wyckoff and the curve and try to give it as much Gravity as I could.
Hope this helps,
by iCantw84it
05.26.2021

VET/USDT Price predictions what to expect in the next few daysAs VeChain has been testing a .618 fibonacci trend extension for the last 1.5 days combined with a support level based on the Wyckoff Accumulation an increase in price can be expected. However there are some major price levels that need to be recaptured, such as the 14.7-15 cents. When this level is broken the optimal scenario would be a backtest of this level after a successful test we can expect an increase to the 18-19 cent region.

Wyckoff Accumulation Bitcoin 1H At this moment the accumulation is at a critical point, in the first post about Wyckoff I assumed that the price was behaving as Schematic #1. However due to the extended fourth wave there is a possibility that it is switching to Schematic #2, this would than result in more of a trading range for the coming days instead of high volatile price action.
The retrace of last night was perfectly supported by the 0.66 (The top of an extended version of the golden pocket) of the fib retracement of the first wave. It was was also supported by the .236 fib retracement of the third wave (since there was no close below it). However, we should have a second test of the resistance level at ~40,500 within 24h. When this test does not happen we could see a low earlier than predicted.
Next to this, we can see a breakout form a relatively simple rising wedge pattern, the target of this breakdown is around the same region as the spring of Wyckoff in Phase C. However keep in mind that the resistance line (prior support) is not tested and thus not confirmed, this can lead to the fact that the pattern breakdown is uncertain.
As well I want to apologise for the misleading titles of the last two days in which it said that it is a distribution instead of an accumulation. A distribution is entered with an uptrend and an accumulation is entered with a downtrend.

PLTR forecastpossible spring might have formed at $17. If price rally up to $24 in the current bullish trend, support will be formed at $18. If not we will expect price will drop to ~$15

Wyckoff Accumulation Micro Analysis of Bitcoin PricesI am simultaneously publishing Wyckoff Accumulation micro and macro analyses.
For a full writeup of these analyses, please visit: www.booyahtraders.com

HIMX this was a messy one....but after some intense Questioning.I kind of went over board on this one but Hector154 needed to get answers from this one and so I interrogated until it cracked.
Hope this helps. if you need me to delete any of the paths just let me know and Ill revamp it.
by iCantw84it
05.26.2021

Covering all the Plays made a month ago to about a week agoThis is a video I made to cover all the plays made about a month ago up until about two weeks ago. I cut off half way through and honestly I thought it didn't record any of it. So I am posting it now. and I will pick up where it left off probably tomorrow.
If these have helped you trade please like and follow.
by iCantw84it
05.26.2021

OILBRENT WYCKOFF DISCTRIBUTION ANALYSISTrade Proposal:
There is a probability of first tp to the proposed ( 68.0) Direction line. So, Traders can set orders based on Price Action and expect to reach short-term goals.
Technical analysis:
OILBRENT is in Downtrend and It is Expected to Continue Downtrend.

DISCA Discovering it has a future and ready for MEDIA WARS 2021Discovery in its merger with Warner Brothers, ATT, and a bunch of other media giants at war for who will control Streaming in the future! This is like watching Pirahana Eat Each other while Small groups of fish, mammals, and other non aggressive beings are torn to pieces as the feeding frenzy and blood lust begins!
Either way this is a strong place to get in on this chart. Identifying the bottom several different ways.
With the skys the limit. There really is nothing stopping it ceiling wise for almost $30 Lets go Chum the waters for more cannibalistic fun!
by iCantw84it
05.26.2021
I know I know I didnt put the S in DISCA. SMH

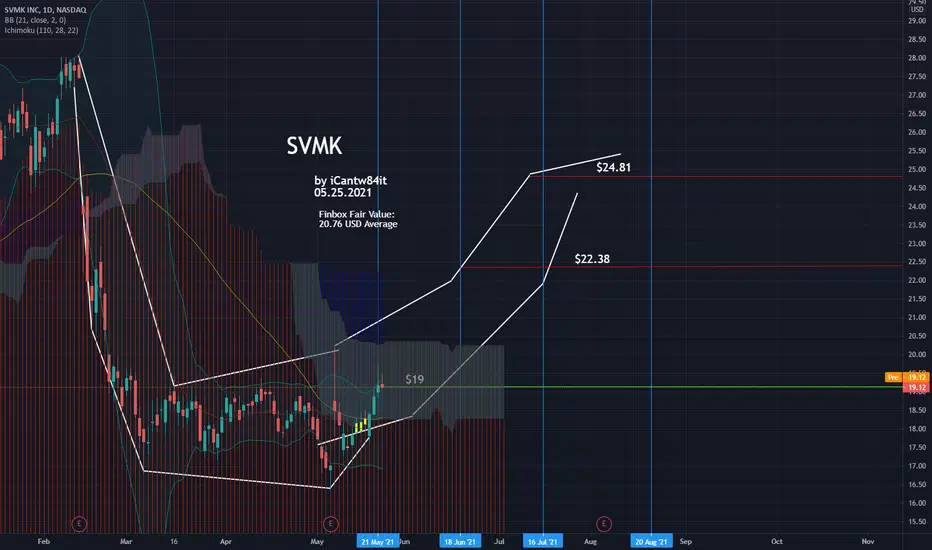
CRM hitting key buying levelsThey say this will come down to $200 which is a key buying level. However, think we have another run up before this takes a turn to go down deeper than it is right now.
by iCantw84it
05.17.2021

$ZILUSD - The Wyckoff test.NOT FINANCIAL ADVICE.
This is my first ever attempt to jump onto the Wyckoff's method bandwagon after spending weeks of reading and testing.
This post is as much an effort to figure out $ZILUSD's trend as it is to grow my understanding in this school of thought.
As such, I welcome all feedbacks, criticisms, advices, and where I might have erred a thing or two, my apologies in advance.
Wyckoff's Method
Richard Wyckoff established simple but powerful observational rules for 4 trend recognitions: Accumulation, Markup, Distribution and Markdown -- but nothing is really that simple, right?
Within this debilitating chart, which looks nothing like your standard Wyckoff schematics, it is pretty difficult to pinpoint in which trend $ZIL is in.
One thing for sure though is that we see contracting volume, a recipe ripe for volatile price action.
Contracting volume
One of the key tenets of Wyckoff's method, volume relates to supply and demand.
We see preliminary supply (PSY) contracting circa Dec 2020.
However, I find it difficult to confirm if we are in a distribution trend, as we see characteristics of upthrusts (UT), or if we are in a re-accumulation trend, where we see signs of strengths (SOS) aplenty.
$0.10 will be the critical point of support, while $0.15 is the crucial wall of resistance that Bulls need to break to induce retail confidence and invoke a 'spring' out of this creek, which is the highlighted red rectangular zone.
This 'creek' will be a point of particular interest in the next few weeks (or months even).
Whether price will jump from (SPRING) or if it is the last point of supply area (LPSY), perhaps practicing caution is not such a bad idea until we see further price (and volume) action.
Until then, happy trading~!

CCL Carnival Cruise Lines popping its head out of the clouds..Perfect timing as restrictions for travel loosen.
by iCantw84it
05.25.2021


OZON setting up for a double tap to last highThis is good for a $10 run twice.
by iCant84it
05.25.2021

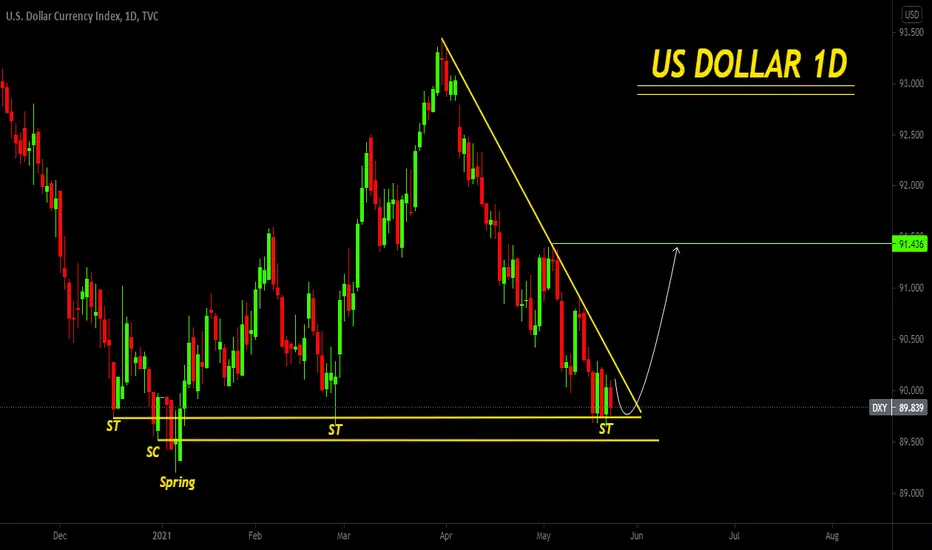
USDOLLAR WYCKOFF DISCTRIBUTION ANALYSISTrade Proposal:
There is a probability of first tp to the proposed ( 92 ) Direction line. So, Traders can set orders based on Price Action and expect to reach short term goals.
Technical analysis: USDOLLAR Waiting for the Range Bound and the beginning of the Ascension Trend.
UEC Uranium Play wow .13 option calls lets go!I like a .13 option call on anything with a pulse....what can i say im easy and cheap lol.
lets look at the trendlines and see how they hold up on a 15 min chart. if higher lows are being made. Jump
by iCantw84it
05.24.2021

BTC Wyckoff Accumulation Phase - UPDATED!< #NotInvestmentAdvice >
I previously published a version of this that I now believe was overly-pessimistic. With a couple additional days of hourly bars closed, I believe this updated version lines up the Wyckoff events far more accurately.
In particular, I believe the Phase "A" events (PS, SC, AR, ST) line up perfectly according to their textbook descriptions, which places us solidly into Phase "B" at this time.
PLEASE NOTE: The dotted projection lines & arrows are conjecture/guesstimation ONLY - it is impossible for anyone to predict exactly where the market will move in the future.
Having said that, I believe the remainder of this accumulation phase will very likely follow the general parameters of this Wyckoff pattern. Personally, I am preparing take modest profits between $42k-$46k in preparation fro a possible plunge below $29k intended to shake out any remaining "weak hands" and transfer their BTC to the Large Interests and the Composite Man Composite Man . If that does happen, I want to be prepared to accumulate along with those interests.
Note that NOT all Wyckoff accumulations involve the "Spring", and in fact we may not even drop below $29k, that may have actually been the Bottom. But after the turbulence of the past couple weeks, I'm not betting my portfolio on that, and I'm making sure I am fully prepared for both of these contingencies, and I have a plan in place in case of further drop. I suggest *everyone* has their own plan in place appropriate to their personal investment strategy. (If you happen to be using leverage, BE CAREFUL and do not engage in wishful thinking! Plan in advance what you'll do if you need to ride BTC down to an unanticipated low!)
Again, personally I do NOT believe we are in a bear market; I believe what we are seeing is the result of blatant & obvious market manipulation by the Large Interests that want to buy our crypto at fire-sale prices (<$30K? WTF??? That's just GREEDY!) I expect these interests are going to try to hold our heads underwater until we lose our nerve, capitulate, and cash out at current prices or lower. I have no interest in doing that. I *hope* we've already bounced off the bottom & have a linear move straight up to the Moon, but I don't really believe that. Hope for the Best, but Prepare for the Worst ...
Lastly, I STRONGLY URGE you to spend 20 minutes educating yourself on the basics of Wyckoff theory by reading the overview page at: school.stockcharts.com
Technologies change, but human nature & emotions don't, which I believe is why this 100 year old theory still provides value!

CCJ Uranium Play Trades to watch #3Something spoke to me and said look at Uranium so I am digging in to some uranium plays trying to find the best one. I like URA although it might move slower than some of these other ones. SO just weighing my options.
by iCantw84it
05.24.2021
