Gold in its before-last phase of a 3 year accumulation.With the closure of the current sideways BU/LPS move to the upside, it would initiate the phase E of the accumulation with a break and mark up towards an ATH.
From that point on we would see how price maintains itself above the 3 year resistances and if in turn, rejection is too strong and we enter a long term distribution scenario.
I believe it to be highly unlikely however as the fundamentals driving gold bulls at the moment are very strong.
Wyckoffmethods

📊 Wyckoff SchematicsThe Wyckoff Method involves a five-step approach to stock selection and trade entry, which can be summarized as follows:
Determine the present position and probable future trend of the market. Is the market consolidating or trending? Does your analysis of market structure, supply and demand indicate the direction that is likely in the near future? This assessment should help you decide whether to be in the market at all and, if so, whether to take long or short positions. Use both bar charts and Point and Figure charts of the major market indices for Step 1.
Select stocks in harmony with the trend. In an uptrend, select stocks that are stronger than the market. For instance, look for stocks that demonstrate greater percentage increases than the market during rallies and smaller decreases during reactions. In a downtrend, do the reverse – choose stocks that are weaker than the market. If you are not sure about a specific issue, drop it and move on to the next one. Use bar charts of individual stocks to compare with those of the most relevant market index for Step 2.
Select stocks with a “cause” that equals or exceeds your minimum objective. A critical component of Wyckoff's trade selection and management was his unique method of identifying price targets using Point and Figure (P&F) projections for both long and short trades. In Wyckoff's fundamental law of “Cause and Effect,” the horizontal P&F count within a trading range represents the cause, while the subsequent price movement represents the effect. Therefore, if you are planning to take long positions, choose stocks that are under accumulation or re-accumulation and have built a sufficient cause to satisfy your objective. Step 3 relies on the use of Point and Figure charts of individual stocks.
Determine the stocks' readiness to move. Apply the nine tests for buying or for selling (described below). For instance, in a trading range after a prolonged rally, does the evidence from the nine selling tests suggest that significant supply is entering the market and that a short position may be warranted? Or in an apparent accumulation trading range, do the nine buying tests indicate that supply has been successfully absorbed, as evidenced further by a low-volume spring and an even lower-volume test of that spring? Use bar charts and Point and Figure charts of individual stocks for Step 4.
Time your commitment with a turn in the stock market index. Three-quarters or more of individual issues move in harmony with the general market, so you improve the odds of a successful trade by having the power of the overall market behind it. Specific Wyckoff principles help you anticipate potential market turns, including a change of character of price action (such as the largest down-bar on the highest volume after a long uptrend), as well as manifestations of Wyckoff's three laws (see below). Put your stop-loss in place and then trail it, as appropriate, until you close out the position. Use bar and Point and Figure charts for Step 5.
🔹PS — preliminary support, where substantial buying begins to provide pronounced support after a prolonged down-move. Volume increases and price spread widens, signaling that the down-move may be approaching its end.
🔹SC — selling climax, the point at which widening spread and selling pressure usually climaxes and heavy or panicky selling by the public is being absorbed by larger professional interests at or near a bottom. Often price will close well off the low in a SC, reflecting the buying by these large interests.
🔹AR — automatic rally, which occurs because intense selling pressure has greatly diminished. A wave of buying easily pushes prices up; this is further fueled by short covering. The high of this rally will help define the upper boundary of an accumulation TR.
🔹ST — secondary test, in which price revisits the area of the SC to test the supply/demand balance at these levels. If a bottom is to be confirmed, volume and price spread should be significantly diminished as the market approaches support in the area of the SC. It is common to have multiple STs after a SC.
🔹Test — Large operators always test the market for supply throughout a TR (e.g., STs and springs) and at key points during a price advance. If considerable supply emerges on a test, the market is often not ready to be marked up. A spring is often followed by one or more tests; a successful test (indicating that further price increases will follow) typically makes a higher low on lesser volume.
🔹SOS — sign of strength, a price advance on increasing spread and relatively higher volume. Often a SOS takes place after a spring, validating the analyst’s interpretation of that prior action.
🔹LPS — last point of support, the low point of a reaction or pullback after a SOS. Backing up to an LPS means a pullback to support that was formerly resistance, on diminished spread and volume. On some charts, there may be more than one LPS, despite the ostensibly singular precision of this term.
🔹BU — “back-up”. This term is short-hand for a colorful metaphor coined by Robert Evans, one of the leading teachers of the Wyckoff method from the 1930s to the 1960s. Evans analogized the SOS to a “jump across the creek” of price resistance, and the “back up to the creek” represented both short-term profit-taking and a test for additional supply around the area of resistance. A back-up is a common structural element preceding a more substantial price mark-up, and can take on a variety of forms, including a simple pullback or a new TR at a higher level.
🔹PSY — preliminary supply , where large interests begin to unload shares in quantity after a pronounced up-move. Volume expands and price spread widens, signaling that a change in trend may be approaching.
🔹BC — buying climax, during which there are often marked increases in volume and price spread. The force of buying reaches a climax, with heavy or urgent buying by the public being filled by professional interests at prices near a top. A BC often coincides with a great earnings report or other good news, since the large operators require huge demand from the public to sell their shares without depressing the stock price.
🔹AR — automatic reaction. With intense buying substantially diminished after the BC and heavy supply continuing, an AR takes place. The low of this selloff helps define the lower boundary of the distribution TR.
🔹ST — secondary test, in which price revisits the area of the BC to test the demand/supply balance at these price levels. For a top to be confirmed, supply must outweigh demand; volume and spread should thus decrease as price approaches the resistance area of the BC. An ST may take the form of an upthrust (UT), in which price moves above the resistance represented by the BC and possibly other STs before quickly reversing to close below resistance. After a UT, price often tests the lower boundary of the TR.
🔹SOW — sign of weakness, observable as a down-move to (or slightly past) the lower boundary of the TR, usually occurring on increased spread and volume. The AR and the initial SOW(s) indicate a change of character in the price action of the stock: supply is now dominant.
🔹LPSY — last point of supply. After testing support on a SOW, a feeble rally on narrow spread shows that the market is having considerable difficulty advancing. This inability to rally may be due to weak demand, substantial supply or both. LPSYs represent exhaustion of demand and the last waves of large operators’ distribution before markdown begins in earnest.
🔹UTAD — upthrust after distribution. A UTAD is the distributional counterpart to the spring and terminal shakeout in the accumulation TR. It occurs in the latter stages of the TR and provides a definitive test of new demand after a breakout above TR resistance. Analogous to springs and shakeouts, a UTAD is not a required structural element: the TR in Distribution Schematic #1 contains a UTAD, while the TR in Distribution Schematic #2 does not.
👤 @AlgoBuddy
📅 Daily Ideas about market update, psychology & indicators
❤️ If you appreciate our work, please like, comment and follow ❤️

19 RR Trade, Wyckoff AccumulationOne of my best trades to date.
The price fell asleep along the breakout VWAP and exploded to target overnight, despite the FOMC meeting that same evening.
Really happy to have I caught that move.

RIPPLE | WYCKOFF METHOD | PHASE EWyckoff’s Schematics
The Accumulation and Distribution Schematics are likely the most popular part of Wyckoff’s work - at least within the cryptocurrency community. These models break down the Accumulation and Distribution phases into smaller sections. The sections are divided into five Phases (A to E), along with multiple Wyckoff Events , which are briefly described below.
Accumulation Schematic
Phase E
The Phase E is the last stage of an Accumulation Schematic . It is marked by an evident breakout of the trading range, caused by increased market demand. This is when the trading range is effectively broken, and the uptrend starts.
---
more information on the Wyckoff Method Explained here in Binance Academy.

USDZAR DistributionWell well well, This might be an opportune trade for swinging.
I see a nice distribution forming on the monthly time frame for usdzar .
Keep your eyer on this pair.

BTC Wyckoff distribution and accumulation phasesNever have I ever seen distribution and accumulation phases play out this nicely.
The uptrend has just begun, Bitcoin is set for new all time highs in the near future.
For Wyckoff questions please read school.stockcharts.com

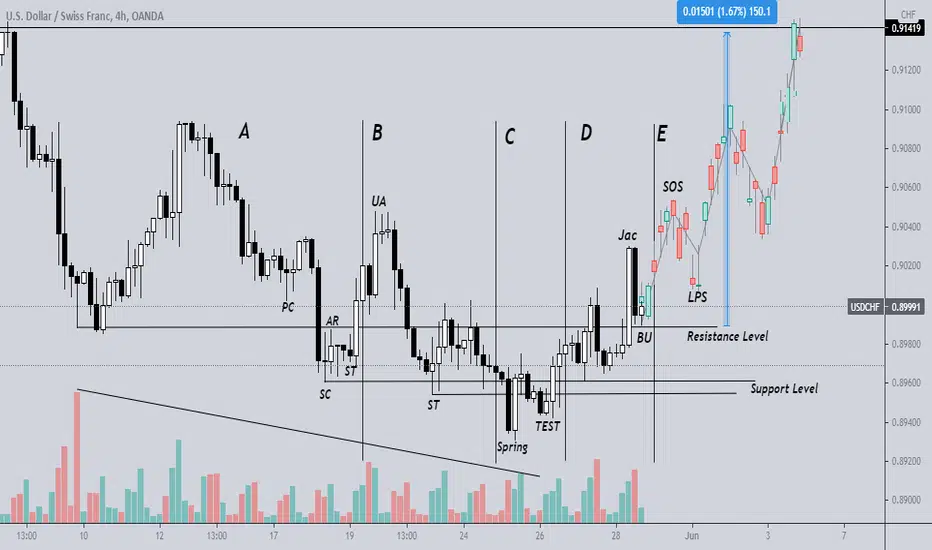
USDCHF REACCUMULATIONThis pair loves to consolidate but when it moves expect some nice pips.
I put a little time and thought to see the kind of consolidation this might be. To my eye, It looks more like a reaccumulation inside a larger re-accumulation.
I understand price makes repeated patterns in different time frames.
If this were to be the case then a 1:16 ratio isn't that bad.

USDCAD REACCUMULATION WITH A SPRINGThis is a pair I have been following closely as I have vested long term interests.
Price action is slowly showing us its hand. This week I would expect reversals as the pair heads down to take out liquidity.

BTC MASSIVE REACCUMULATION
Has it occurred to anyone that it is rather unsettling for bitcoin to peek at this time of the year. Normally it happens in december towards January.
It was hard for me to fathom how they would leave all that liquidity below. I might have solved this mind boggling puzzle for my self.
I call the reaccumulation first

GBP REDISTRIBUTION DURING FOMCPrice is never Random. Fomc enabled price to form the UTAD of the redistribution.
Price will give us an entry at the 1hr institutional candle

READY TO SHORT SILVERSilver might see a sell in coming weeks after price breaking the 24 usd recent lower low. This may signify a break of market structure forming what would be supposedly be a major sign of weakness. It would be quite nice if we see a retracement to the upside until 27.750 level before going down. Once that level holds we can be sure of an impulsive down trend


Wyckoff on US30This is what Im seeing on US30
2 areas to enter if market keeps going down and 2 areas to enter on move up.
May change on Monday.

Wyckoff on GoldThis is where I see Market right now. It's Sunday markets open at 6 so things are subject to change on Monday.
But overall Gold is headed down.

USDCAD RE-ACCUMULATIONo
Last week I thought price would go down and fill the imbalance left but boy was I wrong.
Far from speculation I have concrete evidence that usdcad will not see a new low form coupled up with a very nice narrative for the pair. So here we go:
We saw usdcad complete the accumulation phase after taking out all liquidity below. What follows next in the wycoff cycle is a series of reaccumulations and the first one has just being completed
After showing a sign of strength, the pair closed at a 4HR institutional candle where they have their buy orders. i.e Not expecting price to go below that candle
For a low risk set up I would look for a wycoff accumulation in the lower time frame next week.
Beware of high impact news on wednesday and friday that affect the pair.
A spring is most likely to happen on friday but I would rathher wait for price to show me its hand.
Find previuos analysis atached below,

Distribution and consolidation of Wyckoff. Distribution and consolidation of Wyckoff.
schematically. probably faster.

The One Chart That Hasn't Changed. Money for the chads.To the people that follow i might do request on TA for any pair side note no meme coins please but i might still do it. Get them Sats.


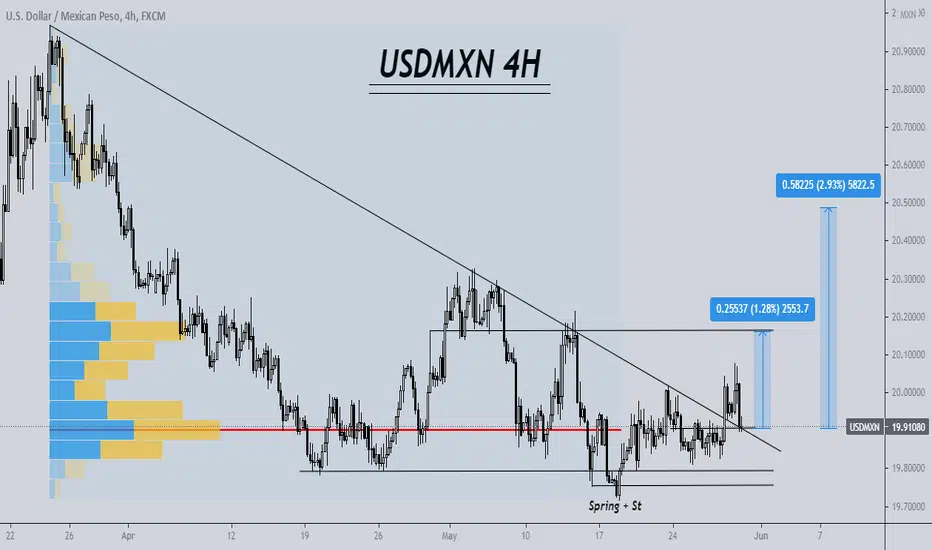
USDMXN WYCKOFF DISCTRIBUTION ANALYSISTrade Proposal:
There is a probability of first tp to the proposed ( 20.16 ) Direction line. So, Traders can set orders based on Price Action and expect to reach short term goals.
Technical analysis: USDMXN Waiting for the Range Bound and the beginning of the Ascension Trend.
What is the Wyckoff MethodPhase A. Stopping the previous bearish trend.
• PS. Preliminary Support. It's the first attempt to stop the downward movement that will always fail.
• SC. Selling Climax. Climate action that stops the downward movement.
• AR. Automatic Rally. Bullish reaction. An upward movement that sets the maximum range.
• ST. Secondary Test. Test of the level of supply in relation to climate action. Establishes the end of Phase A and the beginning of Phase B.
Phase B. Construction of the cause.
• UA. Upthrust Action. Temporary breakout of the resistance and re-entry into the range. This is a test at the maximum generated by the AR.
• ST as SOW. Secondary Test as Sign Of Weakness Sample of weakness in test function. Temporary break of the support and re-entry to the
range. This is a test at the minimum generated by the SC.
Phase C. Test
• SP Spring. It is a test in the form of breakout of the minimums of Phases A and B. There are three different types of Springs.
• Test Spring. Downward movement towards lows of the range in order to check the commitment of the sellers.
• LPS. Last Point of Support. Test in the form of a bearish movement that fails to reach the minimum range.
• TSO. Terminal Shakeout or Shakeout. Abrupt movement of minimum breakout that produce a deep penetration of the level of support and a
fast
Phase D. Bullish trend within the range.
• SOS. Sign of Strength. Bullish movement generated after the Phase C Test event that manages to reach the top of the range. Also called JAC.
Jump Across the Creek. Creek jump.
• LPS. Last Point of Support. These are the rising troughs we find in the upward movement towards resistance.
• BU. Back Up. This is the last big reaction before the bull market starts. Also called BUEC. Back Up to the Edge of the Creek. Back to the
creek
Phase E. Bullish trend out of range.
•Succession of SOS and LPS generating a dynamic of rising highs and lows.
BTC/XLM following Wyckoff You can look at XLM as well and put the same points on them. XLM is cheaper and could be a potential play if it mimics BTC. Been buying around the 31-34 cent ranges for a play to the upside.

TWTUSDT WYCKOFF DISCTRIBUTION ANALYSISTrade Proposal:
There is a probability of first tp to the proposed ( 0.87 ) Direction line. So, Traders can set orders based on Price Action and expect to reach short term goals.
Technical analysis: TWTUSDT Waiting for the Range Bound and the beginning of the Ascension Trend.
