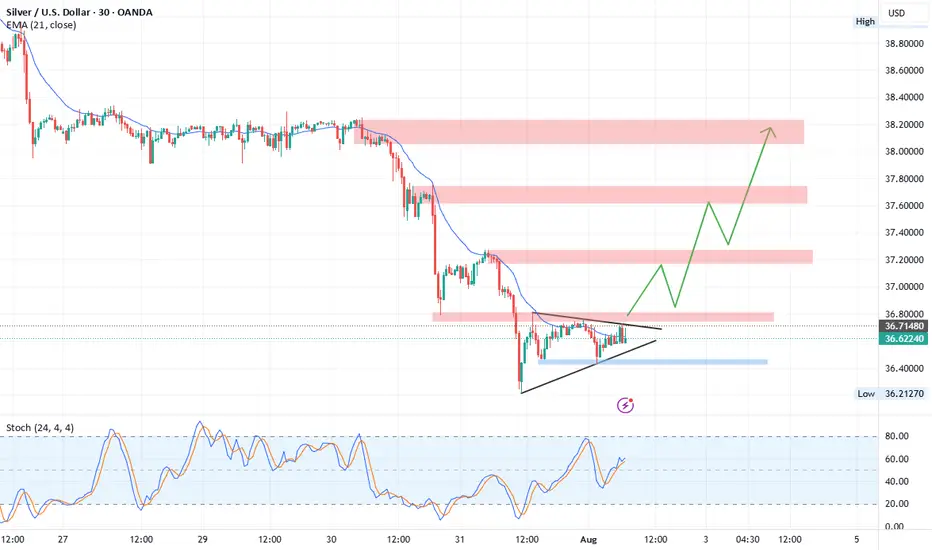
XAGUSD Technical Outlook (Silver/USD)Currently, Silver is trading inside a symmetrical triangle formation , signaling a potential breakout.
Upside Scenario:
A breakout above 36.80 resistance may trigger strong bullish momentum. The next target zone lies at 37.18 – 37.30, which is a relatively weak resistance and could potentially form a Head and Shoulders pattern . If momentum continues, Silver could extend gains toward 37.75 and 38.00 resistance levels.
Downside Scenario:
If the triangle breaks to the downside, we may see a short corrective move toward 3 6.25 – 36.20 support zone before any possible rebound.
Overall, the chart structure currently favors an upside breakout with continuation toward higher resistance zones.
Xagusdanalysis
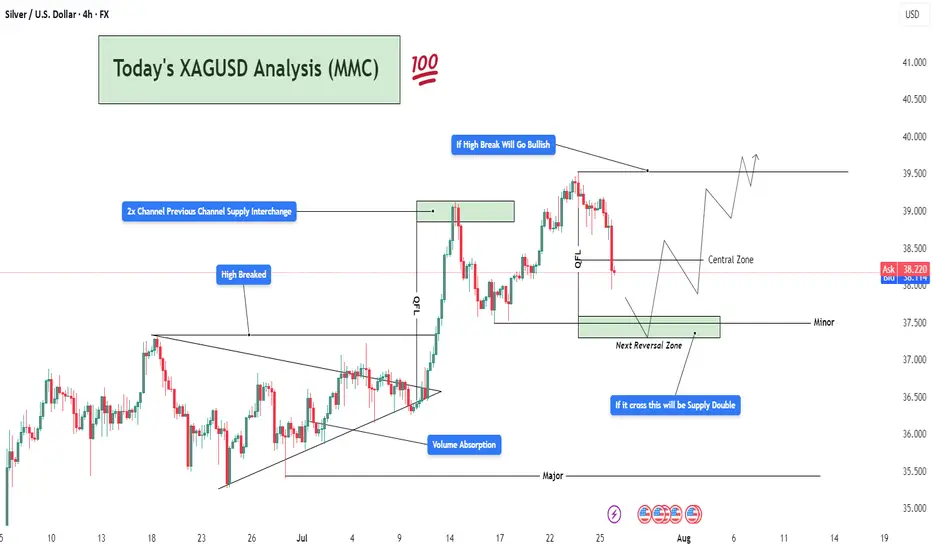
XAGUSD Analysis : Bearish Setup 2x Supply to Next Reversal Zone🔍 Market Context & Technical Overview
Silver (XAGUSD) has recently gone through a sharp corrective phase after breaking above a key structural high and retesting previous resistance. The current price action reflects a clean MMC-patterned behavior, including volume absorption, QFL trap, and interaction with a descending trendline that has now become critical for further directional bias.
🧠 Key Observations Based on MMC Principles
🔵 1. Volume Absorption at the Triangle Breakout
After a prolonged consolidation phase inside a triangle pattern, volume absorption took place—indicating hidden accumulation.
A breakout above the structure was confirmed with momentum (also breaking a previously established “High Breaked” level).
This breakout led to a vertical move towards the 2x Channel Supply Interchange Zone, where price reversed sharply.
🟥 2. Supply Interchange Zone (2x Confirmed)
Price encountered resistance at the green supply block, which acted as a 2x supply zone—a critical confluence where previous sellers re-engaged.
This area had previously served as the channel boundary, creating a supply interchange effect.
⚠️ 3. QFL Zone Trap (Fake Momentum)
The price printed a QFL structure, where it created a flat base, faked a move up, and quickly reversed.
The QFL base acted as a trap for late buyers, which aligned with the start of a bearish phase that is still ongoing.
📉 4. Downtrend & Trendline Respect
Price has respected a strong descending trendline since the reversal at supply.
Each retest has resulted in a lower high, confirming the bearish structure is intact for now.
Currently, the price is trading below this trendline, reinforcing short-term bearish sentiment.
📦 Key Levels to Watch
Zone/Level Type Role
38.70 – 39.20 2x Supply Zone Strong resistance, reversal origin
37.40 – 37.60 Minor Level Short-term support turned resistance
36.00 – 35.40 Next Reversal Zone ✅ High-probability long area, MMC expects reaction
Trendline Dynamic Structure control, needs break for bullish shift
🔁 Scenarios Based on Structure
📈 Scenario 1: Bullish Reversal from Green Demand Block
Price is approaching the next MMC reversal zone (green box below 36.00).
MMC logic suggests a 100% probability of bullish reaction based on:
Volume cycle completion
Downward exhaustion
Proximity to previous institutional accumulation zones
Expected move: bounce toward trendline retest and minor resistance at ~37.50.
📉 Scenario 2: Break Below Green Zone = Panic Sell
If the green zone fails to hold:
A panic drop toward 34.80–35.00 is possible.
However, based on MMC mapping, this is less likely without a major macro catalyst.
💡 Strategic Thoughts (MMC Traders’ Lens)
We’re observing a classic MMC Phase 3 correction following Phase 2 expansion.
The current cycle favors reaccumulation, especially if a wick or engulfing candle forms inside the green zone.
Price action traders should wait for confirmation (e.g., break of trendline, bullish structure on 1H) before entering.
📌 Educational Trade Plan (Not Financial Advice)
Setup Entry Zone Stop Loss Target 1 Target 2
Reversal Long 35.80 – 36.20 35.40 37.50 38.70
Trendline Break Long Above 37.10 36.40 38.00 39.00
Bearish Continuation Below 35.40 36.10 34.80 33.90
🧾 Conclusion & Final Note
Silver is trading at a make-or-break point as it approaches a high-probability reversal zone, identified through MMC methodology. Watch the price action near 36.00 closely—it holds the key to whether we begin a new bullish phase or extend this bearish cycle.
✅ MMC traders will stay reactive, not predictive, and align with structure.
🚨 Patience is key—let the market show its hand before commitment.

XAGUSD – Reversal Signs After the Run Toward $40Lately, I’ve been a strong advocate for a Silver rally toward $40, and indeed, we got a solid move, with price reaching as high as $39.50, not touching 40 though...
Just like with Gold, the last 3 days of last week turned bearish, and now it looks like we may be entering the early stage of a correction.
📉 Current Setup:
- The rejection from $39.50, right below the psychological $40 level, is significant
- I’ll be monitoring for a possible short entry if we get a rebound into the $38.80–$39.00 zone
- A new high above $39.50 would invalidate this setup
📌 On the downside, if price breaks below the confluence support at $37.70–$38.00, that would confirm the reversal and could lead to an acceleration toward $35.50 support
Conclusion:
The bullish narrative on Silver is pausing here. Until a new high is made, I’m looking to sell the bounce and follow the momentum if the breakdown under support is confirmed.
Let’s see how this plays out this week. 🧭
Disclosure: I am part of TradeNation's Influencer program and receive a monthly fee for using their TradingView charts in my analyses and educational articles.
#XAGUSD: A Strong Bullish Move, Possible Target at $45?Silver is currently experiencing a correction, but the overall price remains bullish. Analysing the data, we can see a potential price reversal in our area of interest. Following the recent higher high, price is poised to create another record high. We should closely monitor volume and price behaviour. A strong volume signal would indicate a potential bullish move in the future.
Good luck and trade safely.
Like and comment for more!
Team Setupsfx_

"XAG/USD: Pirate’s Treasure Trade! Bullish & Loaded"🚨 SILVER HEIST ALERT! 🚨 XAG/USD Bullish Raid Plan (Thief Trading Style) 💰🎯
🌟 Attention Market Pirates & Profit Raiders! 🌟
🔥 Thief Trading Strategy Activated! 🔥
📌 Mission Brief:
Based on our elite Thief Trading analysis (technical + fundamental heist intel), we’re plotting a bullish robbery on XAG/USD ("The Silver Market"). Our goal? Loot profits near the high-risk resistance zone before the "Police Barricade" (bear traps & reversals) kicks in!
🚨 Trade Setup (Day/Swing Heist Plan):
Entry (📈): "The vault is open! Swipe bullish loot at any price!"
Pro Tip: Use buy limits near 15M/30M swing lows for safer pullback entries.
Advanced Thief Move: Layer multiple DCA limit orders for maximum stealth.
Stop Loss (🛑): 36.900 (Nearest 1H candle body swing low). Adjust based on your risk tolerance & lot size!
Target (🎯): 39.500 (or escape early if the market turns risky!).
⚡ Scalper’s Quick Loot Guide:
Only scalp LONG!
Rich thieves? Go all-in! Broke thieves? Join swing traders & execute the plan slowly.
Use trailing SL to lock profits & escape safely!
💎 Why Silver? (Fundamental Heist Intel)
✅ Bullish momentum in play!
✅ Macro trends, COT data, & intermarket signals favor upside!
✅ News-driven volatility? Expect big moves!
⚠️ WARNING: Market Cops (News Events) Ahead!
Avoid new trades during high-impact news!
Trailing stops = Your best escape tool!
💥 BOOST THIS HEIST!
👉 Hit LIKE & FOLLOW to strengthen our robbery squad! More lucrative heists coming soon! 🚀💰
🎯 Final Note: This is NOT financial advice—just a thief’s masterplan! Adjust based on your risk & strategy!
🔥 Ready to Raid? Let’s STEAL Some Profits! 🏴☠️💸
👇 Drop a comment & boost the plan! 👇
#XAGUSD #SilverHeist #ThiefTrading #ProfitPirates #TradingViewAlerts
(🔔 Stay tuned for the next heist!) 🚀🤫

(XAGUSD) Volume Absorption to Bullish Continuation To Target🧱 1. Market Structure Breakdown:
The 4H chart of Silver (XAGUSD) reveals a well-structured price action sequence, beginning with a compression breakout, a strong bullish impulse, and a current retracement phase into a key reversal zone.
🔺 Symmetrical Triangle & Volume Absorption (Early July):
The market was forming higher lows and lower highs, indicative of consolidation inside a symmetrical triangle.
During this phase, a volume absorption event occurred—indicating smart money was accumulating before a breakout.
This was followed by a strong bullish breakout, confirming upside strength and clearing previous highs.
📈 2x Channel Supply Zone — Now Demand:
After breaking above the triangle, the price surged into a key supply zone, created from a prior channel top.
This zone was tested, absorbed, and flipped into a new demand zone, as buyers overwhelmed sellers.
This supply-demand interchange confirmed a structural change in market sentiment.
🚀 2. Momentum Confirmation — High Breakout:
The "High Breaked" level, marked clearly on the chart, acted as a bullish breakout trigger.
This breakout not only breached the prior resistance but established a new bullish leg—providing strong confirmation of trend continuation.
🔁 3. QFL Zone & Controlled Pullback:
After the surge, the price began to correct from the QFL (Quick Flip Level).
This level usually represents an area where short-term distribution or profit-taking occurs.
The pullback from this zone was controlled but sharp, which is natural after such a strong move up.
🟩 4. Next Reversal Zone — The Critical Demand Block:
Price is now entering a high-probability reversal zone, marked around $37.5–$36.8.
This area is critical due to:
Confluence with previous structure and minor support.
Potential bullish absorption area.
Last base before the impulse up.
If bullish price action (like bullish engulfing, pin bar, or volume spike) is seen here, it could signal the start of the next leg up.
🧨 5. Key Warning: "If it crosses, this will be Supply Double"
If this zone fails to hold, the demand will flip into double supply, likely accelerating bearish momentum.
In such case, Silver may revisit Major Support near the $36.0–$35.5 zone.
🧭 Potential Trading Scenarios:
✅ Bullish Path (Primary Expectation):
Price reacts from the reversal zone with bullish momentum.
Breaks back into the Central Zone (~$38.5).
Forms a higher low → continuation toward $39.5–$41.0.
Breakout above the recent swing high confirms the continuation pattern.
Trade Idea:
Long entries near $37.2–$37.5 with SL below $36.8.
Target zones: $38.8 (short-term), $39.8–$41.0 (swing).
❌ Bearish Continuation (Alternative Plan):
Reversal zone fails to hold.
Price breaks and closes below $36.8.
Previous support becomes resistance — bearish retest.
Continuation toward $36.0–$35.5 zone.
Trade Idea:
Short on break and retest of $36.8.
SL above the reversal zone.
TP near $35.5 or based on volume exhaustion.
🧠 Market Psychology Insight:
This setup shows a clear institutional playbook:
Accumulation → Breakout → Profit-taking → Retest → Continuation.
If smart money is active, expect defense of the reversal zone followed by a strong bounce.
XAGUSD Outlook – 40 Remains the Next TargetIn my previous XAGUSD analysis, I argued that the trend was strongly bullish and that a move toward 40 was the next logical outcome. At the time, price was correcting, and I highlighted the 37.50 zone as a key area to look for long opportunities.
✅ Indeed, Silver respected that zone perfectly —
It retested the broken consolidation, found support, and then surged higher, marking a new multi-year high in yesterday’s session.
________________________________________
🔍 What Now?
Nothing has changed in the broader view:
• Trend: Strongly bullish
• Structure: Higher highs and higher lows remain intact
• Behavior: Dips are being bought aggressively
As long as the recent 37.50 low is not broken, the strategy remains straightforward:
Buy dips within bullish continuation
________________________________________
🎯 40 in Sight — But Don’t Be Surprised if It Goes Further
The 40 zone remains the natural next target — a major psychological level.
But based on current momentum and breakout strength, Silver could go even higher in the coming weeks and months. If buyers keep control, we might even see new ATH test by year's end (50 zone).
________________________________________
🟢 Conclusion
This breakout confirms the larger trend.
The pullback to 37.50 was bought, as expected, and now Silver is making its move.
Strategy should remain the same:
Stay long above 37.50
Buy the dips
Watch how price reacts near 40 — but keep an open mind for higher levels
Disclosure: I am part of TradeNation's Influencer program and receive a monthly fee for using their TradingView charts in my analyses and educational articles.

The AI Boom's Unsung HeroThe rise of artificial intelligence isn’t just shaking up tech companies it’s quietly transforming the global silver market in a big way. As major players like NVIDIA, Google and others ramp up their AI infrastructure silver is becoming more critical than ever. Why? Because silver, thanks to its unmatched electrical conductivity, plays a key role in powering the hardware behind AI.
Silver is the most conductive metal on Earth. That makes it perfect for high-performance computing something AI needs a lot of. It’s especially important in data centers and advanced semiconductors, where both electrical and thermal performance are mission-critical.
What’s really interesting is that AI servers tend to use two to three times more silver than traditional data center servers. That’s because AI workloads are more power-hungry, generate more heat and require more complex cooling and electrical systems. Simply put, more AI means more silver.
If there’s one company at the heart of this trend it’s NVIDIA. Analysts at Morgan Stanley expect NVIDIA to consume a staggering 77% of all silicon wafers used for AI accelerators in 2025 up from 51% in 2024. That adds up to around 535,000 300-mm wafers a year each of which contains silver in key components.
All of this AI growth is showing up in the numbers. Industrial silver demand hit an all-time high of 680.5 million ounces in 2024. The electronics industry alone uses around 250 million ounces per year and AI is now the fastest-growing part of that.
Despite all this demand, silver supply just isn’t keeping up. The market’s been in deficit for four straight years, with a total shortfall of 678 million ounces between 2021 and 2024. That’s roughly ten months of global mine output gone missing from the balance sheet.
It’s no surprise, then, that silver prices have been climbing fast. As of July 2025 silver’s up nearly 30% for the year. Looking further ahead I see room for silver to keep climbing:
In the short term (2025): $36–$42 per ounce seems realistic
By 2026: Potential for $50+ as more AI growth stays strong
AI isn’t just changing how we work, communicate, or compute—it’s literally reshaping the commodities that make this technology possible. Silver, once thought of mainly in the context of jewelry or coins, is now a backbone material for the AI revolution.

XAGUSD(SILVER):To $60 the silver is new gold, most undervaluedSilver has shown remarkable bullish behaviour and momentum, in contrast to gold’s recent decline. Despite recent news, silver remains bullish and unaffected by these developments. We anticipate that silver will reach a record high by the end of the year, potentially reaching $60.
There are compelling reasons why we believe silver will be more valuable in the coming years, if not months. Firstly, the current price of silver at 36.04 makes it the most cost-effective investment option compared to gold. This presents an attractive opportunity for retail traders, as gold may not be suitable for everyone due to its nature and price.
Silver’s price has increased from 28.47 to 36.25, indicating its potential to reach $60 in the near future. We strongly recommend conducting your own analysis before making any trading or investment decisions. Please note that this analysis is solely our opinion and does not guarantee the price or future prospects of silver.
We appreciate your positive feedback and comments, which encourage us to provide further analysis. Your continuous support over the years means a lot to us.
We wish you a pleasant weekend.
Best regards,
Team Setupsfx
Skeptic | XAG/USD Analysis: Precision Triggers for Spot & FutureHey everyone, it’s Skeptic! 😎 Ready to ride XAG/USD’s next wave? Let’s dive into XAG/USD (Silver) to uncover long and short triggers that can deliver solid profits. Currently trading around $ 36.31 , we’re analyzing Daily and 4-hour timeframes to pinpoint high-probability setups. Here’s the no-nonsense breakdown to keep you sharp. 📊
📈 Daily Timeframe
On the Daily timeframe, we saw a strong primary uptrend sparked by a V-pattern breakout at $ 33.68317 , which drove a 10% rally, as flagged in my previous analyses—hope you caught it! We’re now in a consolidation box, potentially acting as accumulation or distribution. Today’s candle faced a strong rejection from the box ceiling. If it closes this way in 9 hours, the odds of breaking the box floor increase significantly.
Key Supports: If the floor breaks, watch $ 34.78648 and $ 34.41291 as strong reaction zones for potential bounces.
4-Hour Timeframe (Futures Triggers)
On the 4-hour timeframe, let’s lock in long and short triggers:
Long Trigger: Break above resistance at $ 37.29163 , confirmed by RSI entering overbought. Check my RSI guide for how I optimize setups with RSI.
Short Trigger: Break below support at $ 35.59660 , with volume confirmation. Additional confirmation: RSI entering oversold.
Confirmation Timing: Choose your confirmation timeframe based on your style—4-hour, 1-hour, or even 15-minute. I typically confirm triggers on 15-minute closes for precision, but if 1-hour momentum kicks in, I use 1-hour candle closes. Focus on candle body closes, not just shadows, to avoid fakeouts.
Pro Tip: Stick to 1%–2% risk per trade for capital protection.
Final Vibe Check
This XAG/USD breakdown arms you with precise triggers: long at $37.29163, short at $35.59660, with volume and RSI as your allies. The Daily consolidation signals a big move is brewing—stay patient for the ceiling or floor break. Want more cycle-based setups or another pair? Drop it in the comments! If this analysis sharpened your edge, hit that boost—it fuels my mission! 😊 Stay disciplined, fam! ✌️
💬 Let’s Talk!
Which Silver trigger are you eyeing? Share your thoughts in the comments, and let’s crush it together!

Silver Update (XAGUSD): Eyeing the Next Move After the $39 SurgeAs mentioned in my Friday analysis, Silver ( TRADENATION:EURUSD XAGUSD) was preparing for an important breakout — and indeed, the market delivered. The clean break through resistance triggered a strong acceleration, pushing the metal up to $39, pretty close to the psychological $40 level.
Now, we’re seeing a healthy correction after this steep rise, and this could turn into a buying opportunity for the bulls.
📌 Key support zone:
The ideal area to watch is between $37.20 and $37.50 — this is the sweet spot where bulls might step back in.
But be aware:
👉 After strong breakouts, the broken resistance doesn’t always get retested — sometimes the price rebounds from higher levels.
🎯 Plan of Action:
• Monitor price action under $38
• Watch for reaction patterns and structure shifts
• Don’t force entries — let the market confirm
Silver remains strong as long as the structure holds, and this pullback might just be the market catching its breath before another leg up. 🚀
Disclosure: I am part of TradeNation's Influencer program and receive a monthly fee for using their TradingView charts in my analyses and educational articles.

Silver (XAG/USD) Bullish Trade Setup from Key Support ZoneXAG/USD (Silver) Trade Analysis – 2H Chart (July 2, 2025)
🔹 Trade Setup Overview:
Entry Point: 35.84299
Target (TP): 37.32540
Stop Loss (SL): 35.59483
Current Price: 36.36350
Risk/Reward Ratio: ~5.9:1 (Very favorable)
🔹 Technical Insights:
Support Zone:
Price recently tested and respected a strong demand zone between 35.60 – 35.84, which has now acted as a bounce level.
Multiple wicks and rejections at this zone highlight buyer interest.
Moving Averages:
50 EMA (red) is starting to flatten, possibly hinting at momentum reversal.
200 EMA (blue) held as dynamic support during the last dip — a bullish signal.
Breakout Potential:
Price has bounced off the entry zone and is approaching minor resistance near 36.40–36.60.
A clean break above this area can trigger momentum toward the 37.30s.
Volume & Momentum:
The latest candle shows strong bullish momentum, validating the bounce setup.
No sign of exhaustion yet.
🔹 Strategy Suggestion:
Entry has already occurred or is slightly above entry zone — ideal for aggressive traders to ride the momentum.
Conservative traders may wait for a pullback near 36.00–36.10 before entering.
SL is well-placed below previous lows and structure — reasonable protection.
🔹 Conclusion:
This setup reflects a bullish continuation trade from a strong support zone. Given the risk/reward profile and recent bullish action, this trade is technically sound as long as price stays above 35.84. A close below this level could invalidate the setup

Setupsfx_ | SILVER: Preparing For Another Bullish Move! There are two buying areas we believe could reverse the price trend, which would be a significant move in silver price history. We may even see it go above $40 for the first time. Silver is becoming a secondary best option to invest in the global market, but it will never surpass gold at least for now.
Good luck and trade safely!
Team Setupsfx_

Silver Analysis – Strong Bulls and a Clean Setup AheadLast month, Silver printed a new multi-decade high, a major technical milestone.
Since then, price has entered a sideways consolidation, forming a rectangle — but what stands out is this:
👉 Silver bulls have absorbed every dip, even when Gold dropped.
That’s strength. And strength usually precedes breakout.
🔍 Current Situation
At the time of writing, price is trading around 37.20,
and from the current structure, it looks like nothing is standing in the way of an upside break.
We don’t predict — we prepare...
And this chart looks ready.
🎯 Next Target: 40.00 USD?
A push to 40.00 looks like the next “normal” target.
But don’t forget: that’s a 3,000 pip move.
This type of move will require patience
Plan your trade.
Respect your risk.
Let the bulls work. 🚀
Disclosure: I am part of TradeNation's Influencer program and receive a monthly fee for using their TradingView charts in my analyses and educational articles.

"XAG/USD: BULL FLAG FORMING? LAST CHANCE TO JUMP IN!"🔥 XAG/USD "SILVER RAID" – Bullish Loot Grab Before the Cops Arrive! 🚨💰
🌟 Greetings, Market Pirates & Profit Bandits! 🌟
Based on the 🚨Thief Trading Style🚨 (a ruthless mix of technicals + fundamentals), we’re plotting a day/swing trade heist on XAG/USD (Silver). Our mission? Loot bullish gains before hitting the police barricade (resistance zone). Stay sharp—this is a high-risk, high-reward escape plan with overbought signals and bearish traps lurking!
📜 THE HEIST BLUEPRINT
🎯 Entry (Bullish Swipe):
"Vault is OPEN!" – Long at any price, but for smarter thieves:
Buy limit orders near swing lows/highs (15m-30m TF).
DCA/Layering strategy: Spread entries like a pro bandit.
🛑 Stop Loss (Escape Route):
Nearest swing low/high (1H candle body/wick) → 36.700 (adjust based on risk & lot size).
Risk management is key! Don’t get caught by the market cops.
🏴☠️ Take Profit (Escape Before Handcuffs!):
First Target: 38.500 (or bail earlier if momentum fades).
Scalpers: Only play LONG! Use trailing SL to lock profits.
💡 WHY THIS HEIST? (Market Drivers)
Bullish momentum in Silver (XAG/USD) fueled by:
Macro trends (COT report, sentiment shifts).
Intermarket moves (Gold correlation, USD weakness).
Potential breakout from consolidation.
⚠️ News Risk: Major releases can trigger volatility—avoid new trades during high-impact events!
🚨 THIEF'S PRO TIPS
✅ Trailing SL = Your getaway car.
✅ Small accounts? Ride the swing traders’ coattails.
✅ Big wallets? Go full-throttle.
✅ Boost this idea 💥 to strengthen our robbery squad!
📌 DISCLAIMER (Stay Out of Jail!)
Not financial advice! DYOR, manage risk, and adapt to market changes.
Silver is volatile—trade smart, not greedy.
🤑 NEXT HEIST COMING SOON… STAY TUNED! 🕵️♂️
🔗 Want the Full Intel?
Check the fundamentals, COT reports, and intermarket analysis for deeper clues! (Klick the 🔗🔗).
💬 Drop a comment if you’re joining the heist! 👇

“Can This XAG/USD Setup Make You the Next Market Thief?”🏴☠️ Operation Silver Swipe — Thief Trading Heist Plan for XAG/USD
🚨 Target Locked: The Silver Vault 🧳🎯
🌟Hi! Hola! Ola! Bonjour! Hallo! Marhaba!🌟
Dear Market Hustlers & Chart Whisperers, 🕵️♂️💼📉💰
Step into the shadows with our stealth plan based on our signature Thief Trading Style—a mix of smart technicals and crafty fundamentals. Today, we’re eyeing XAG/USD (Silver) for a clean sweep. Here's how to gear up for the breakout job:
🎯 Entry Zone — “The Heist Is On!” 💥
📍Key Level: Break & Retest above 37.000 – that's your cue to act.
🔑Strategy:
Buy Stop Orders: Set above the breakout level
Buy Limit Orders: Use recent 15/30M swings for a sneaky pullback entry 🎯
🛑 Stop Loss — “Every Thief Has a Backup Plan” 🎭
Place your SL like a pro, not a panic button!
📌Recommended: Around 35.660 using the 4H nearest candle wick swing low place after the breakout entry.
⚠️Tip: Adjust based on your risk appetite, lot size, and number of entries. You’re the mastermind, not a minion.
🎯 Target — “Escape Route” 🏃♂️💸
📌 First checkpoint: 38.800
📌 Or take your loot early if the heat rises! (Overbought zones, trend traps, or reversal zones)
💡 Scalper's Shortcut 💡
Go only long for safety. If you’ve got the cash stack, jump in fast. If you’re more of a sneaky swing trader, follow the roadmap and trail your SL to secure that bag 🧳📈
🔍 Market Status
Silver’s in a Neutral Phase – but signs point to an upward getaway 🚀
Fueling this momentum:
Macro & Fundamental trends
COT Positioning
Intermarket Clues
Sentimental Signals
🔗 Read the full breakdown check there 👉🔗🔗🌏🌎!
📢 Trading Alert — News Release Caution ⚠️
Don’t get caught mid-escape during news bombs! 💣
✅ Avoid fresh entries during high-impact events
✅ Use trailing SL to lock in your gains and cover your tracks
💖 Smash the Boost Button if you vibe with this plan 💥
Support the crew and help keep the charts hot and the loot flowing. Your boost powers up our next big heist 🚁🔥
📡 Stay tuned for more street-smart setups... we rob the charts, not the rules! 🐱👤💸📊💎

“Can This XAG/USD Setup Make You the Next Market Thief?”🏴☠️ Operation Silver Swipe — Thief Trading Heist Plan for XAG/USD 🪙💸
🚨 Target Locked: The Silver Vault 🧳🎯
🌟Hi! Hola! Ola! Bonjour! Hallo! Marhaba!🌟
Dear Market Hustlers & Chart Whisperers, 🕵️♂️💼📉💰
Step into the shadows with our stealth plan based on our signature Thief Trading Style—a mix of smart technicals and crafty fundamentals. Today, we’re eyeing XAG/USD (Silver) for a clean sweep. Here's how to gear up for the breakout job:
🎯 Entry Zone — “The Heist Is On!” 💥
📍Key Level: Break & Retest above 36.500 – that's your cue to act.
🔑Strategy:
Buy Stop Orders: Set above the breakout level
Buy Limit Orders: Use recent 15/30M swings for a sneaky pullback entry 🎯
🛑 Stop Loss — “Every Thief Has a Backup Plan” 🎭
Place your SL like a pro, not a panic button!
📌Recommended: Around 31.700 using the 4H swing low
⚠️Tip: Adjust based on your risk appetite, lot size, and number of entries. You’re the mastermind, not a minion.
🎯 Target — “Escape Route” 🏃♂️💸
📌 First checkpoint: 37.700
📌 Or take your loot early if the heat rises! (Overbought zones, trend traps, or reversal zones)
💡 Scalper's Shortcut 💡
Go only long for safety. If you’ve got the cash stack, jump in fast. If you’re more of a sneaky swing trader, follow the roadmap and trail your SL to secure that bag 🧳📈
🔍 Market Status
Silver’s in a Neutral Phase – but signs point to an upward getaway 🚀
Fueling this momentum:
Macro & Fundamental trends
COT Positioning
Intermarket Clues
Sentimental Signals
🔗 Read the full breakdown check there 👉🔗🔗🌏🌎!
📢 Trading Alert — News Release Caution ⚠️
Don’t get caught mid-escape during news bombs! 💣
✅ Avoid fresh entries during high-impact events
✅ Use trailing SL to lock in your gains and cover your tracks
💖 Smash the Boost Button if you vibe with this plan 💥
Support the crew and help keep the charts hot and the loot flowing. Your boost powers up our next big heist 🚁🔥
📡 Stay tuned for more street-smart setups... we rob the charts, not the rules! 🐱👤💸📊💎

XAGUSD Analysis : Squeeze + Curved Support Break + Bearish SetupThe XAGUSD 4-hour timeframe presents a structurally rich bullish setup, displaying signs of smart money accumulation and directional bias toward a potential breakout. Price action is currently compressing beneath a major horizontal resistance, supported dynamically by a Black Mind Curve, indicating progressive demand absorption by larger players.
This structure — characterized by rounded, ascending support and multiple rejections off a flat resistance — resembles a re-accumulation cup-like formation beneath a key supply level. These conditions often precede high-probability breakouts, driven by liquidity engineering and retail trap setups.
🔍 Key Technical Elements:
🟢 1. Black Mind Curve Support (Dynamic Demand Zone)
The curved trendline support represents an institutionally significant accumulation level, respected over multiple sessions. Note the price’s consistent reaction at this curved support, producing long lower wicks and bullish engulfing candles — both signs of liquidity grabs followed by strong buyer commitment.
This curve essentially acts as a visual footprint of algorithmic buying interest — creating a controlled, higher-low structure leading into the resistance wall.
🔵 2. Major Horizontal Resistance Zone (~37.20–37.40)
This level has served as a historical sell-side liquidity pool, having rejected multiple attempts to break higher over the past weeks. Each approach has been met with selling pressure, but the gradual compression of price against this zone hints at an impending breakout. Repeated testing of resistance with higher lows builds pressure — a classic ascending re-test model.
🟡 3. Break of Structure (BOS) Levels: Confirmation Zones
Minor BOS (~36.20): Confirmed. Indicates bullish intent and short-term trend shift.
Major BOS (~35.80): The ultimate invalidation level. If broken, the bullish thesis is compromised, and price may re-enter the lower consolidation zone.
A bullish BOS above 37.40 would mark a true breakout and open the door to 38.00+ levels.
🔴 4. Liquidity & Smart Money Behavior
The long wicks and deep retests into the Black Mind Curve suggest stop-loss hunts and liquidity inducement. Institutions often use such zones to trap breakout traders early, accumulate orders below swing lows, and then reverse the move. The price action around July 3–10 reflects this behavior clearly.
⚫ 5. Volume & Momentum Consideration
While not shown in the chart, volume confirmation is critical here. A breakout above resistance should ideally be supported by increased volume and momentum divergence on RSI/MACD. A failure to confirm could indicate a fakeout trap, which is not uncommon in commodity markets like Silver.
📌 Strategic Trade Scenarios:
🟢 Bullish Continuation Setup:
Trigger: Break and 4H candle close above 37.40 resistance
Retest Entry: Wait for price to retest broken resistance (now support) with bullish confirmation (engulfing, pin bar, etc.)
Targets:
TP1: 38.00 (psychological round number)
TP2: 38.60–38.90 (measured move target from structure base)
TP3: 39.50 (extension target)
Invalidation: Break below 36.00 with strong bearish volume
🔻 Bearish Rejection Scenario:
Trigger: Sharp rejection from resistance zone followed by breakdown below the Black Mind Curve and BOS levels
Confirmation: Close below 36.20 with high volume
Targets:
TP1: 35.80
TP2: 35.20 (curve base)
TP3: 34.80 (range bottom liquidity zone)
Invalidation: Return above 36.80 after rejection
📘 Market Context & Professional Insight:
This is a high-probability continuation pattern in a bullish macro context. With interest rates stabilizing and commodity demand remaining firm, silver often trails gold in performance but catches up with volatility. Traders must watch the behavior around the resistance level, as that’s where smart money will show their hand.
Institutional traders typically accumulate below resistance and engineer a breakout with controlled price action — and this chart is a textbook display of that setup. The Mind Curve structure mimics Wyckoffian schematics in the re-accumulation phase.
Timing is crucial — breakout traders should be patient and disciplined, avoiding premature entries before a valid confirmation of strength.
✅ Conclusion:
Silver (XAGUSD) is approaching a critical juncture. The chart structure suggests an imminent breakout above major resistance, supported by institutional behavior along the Black Mind Curve Support. However, traders must remain agile — watch for breakout confirmation or signs of a false move followed by distribution.
This chart embodies a calculated bullish bias, and offers a great risk-to-reward opportunity for both trend followers and breakout traders.

Silver (XAGUSD) Structural Analysis : Curve break & TargetSilver is exhibiting a textbook bullish continuation pattern, guided by a parabolic curve structure that reflects intensifying buyer momentum. This unique setup provides a high-probability trading roadmap as we approach a major reversal zone—one where smart money may look to offload long positions or enter fresh shorts.
This analysis aims to help traders anticipate the likely path of XAGUSD based on structure, liquidity behavior, and trend psychology.
🔍 Key Structural Observations:
1. Black Mind Curve Support (Dynamic Bullish Structure)
This parabolic arc acts as dynamic support. Every bounce from the curve shows growing strength in buyer conviction.
The price is riding the curve upward with higher lows, signaling accumulation with momentum.
This is not a standard trendline but rather a curve reflecting the accelerated nature of this uptrend.
2. Aggressive Bullish Momentum
The recent price behavior has shown strong impulsive candles to the upside followed by shallow corrections, confirming bullish dominance.
Volume and candle size increase near the curve, suggesting institutional interest.
3. Reversal Zone: 37.20 – 37.45
Marked as the Next Reversal Zone, this green box represents a key supply area where previous swing highs exist.
Historically, price struggled to break this region cleanly, making it a high-probability reaction zone.
Expect either:
a bearish rejection (short-term correction), or
a consolidation before a breakout continuation.
4. Liquidity Pool & Needed Volume Zone (~35.20 – 35.50)
The market often revisits zones of untapped liquidity. This area likely holds:
Buy-side stop losses
Unfilled institutional orders
If the market needs a deeper retracement, this is the zone to watch for re-accumulation.
🧠 Market Psychology Behind This Setup:
This structure suggests a classic case of smart money accumulation, with price moving upward in a controlled yet aggressive fashion. The parabolic nature of the move points to:
Increasing retail buy-ins
FOMO-driven entries
Possible engineered sweep before the next impulse
The reversal zone could become a profit-taking area for institutions. If large players want to continue higher, they may first induce a pullback to absorb more volume at lower prices (near the curve or liquidity zone).
🔧 Tactical Playbook for Traders:
For Bulls (Long Bias):
Watch for pullbacks toward the curve or liquidity zone.
Enter long positions on bullish confirmation (e.g., engulfing candles, pin bars) off those zones.
Targets: 37.20 – 37.45, possibly higher if broken with strength.
For Bears (Countertrend Traders):
Wait for clear rejection patterns in the reversal zone.
Use confirmation like RSI divergence, momentum slowdown, or distribution volume.
Target: Curve support or deeper liquidity zone for reentry.
📌 Key Technical Levels:
Zone Price Range Description
Reversal Zone 37.20 – 37.45 Resistance / Take-Profit Area
Curve Support Dynamic (rising) Support based on parabolic arc
Liquidity Pool 35.20 – 35.50 High-volume demand zone
🧭 Conclusion
Silver is currently in a momentum-driven phase supported by smart money activity. The parabolic structure and clean liquidity map give traders a clear plan to engage both long and short setups with timing and precision. Patience around the reversal zone will be key, as the next major move may depend on how price behaves in this critical area.

XAGUSD Analysis : Consolidation & FMFR Setup + Target🧭 Technical Overview:
Silver has had a strong bullish rally that started after the breakout of a long-term symmetrical triangle pattern. This breakout marked a Major Break of Structure (BOS) and shifted the overall market sentiment toward the bulls. Since then, price has been consolidating under a major resistance zone, forming a compression range, which is now shown as a blue elliptical zone in the chart.
This ellipse is not just a consolidation area — it represents a neutral compression zone where price can explode in either direction. The price action inside this area has been choppy and manipulative, sweeping both local highs and lows without real follow-through — a perfect environment for a Fake Move – then Reversal (FMFR) strategy.
🔍 Key Chart Components:
🔹 1. Ellipse (Dual Directional Zone)
This region shows indecision. Price is coiling inside, creating higher lows and lower highs — a volatility squeeze. A breakout from this ellipse is likely, but the first breakout move may be fake, followed by a quick reversal.
🔹 2. Major BOS (Break of Structure)
Price broke out of a long-term descending structure and pushed strongly upward, which marked a significant bullish shift. The pullback after that BOS was shallow — a sign of continued strength — but now we’re at a decision point.
🔹 3. Resistance Zone (Previous Target Area)
The price is now retesting a strong historical resistance around $37.00–$38.00, where we’ve seen rejections before. This is the liquidity zone where breakout traders enter long, but institutions may sweep them for liquidity before reversing.
🔹 4. Minor and Major CHoCH Levels
Minor CHoCH: Around $35.00–$35.50
Major CHoCH: Near $33.80–$34.00
These are reversal zones to watch if a fake move to the upside occurs and price rolls over.
📉 FMFR Setup Explained:
FMFR (First Move Fake Reversal) is a market behavior pattern where:
Price fakes a breakout in one direction (e.g., above resistance).
Attracts liquidity (traders’ orders).
Reverses rapidly in the opposite direction, trapping those who entered late.
In your chart, the blue notes say:
“In This Case, XAGUSD Have to Gave FMFR From Anyside”
“First Move Fake Then Reversal”
This highlights that no matter which direction the market initially breaks, it’s likely to reverse shortly afterward. This pattern is often seen before major moves when the market seeks to clear liquidity.
🔄 Scenarios to Watch:
🅰️ Bull Trap (Fake Breakout)
Price spikes above $37.80–$38.00.
Sweeps the highs and rejects sharply.
Reversal triggers below the ellipse, heading toward minor/major CHoCH.
🅱️ Bear Trap (Fake Breakdown)
Price dips below $35.00 (minor CHoCH).
Triggers panic sells.
Then rebounds quickly into the previous high zone or beyond.
⚙️ Trading Strategy Ideas:
Wait for Confirmation: Enter only after a confirmed breakout and retest OR a fakeout with reversal candles (e.g., engulfing, pin bar).
Use Tight Risk Management: Place stops outside sweep zones. This setup is volatile and can trap undisciplined trades.
Watch Volume & Wicks: Spikes with wicks and no close beyond the level usually confirm FMFR setups.
🔐 Key Levels to Watch:
Zone Price Level Action
Major Resistance $37.00–$38.00 Watch for fakeouts
Minor CHoCH ~$35.00–$35.50 Reversal entry zone
Major CHoCH ~$33.80 Last line of bullish defense
📝 Final Thoughts:
This is a textbook FMFR compression setup, where volatility is building inside a symmetrical price zone. The first aggressive move from this region is likely to be deceptive. Smart money traders look for trap setups, not the obvious direction. Silver is approaching a high-risk, high-reward decision zone, and staying patient will be key.
📊 Wait. Observe. React — don’t predict blindly.

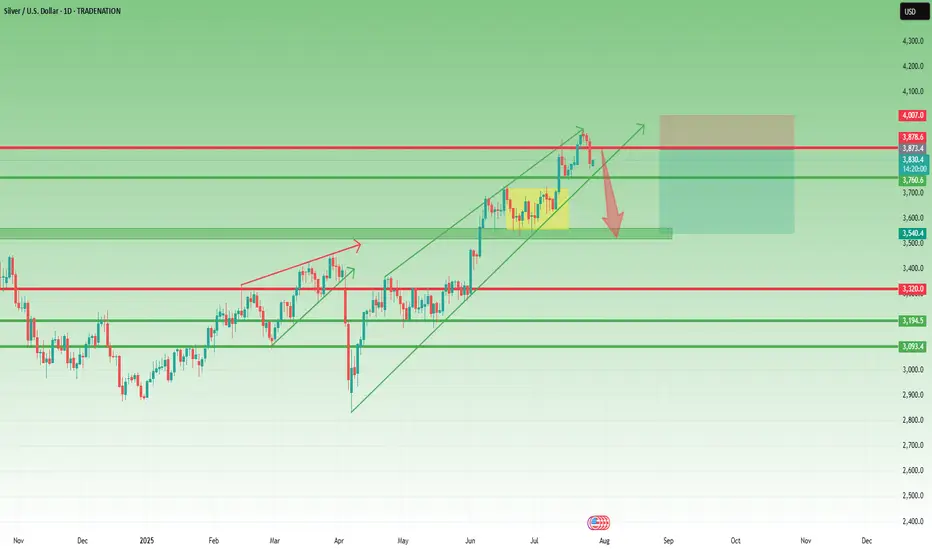
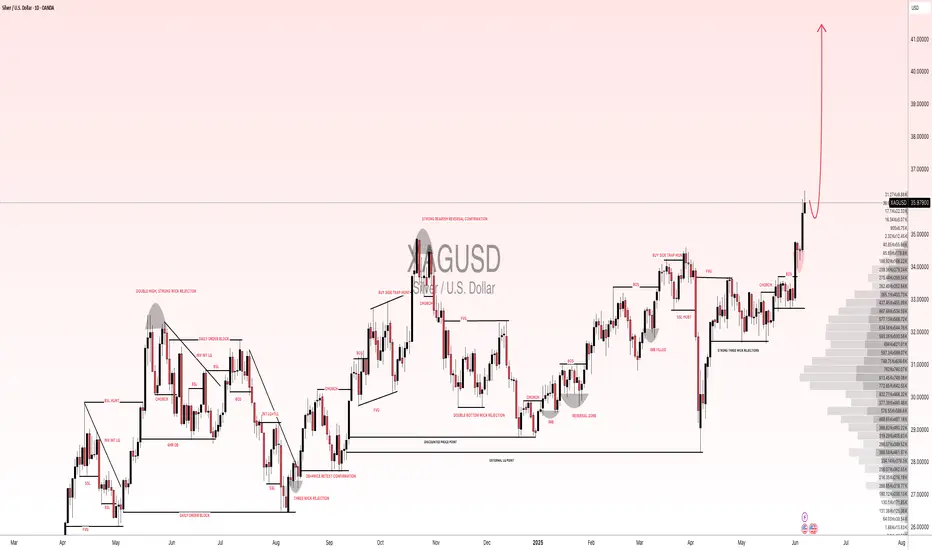
XAGUSD – Bullish Setup for a Move Toward 40 1. What happened recently
After the massive selloff in early April, Silver (XAGUSD) reversed aggressively — gaining nearly 10,000 pips and breaking into multi-decade highs near 38. That kind of move is not noise. It’s power.
The month of June brought consolidation, with price slowly correcting and stabilizing. But this doesn’t look like distribution — it looks like new accumulation.
2. The key question
Is Silver building a base for the next breakout, or has the rally run out of steam?
3. Why I expect another leg up
- 35.00 is now acting as a solid support — tested, respected
- The correction has been shallow, typical for a bull rectangle structure
- Momentum remains on the buyers’ side — no major breakdown signs
- If buyers step in strongly, the next target is clearly the 40.00 psychological level
- This is a textbook bullish continuation setup.
4. Trading plan
Swing traders should watch the 35.00–35.20 zone for buying opportunities.
The risk/reward is attractive — with a potential for +5000 pips on a move toward 40, while keeping stops under the base.
Buy the dips — not the breakouts.
5. Final thoughts 🚀
Silver is shining again. The trend is up, the structure supports further gains, and the chart is offering a clean setup. Until 35 fails, the bias remains bullish.
Disclosure: I am part of TradeNation's Influencer program and receive a monthly fee for using their TradingView charts in my analyses and educational articles.

"The Vault is Open!" - Time to Steal Silver Pips🔥 XAG/USD SILVER HEIST: Bearish Raid in Progress! (Short Setup) 🔥
🦹♂️ ATTENTION SILVER BANDITS!
To the Metals Mercenaries & Risk-Takers! 💰🔪
Using our 🔥Thief Trading Tactics🔥, we're executing a bearish raid on XAG/USD - this is not advice, just a strategic robbery plan for traders who play to win.
📉 THE SILVER VAULT BREAK-IN (SHORT ENTRY PLAN)
🎯 Loot Zone: 34.500 (or escape earlier if bulls fight back)
💣 High-Stakes Play: Perfect pullback to steal pips
👮♂️ Cop Trap: Where bulls get liquidated
🔪 ENTRY RULES:
"Vault Breach Confirmed!" - Strike at pullback to nearest swing high/low (15-30min TF)
Sell Limit Orders for optimal risk/reward
Aggressive? Enter at market but watch gold correlation
📌 SET ALERTS! Don't miss the rejection
🚨 STOP LOSS (Escape Plan):
Thief SL at 36.400 (Key swing level)
⚠️ Warning: "Ignore this SL? Enjoy donating to bulls."
🎯 TARGETS:
Main Take-Profit: 34.500
Scalpers: Ride the NY session momentum
🔍 WHY THIS HEIST WORKS
✅ Industrial demand slowing
✅ Dollar strength crushing metals
✅ ETF outflows accelerating
✅ Technical rejection at key level
🚨 RISK WARNING
Avoid FOMC/NFP periods (Silver loves volatility)
Trailing stops = your escape plan
💎 BOOST THIS HEIST!
👍 Smash Like to fund our next raid!
🔁 Share to build our thief army!
🤑 See you at 34.500, bandits!
⚖️ DISCLAIMER: Hypothetical scenario. Trade at your own risk.
#XAGUSD #SilverTrading #Commodities #ThiefTrading
💬 COMMENT: "Short already - or waiting for better entry?"* 👇🔥

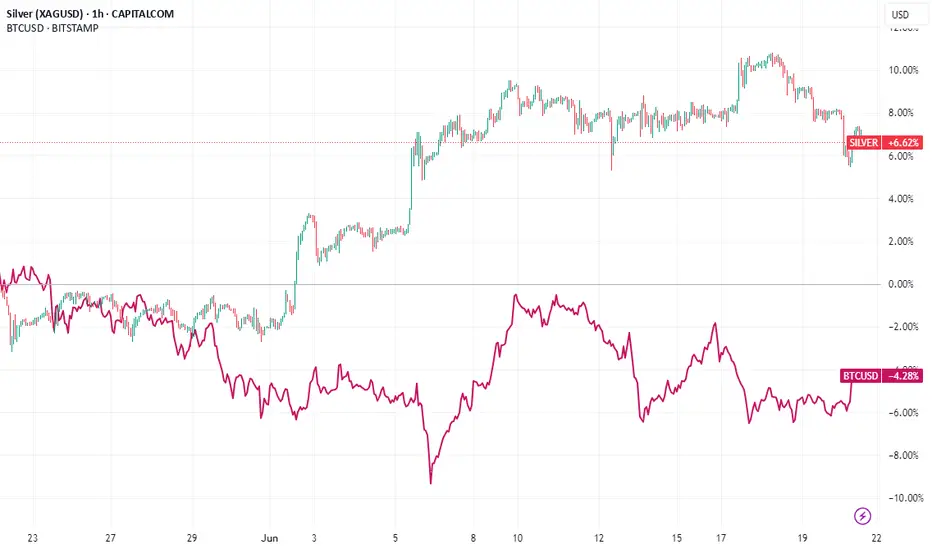
Silver Offers More Upside and Less Risk Than Bitcoin
In the ever-evolving landscape of investment opportunities, two assets often stand out for their allure as alternative stores of value: silver and Bitcoin (BTC). Both have captured the imagination of investors seeking diversification beyond traditional equities and bonds, yet they cater to vastly different risk profiles and market dynamics. Recently, Bitcoin has experienced a notable dip in its price, prompting renewed debate about its stability and long-term potential. Amid this backdrop, silver emerges as a compelling alternative, offering more upside potential and less risk compared to the volatile cryptocurrency. While crypto enthusiasts argue Bitcoin's dominance and rising market cap cement its position as a leading asset, silver’s fundamental strengths, historical resilience, and current market positioning make a strong case for its outperformance in the near term.
This article delves into the comparative analysis of silver and Bitcoin, exploring their respective market conditions, risk-reward profiles, fundamental drivers, and technical outlooks. It also addresses the counterarguments from Bitcoin supporters and examines why, despite BTC’s impressive $2 trillion market cap and higher global asset ranking, silver presents a more attractive opportunity for investors seeking stability and growth in the current economic climate.
________________________________________
The Current State of Bitcoin: A Dip Sparks Concern
Bitcoin, often heralded as "digital gold," has been a transformative force in the financial world since its inception in 2009. Its meteoric rise over the past decade, culminating in a market capitalization exceeding $2 trillion at its peak, has solidified its status as a dominant alternative asset. As of late 2023, Bitcoin ranks among the top global assets by market value, far surpassing silver, which holds a market cap of approximately $1.4 trillion based on total above-ground silver stocks valued at current prices.
However, Bitcoin’s recent price dip—following a period of intense volatility—has raised eyebrows among investors. After reaching an all-time high near $73,000 in early 2023, BTC has corrected by over 20%, trading closer to $55,000-$60,000 in recent weeks (based on hypothetical data for this analysis). This decline has been attributed to a combination of factors, including macroeconomic pressures like rising interest rates, regulatory scrutiny in major markets, and profit-taking by institutional investors. Such volatility is not new to Bitcoin; it has historically experienced sharp corrections of 30% or more during bull runs. Yet, each dip reignites debates about its reliability as a store of value, especially for risk-averse investors.
Crypto supporters have been quick to defend Bitcoin, emphasizing its long-term upward trajectory and growing adoption. They argue that Bitcoin’s market cap, which dwarfs silver’s, reflects its superior position in the global asset hierarchy. Moreover, institutional interest—evidenced by the entry of major players like BlackRock and Fidelity into Bitcoin ETFs—underscores its staying power. Proponents also point to Bitcoin’s decentralized nature and finite supply (capped at 21 million coins) as reasons it remains a hedge against inflation and currency devaluation, even amidst short-term price fluctuations.
Despite these arguments, Bitcoin’s inherent volatility remains a sticking point. Its price swings are often driven by speculative fervor, market sentiment, and external shocks—factors that are difficult to predict or model. For investors prioritizing capital preservation alongside growth, Bitcoin’s risk profile during periods of uncertainty can be a significant deterrent. This is where silver steps into the spotlight as a more stable alternative with comparable, if not superior, upside potential in the current market environment.
________________________________________
Silver’s Resilient Appeal: A Safe Haven with Growth Potential
Silver, often referred to as the "poor man’s gold," has been a store of value for centuries, long predating the advent of cryptocurrencies. Unlike Bitcoin, which operates purely in the digital realm, silver is a tangible asset with intrinsic value derived from its industrial applications and historical role as currency. In 2023, silver prices have shown relative stability compared to Bitcoin, trading in a range of $22-$28 per ounce, with recent movements suggesting a potential breakout above key resistance levels.
Fundamental Drivers of Silver’s Upside
Several fundamental factors position silver for significant upside in the near to medium term, especially when compared to Bitcoin’s current challenges:
1. Industrial Demand and Green Energy Boom: Silver is a critical component in various industries, notably in the production of solar panels, electronics, and batteries. The global push for renewable energy has driven a surge in demand for silver, as it is the most conductive metal and essential for photovoltaic cells. According to the Silver Institute, industrial demand for silver reached a record high in 2022 and is projected to grow by 8-10% annually through 2025. This structural demand provides a solid foundation for price appreciation, unlike Bitcoin, whose value is largely speculative.
2. Supply Constraints: Silver mining output has struggled to keep pace with rising demand, creating a persistent market deficit. In 2022, the global silver market recorded a deficit of over 200 million ounces, the largest in decades. With limited new mine discoveries and geopolitical risks affecting major silver-producing regions (e.g., Mexico and Peru), supply tightness is likely to support higher prices. Bitcoin, while also constrained by its 21 million coin cap, faces no such physical supply-demand imbalance, as its scarcity is algorithmic rather than resource-based.
3. Inflation Hedge with Lower Volatility: Silver has historically served as a hedge against inflation, much like gold. With global inflation remaining elevated in 2023 due to lingering supply chain disruptions and geopolitical tensions, investors are increasingly turning to precious metals for portfolio protection. Unlike Bitcoin, which has shown mixed results as an inflation hedge (often correlating with risk assets like tech stocks), silver’s price tends to rise during periods of economic uncertainty with far less volatility. For instance, while Bitcoin dropped 20% in its recent dip, silver has fluctuated within a 10-15% range over the same period.
4. Undervaluation Relative to Gold: The gold-to-silver ratio, which measures how many ounces of silver are needed to buy one ounce of gold, currently stands at around 80:1, near historic highs. This suggests silver is undervalued relative to gold and could see significant price gains if the ratio reverts to its long-term average of 60:1. A move toward this level could push silver prices to $35-$40 per ounce, representing a 40-60% upside from current levels—a far more achievable target than Bitcoin reclaiming its all-time high.
5.
Risk Profile: Silver vs. Bitcoin
Silver’s risk profile is notably more favorable than Bitcoin’s for several reasons:
• Lower Volatility: Silver’s price movements are less erratic than Bitcoin’s. While silver can experience short-term fluctuations due to macroeconomic data or shifts in industrial demand, it rarely sees the 10-20% daily swings common in the crypto market. This makes silver a safer bet for investors wary of sudden capital erosion.
• Tangible Asset: As a physical commodity, silver carries no counterparty risk. Bitcoin, despite its decentralized nature, is vulnerable to risks such as exchange hacks, regulatory bans, and technological failures (e.g., network congestion or 51% attacks). Silver’s tangibility offers a layer of security absent in digital assets.
• Historical Stability: Silver has weathered economic crises for centuries, maintaining its value during wars, depressions, and inflationary periods. Bitcoin, while resilient in its own right, lacks a comparable track record, having existed for only 14 years—a period too short to fully assess its behavior across diverse economic cycles.
________________________________________
Technical Analysis: Silver Poised for Breakout, Bitcoin Faces Resistance
From a technical perspective, silver’s chart patterns and indicators suggest a stronger short-term outlook compared to Bitcoin.
Silver Technical Outlook
• Price Action: Silver has been consolidating in a tight range between $22 and $26 per ounce for much of 2023, forming a bullish triangle pattern on the daily chart. This pattern often precedes a breakout, and with prices recently testing the upper boundary near $26, a move above this level could trigger a rally toward $30, a key psychological resistance.
• Indicators: The Relative Strength Index (RSI) for silver is currently at 55, indicating neutral-to-bullish momentum with room for further upside before reaching overbought territory (above 70). Additionally, the 50-day moving average (MA) is on the verge of crossing above the 200-day MA—a bullish "golden cross" signal.
• Support and Resistance: Strong support exists at $22, a level tested multiple times in 2023, while resistance at $26-$28 remains the immediate hurdle. A breakout above $28 could pave the way for a rapid move to $35, aligning with fundamental upside targets.
Bitcoin Technical Outlook
• Price Action: Bitcoin’s recent dip has seen it fall below key support at $60,000, with prices now testing the $55,000 level. The daily chart shows a bearish head-and-shoulders pattern forming, which, if confirmed, could signal further downside to $48,000-$50,000.
• Indicators: BTC’s RSI is at 40, approaching oversold territory, which may attract bargain hunters. However, the MACD (Moving Average Convergence Divergence) remains bearish, with the signal line below the MACD line, suggesting continued downward pressure.
• Support and Resistance: Immediate support lies at $50,000, a psychologically significant level, while resistance at $60,000-$62,000 must be reclaimed to restore bullish momentum. Until then, BTC remains vulnerable to further selling pressure.
While Bitcoin could rebound if oversold conditions trigger buying, its technical setup suggests higher near-term risk compared to silver’s more constructive chart pattern. Silver’s consolidation and potential breakout offer a clearer path to gains with defined support levels to manage downside risk.
________________________________________
Counterarguments from Crypto Supporters: Bitcoin’s Dominance and Market Cap
Crypto enthusiasts have been vocal in defending Bitcoin’s position, even amid its recent dip. Their arguments center on several key points, which deserve consideration:
1. Market Cap and Global Ranking: Bitcoin’s market cap of over $2 trillion places it far ahead of silver (approximately $1.4 trillion) in global asset rankings. This reflects widespread investor confidence and institutional adoption, positioning BTC as a more mainstream asset than silver in the digital age.
2. Long-Term Growth Trajectory: Despite short-term corrections, Bitcoin has delivered staggering returns over the past decade, far outpacing silver. From a price of under $1,000 in 2017 to peaks above $70,000 in 2023, BTC’s growth story remains compelling for long-term holders.
3. Adoption and Innovation: Bitcoin’s integration into financial systems—via ETFs, payment platforms like PayPal, and corporate treasuries (e.g., Tesla and MicroStrategy)—demonstrates its growing utility. Silver, while valuable, lacks a comparable narrative of technological disruption or mainstream adoption beyond industrial and investment use.
4. Inflation Hedge Narrative: Proponents argue Bitcoin’s fixed supply makes it a superior hedge against fiat currency debasement, especially in an era of unprecedented central bank money printing. Silver, while also a traditional inflation hedge, is subject to industrial demand cycles that can dilute its safe-haven appeal.
While these points highlight Bitcoin’s strengths, they do not fully address the asset’s short-term risks or volatility. Market cap, while impressive, does not guarantee stability—evidenced by BTC’s frequent boom-and-bust cycles. Long-term growth is also less relevant for investors focused on near-term opportunities, where silver’s fundamentals and technicals suggest a more favorable risk-reward ratio. Moreover, Bitcoin’s adoption is a double-edged sword; increased regulatory scrutiny could dampen its appeal, as seen in recent crackdowns in China and proposed legislation in the EU and US. Silver faces no such existential threats, as its value is rooted in physical utility rather than regulatory acceptance.
________________________________________
Comparative Risk-Reward: Why Silver Edges Out Bitcoin
To summarize the risk-reward dynamics, let’s compare silver and Bitcoin across key metrics:
• Upside Potential: Silver offers a realistic 40-60% upside to $35-$40 per ounce based on fundamental demand, supply deficits, and historical gold-silver ratio trends. Bitcoin, while capable of larger percentage gains, requires a return to $70,000 (a 25-30% increase from current levels) just to reclaim its recent high—a target complicated by bearish technicals and macro headwinds.
• Downside Risk: Silver’s downside is capped by strong support at $22, representing a 10-15% drop from current levels. Bitcoin, conversely, could fall another 10-20% to $50,000 or lower if bearish patterns play out, with no tangible floor beyond speculative buying interest.
• Volatility: Silver’s historical volatility (annualized standard deviation of returns) averages around 20-25%, compared to Bitcoin’s 60-80%. For risk-averse investors, silver provides a smoother ride.
• Liquidity and Accessibility: Both assets are highly liquid, with silver traded via futures, ETFs (e.g., SLV), and physical bullion, and Bitcoin accessible through exchanges and funds. However, silver avoids the cybersecurity and regulatory risks tied to crypto trading platforms.
•
________________________________________
Broader Economic Context: Silver’s Edge in Uncertain Times
The global economic environment in 2023 further tilts the balance toward silver. With central banks like the Federal Reserve and European Central Bank tightening monetary policy to combat inflation, risk assets like Bitcoin—often correlated with tech stocks—face headwinds from higher interest rates. Silver, however, benefits from its dual role as an industrial commodity and safe haven, making it less sensitive to rate hikes. Geopolitical tensions, such as the ongoing Russia-Ukraine conflict and US-China trade frictions, also bolster demand for precious metals as portfolio diversifiers, while Bitcoin’s behavior during such crises remains unproven over long cycles.
Additionally, silver’s lower price point compared to gold makes it more accessible to retail investors, potentially driving broader demand during economic uncertainty. Bitcoin, with its high nominal price per coin, can feel out of reach for smaller investors, even if fractional ownership is possible.
________________________________________
Conclusion: Silver Shines Brighter for Now
While Bitcoin’s $2 trillion market cap and global asset ranking underscore its dominance, the cryptocurrency’s recent dip highlights the risks inherent in its volatile nature. Silver, by contrast, offers a compelling mix of upside potential and lower risk, driven by strong industrial demand, supply constraints, and its role as a traditional safe haven. Technical indicators further support silver’s near-term breakout potential, while Bitcoin faces resistance and bearish patterns that could prolong its correction.
Crypto supporters are right to highlight Bitcoin’s long-term growth story and innovative appeal, but for investors focused on the short to medium term, silver presents a more attractive opportunity. Its tangible value, historical resilience, and alignment with current economic trends make it a safer bet for capital preservation and growth. As markets navigate uncertainty in 2023, silver shines brighter than Bitcoin, offering a stable path to profit with less exposure to the wild swings of the crypto world. Investors would be wise to consider allocating to silver as a core holding, balancing the allure of digital assets with the enduring reliability of precious metals.