Xagusdshort


XAGUSD Going DownBased on my analysis. Both XAGUSD and XAUUSD will going down soon. 16 Dollar its my target.

Silver could drop under 24 In my 2 days ago analysis on Silver I said that the rise from 24.50 is clearly corrective in nature and rallies towards 26 should be sold.
At the time of writing, Silver looks like it carved a local top and a lower high and it is resuming its bearish trajectory.
I'm bearish Silver in this context and I expect a new leg down under 24.
Gains should be very well capped by 26 resistance at this point

Silver- 26 is strong resistance nowAfter dropping around 18% from last week s top, Silver found support on Monday at 24.30 and started to rise.
The rise is clearly corrective in nature and it looks like a flag.
I expect gains to be very well capped around 26 resistance and we can expect a new wave of sales from here.
A good target for sellers can be 24.50

Silver Price at Trend line Support | Uptrend Silver chart is showing really good trend line support here it can move higher and higher
Silver price today is moving in below last 3 day low. breakout above will be our entry.
After correction in US dollar Commodities Price is moving good also in pandemic situation Investor majorly hold the commodities and bitcoin which is one of the best investment considered by the major institutions.
silver price must close below or above the trend line for next price direction

Silver - Continuation @ridethepig Silver Market Commentary 16.12.2020
=> It was no struggle for buyers to take out the diagonal resistance. Then, what comes next is a paralysing advance. Should some sellers wish to continue holding once the initial targets are hit then we can see capitulation.
This is a typical continuation flow with Fed which can be played here. The bid will advance from here and cannot be prevented in the short-term. This will now move with Gold and show bare the base of the retracement. The correct manoeuvre here consists of holding and working longs, enough to allow 26.0x (+10%) and 28.9x (+23%) above. Swing the bat and go massive when the positions starts working.
Thanks as usual for keeping the feedback coming 👍 or 👎


Xagusd Let's see how it reacts.
Good luck to you!
Don't forget to like and share, it really helps.
Follow for more.
This is just an idea, not financial advice.


SILVER - We rae scalping for a sell to the support or lowerTime for us to sell silver with an attempt to touch/test the support or break it and go lower
Silver - Sell ideaOur short-term sell Silver idea with our stop loss, take profits and 'sell more' levels

XAGUSD (Continuation) SHORT; SILVER SELL, ready to sink - again2nd chance to get on board or to reload those SHORTs.
Here is the previous post;

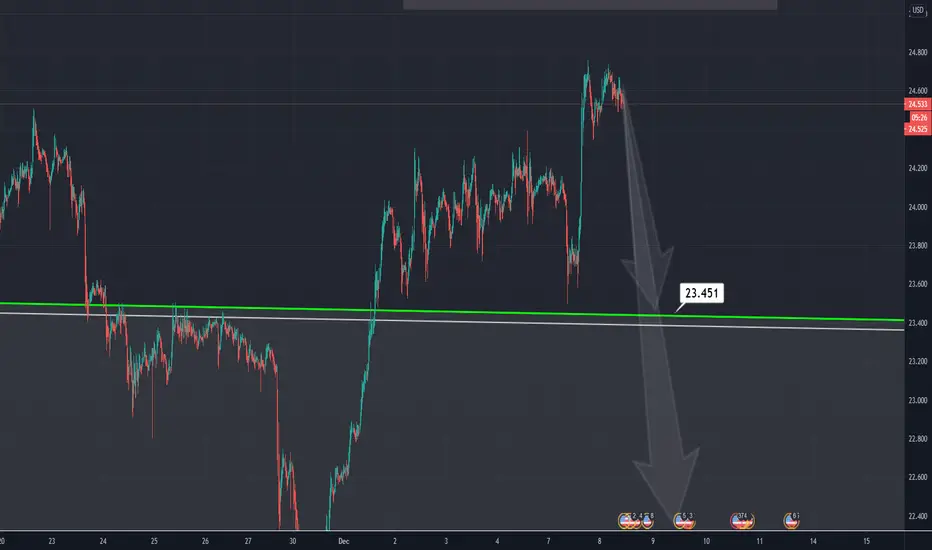
Silver could dropIn yesterday's comment I said that 24.40-24.50 is the line in the sand for Silver and as we can see from the chart, XagUsd stopped its ascent just under this level.
Similar to Gold we can have a correction also here and a drop under 24 should clarify things.
23.50 and 23.00 could be good targets for bears with 1:3 R:R in the case you target the later.
On the other hand, a break above 24.50 would call for a 25 zone test (trend line)

Silver- 24.40- 24.50 zone is the line in the sandSince August top at 30, Silver dropped 8usd (if we consider the low) which is approx 25%.
The drop is clearly corrective in nature and, unlike Gold, Silver didn't make a new low.
Now XagUsd is trading just under an important confluence resistance zone and a break and daily close above would signal the end of this correction
On the short term 23.50-23.60 zone is support now and dips towards this zone should be bought with a target around 24.40 resistance

XAGUSD has loosing the powerXAGUSD has a falling trend and it is losing its power. For the 1d graph, it has lower highs and a "falling triangle". Also, shoulder-head-shoulder formation and double pick were seen in the short past. They indicate weakness. I'm more close to short but before taking a position, it must wait for a confirmation.
Short opinion:
If it will break the support ($20-22), the target will be $18.5.
Long opinion:
If it will break the falling trend, because of flag formation, the target will be $35 with a 50% gain.
It is not an investment suggestion. Please be careful with your decisions.


Potential H&S Pattern DevelopingHI friends!
I have drawn a potential head and shoulder pattern developing.
We do currently have a small bullish divergence on the RSI on the 4H chart, this could help develop the right shoulder.
Potential target for the head and shoulder is around 21.8$ and if thats the case that could put us in a double bottom scenario.
Please leave a like if you find this idea helpful :)
Have a nice day!


Silver- should be sold above 25Like its bigger brother, Gold, Silver took a punch last Monday and the price dropped more than 10% in just one day.
Once it hit the ascending trend line Silver started to recover and managed to close the week above 24.30-24.50 congestion.
XagUsd remains heavy though, and I expect a new leg down soon.
I will look to sell rallies above 25 zone and only a daily close above 26 would change my bearish outlook

Silver- under 20 till year's end?Like gold, silver fell aggressively Monday after the vaccine was announced.
The price stopped falling just under 24 and into the uptrend line support, recovered some of the losses after and now is consolidating.
The chart structure is very bearish as long as the price stays under 25 and I expect it to break under support.
Such a break could drastically accelerate losses and we can see Silver dropping under 20 figure.
A sell trade with a SL above 25 could have a GREAT R:R of at least 1:5


