XAGUSD approaching resistance, potential drop!XAGUSD is approaching our first resistance at 14.25 (horizontal pullback resistance, 23.6% Fibonacci extension) where a strong drop might occur below this level pushing price down to our major support at 13.90 (horizontal swing low support).
RSI (89) is also seeing a bearish exit and we might see a corresponding drop in price.
Trading CFDs on margin carries high risk.
Losses can exceed the initial investment so please ensure you fully understand the risks.
Xagusdshort

THE GOLD AND SILVER HARSH BREAKDOWN IS ABOUT TO COMEOur previous comments still valid
Having expertise of trading precious metals from more than 11 years gives you immense knowledge about the market,on the basis of current market scenario we know one thing which is very certain,whenever fear enters the market, gold -0.40% -0.76% , and silver -0.21% -0.14% or PMs makes incredible rally-we have seen this market behavior over and over again in our trading carrier but what happened this time? If this is THE SELL-OFF OR THE BIGGEST EQUITY CRASH WE NEVER SAW IN OUR LIFE WHICH REPUTATED MEDIA OUTLETS ARE REFERRING TO THEN WHY GOLD -0.40% -0.76% AND SILVER -0.21% -0.14% IS BEHAVING WEIRD THIS TIME?
Remember if investors were really fearful due to the recent downside price action which we witnessed in equities then price of gold -0.40% -0.76% and silver -0.21% -0.14% (PMs) should have skyrocketed till now
we have written this two days ago that we think the move which we are witnessing is purely price and technical based and not even close to a fear-based move. In other words, our advanced 2.00% 1.50% price analysis suggesting that this small correction soon coming to the end and a major sell-off in PMs will start again.
we believe 2019-2020 could give you your lifetime chance to accumulate substantial wealth by investing in precious metals but we certainly don't think this THE SELL OFF we are waiting for
The upcoming move in PM sector seems to be extremely bullish but before that happens it's very critical to understand that gold -0.40% -0.76% -0.34% 0.07% and silver -0.21% -0.14% -1.15% -0.20% didn't reach their potential bottom yet, those who will miss it will regret it for coming months and years so I hope you guys have positioned yourself and risked enough from which you'll be able to generate substantial profits
PLEASE NOTE-Silver(the Bigger part of my portfolio is dedicated to my silver -0.21% -0.14% investment and we are going to allocate approx 20kUSD when PMs will reach its bottom in near future, However, we will keep you informed
OUR 4 TRADING POSITIONS ARE ACTIVE

XAGUSD approaching resistance, potential drop! XAGUSD is approaching our first resistance at 15.20 (Horizontal pullback resistance, 61.8%, 100% fibonacci extension, 38.2% fibonaccci retracement) where a strong drop might occur pushing price down to our major support at 14.58 (Horizontal overlap support, 61.8% fibonacci extension, 61.8% fibonaccci retracement).
Stochastic (89,5,3) is also approaching resistance and we might see a corresonding drop in price.
Trading CFDs on margin carries high risk.
Losses can exceed the initial investment so please ensure you fully understand the risks.

XAGUSD approaching resistance, potential drop! XAGUSD is approaching our first resistance at 15.20 (horizontal pullback resistance, 100%, 61.8% Fibonacci extension, 38.2% Fibonacci retracement) where a strong drop might occur below this level pushing price down to our major support at 14.54 (horizontal overlap support, 61.8% Fibonacci extension, 61.8% Fibonacci retracement).
Stochastic (89,5,3) is also approaching resistance where we might see a corresponding drop in price should it react off this level.
Trading CFDs on margin carries high risk.
Losses can exceed the initial investment so please ensure you fully understand the risks.

Silver Back At the Topside of The TrendLike gold, silver surged the last two weeks amid a global stock market correction. Now price is testing final resistance level of the trend. Follow the performance of the stock market & bonds closely, as a recovery in these assets will be very bearish for gold.
Trade Step-ups:
Bearish Reversal: Price rejects a breakout from the current trend. Profit levels to look for are 14.45 & 14.30 respectively.
Bullish Breakout: Price breaks from current trend channel, look for consolidates above 15.00.

XAGUSD approaching resistance, potential drop!XAGUSD is approaching our first resistance at 15.20 (horizontal pullback resistance, 61.8%, 100% Fibonacci extension, 38.2% Fibonacci retracement) where a strong drop might occur below this level pushing price down to our major support at 14.54 (horizontal overlap support, 61.8% Fibonacci extension, 61.8% Fibonacci retracement).
Stochastic (89,5,3) is also approaching resistance where we might see a corresponding drop in price.
Trading CFDs on margin carries high risk.
Losses can exceed the initial investment so please ensure you fully understand the risks.

BIGGEST GLOBAL EQUITY MARKET CRASH STARTED?Having expertise of trading precious metals from more than 11 years gives you immense knowledge about the market,on the basis of current market scenario we know one thing which is very certain,whenever fear enters the market, gold, and silver or PMs makes incredible rally-we have seen this market behavior over and over again in our trading carrier but what happened this time? If this is THE SELL-OFF OR THE BIGGEST EQUITY CRASH WE NEVER SAW IN OUR LIFE WHICH REPUTATED MEDIA OUTLETS ARE REFERRING TO THEN WHY GOLD AND SILVER IS BEHAVING WEIRD THIS TIME?
Remember if investors were really fearful due to the recent downside price action which we witnessed in equities then price of gold and silver(PMs) should have skyrocketed till now
we have written this two days ago that we think the move which we are witnessing is purely price and technical based and not even close to a fear-based move. In other words, our advanced price analysis suggesting that this small correction soon coming to the end and a major sell-off in PMs will start again.
we are certainly aware that the biggest market collapse is not too far that's why we believe 2019-2020 could give you your lifetime chance to accumulate substantial wealth by investing in precious metals but we certainly don't think this THE SELL OFF we are waiting for
The upcoming move in PM sector seems to be extremely bullish but before that happens it's very critical to understand that gold -0.34% 0.07% and silver -1.15% -0.20% didn't reach their potential bottom yet, those who will miss it will regret it for coming months and years so I hope you guys have positioned yourself and risked enough from which you'll be able to generate substantial profits
PLEASE NOTE-Silver(the Bigger part of my portfolio is dedicated to my silver investment and we are going to allocate approx 20kUSD when PMs will reach its bottom in near future, However, we will keep you informed
OUR 4 TRADING POSITIONS ARE ACTIVE

XAGUSD approaching resistance, potential drop!XAGUSD is approaching our first resistance at 15.20 (horizontal pullback resistance, 38.2% fibonacci retracement, 100%, 61.8% Fibonacci extension) where a strong drop might occur pushing price down to our major support at 14.53 (horizontal swing low support, 61.8%, 100% Fibonacci extension, 50% Fibonacci retracement).
Stochastic (89,5,3) is also approaching resistance and we might see a corresponding drop in price should it react off this level.
Trading CFDs on margin carries high risk.
Losses can exceed the initial investment so please ensure you fully understand the risks.

HAPPINESS WON'T LAST FOREVERMore banks are updating there forecast on gold and silver prices, however, most of them are “cautiously bullish” on gold prices, As of midnight on Friday gold is trading around $1234 while silver underperformance could be noticed by investors, trading at $14.700.Gold has broken above the psychological resistance $1200 from the last two weeks.
Bhar pointed out-The rally came amid inflows into gold-backed exchange-traded funds, Furthermore, he continued, there has been a pickup in gold purchases by central banks, including Hungary, Poland, India, Turkey, and Mongolia, in addition to regular gold buyers Russia and Kazakhstan.
most fund managers, investors, and traders including me are cautiously bullish(although I am still very bearish not because we have bias towards our short existing position but because of numerous evidence that suggests us that precious metals still has a lot more downside potential before it will start a significant rally), Money managers still hold a large net bearish position in gold futures. our upcoming analysis will list the factors that could limit the upside in near term-
we understand that the rising US dollar will be negative for precious metals sector and did you noticed USD index moved and closed above the neckline of its inverse head and shoulder pattern-This could be important as we could witness a breakout very soon which will eventually drag precious metals prices down
To prepare for an epic buying opportunity in gold and silver in 2019, consider learning more about our premium service as we believe The upcoming move in PM sector seems to be extremely bullish but before that happens it's very critical to understand that gold 0.07% and silver -0.20% didn't reach their potential bottom yet, those who will miss it will regret it for coming months and years so I hope you guys have positioned yourself and risked enough from which you'll be able to generate substantial profits

XAGUSD approaching resistance, potential drop! XAGUSD is approaching our first resistance at 14.84 (horizontal swing high, 78.6% Fibonacci retracement, 61.8% Fibonacci extension) where a strong drop might occur below this level pushing price down to our major support at 14.52 (horizontal swing low support, 78.6% Fibonacci retracement).
Stochastic (89,5,3) is also approaching resistance and we might see a corresponding drop in price should it react off this level.
Trading CFDs on margin carries high risk.
Losses can exceed the initial investment so please ensure you fully understand the risks.

free fall may start soonHaving a good idea, beforehand, where the buy and sell stops are located can give an active trader a better idea regarding at what price level buying or selling pressure will become intensified in that market.
Buy Stops -15.050(buying pressure)
Sell Stops- 14.450(selling pressure)
Our Active position
ASSET--Silver
Sell Limit Price: 14.700
Take Profit: 14.000
Stop Loss: 15.300

Wednesday, October 17, Gold and SilverHaving a good idea, beforehand, where the buy and sell stops are located can give an active trader a better idea regarding at what price level buying or selling pressure will become intensified in that market.
Buy Stops -15.050(buying pressure)
Sell Stops- 14.450(selling pressure)
Our Active position
ASSET--Silver
Sell Limit Price: 14.700
Take Profit: 14.000
Stop Loss: 15.300

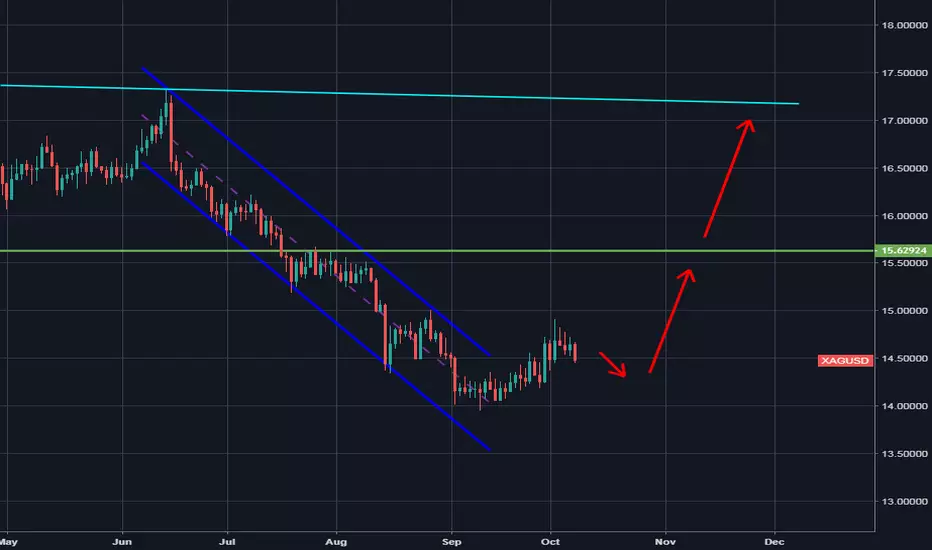
XAGUSD Weekly Forex Forecast 7th October to 13th OctoberMidterm forecast:
While the price is above the support 13.60, beginning of uptrend is expected.
We make sure when the resistance at 15.60 breaks.
If the support at 13.60 is broken, the short-term forecast -beginning of uptrend- will be invalid.
Technical analysis:
The RSI resistance #1 at 44 is broken, so the probability of beginning of uptrend is increased.
Price is above WEMA21, if price drops more, this line can act as dynamic support against more losses.
Relative strength index (RSI) is 56.
XAGUSD Weekly Forex Forecast 30 September to 6th OctoberMidterm forecast:
While the price is above the support 13.60, beginning of uptrend is expected.
We make sure when the resistance at 15.60 breaks.
If the support at 13.60 is broken, the short-term forecast -beginning of uptrend- will be invalid.
Technical analysis:
The RSI resistance #1 at 44 is broken, so the probability of beginning of uptrend is increased.
Price is above WEMA21, if price drops more, this line can act as dynamic support against more losses.
Relative strength index (RSI) is 56.

Silver (XAG/USD) entry a Short Signal1. Long- term trend on D1/W1 bearish
2. Price came to Key level $14.39, bounced from it so many times and made a fake broke.
3. Potential profit in 4 times bigger than risk.
4. The price is moving to key buy level $13.66. Near that level we can look for a Long only.
Sell at: $14.30
S/L: $14.46
T/P: $13.76
C.C.L. — Candle created level
C.A.P. — Candle Approved level
F.B. — Fake broke
P.S. Push like and send to your friend if you like it.

You have no idea what you're missing outAt the moment of writing this update our full 250% net short positions in gold, silver and mining stocks are well justified from the risk and reward perspective.
Very little happened yesterday iin case of gold and silver, yet mining stocks declined, in this way invalidating Friday's daily strength. In our past analysis, we clarified that similarly as one swallow doesn't make a mid year, a one day of quality in the mining stocks doesn't change the general propensity for them to fail to meet expectations gold. Yesterday's session seems to be a perfect confirmation. What now?
The decrease in the valuable metals segment is probably going to proceed. We wrote about it many times before and we'll most likely write it for a few more days or (more probable) weeks. Because the interruption in the USD Index is taking somewhat more, it doesn't imply that it's any less inclined to happen. The inverse is the situation of the valuable metals area. In yesterday's investigation we included various signs indicating lower PM costs in the next weeks. The only bullish sign was on Friday's strength of mining stocks with respect to gold. Furthermore, this signal was just invalidated yesterday
Miners’ Relative Weakness
Taking a look at the most recent couple of days, it's not by any means visible that there was any strength in mining stocks whatsoever. miners closed at another 2018 low, while gold and silver didn't. The miners weakness essentially proceeds, much the same as it tirelessly proceeded in 2013 preceding the greatest piece of the value slide.
With all the bearish factors set up, the standpoint remains plainly bearish. There's very little we can include based what happened yesterday.
Before summing this up, we might want to talk about the miners’ performance relative to gold in greater detail. We were requested to clarify whether the mining stocks relative valuations can be trusted constantly (it didn't appear to work exceptionally well toward the finish of 2015 and in mid 2016). That was a decent inquiry and we will be glad to explain.
Is Miners' Under-and Outperformance Always Right?
Above all else, the mining stocks' performence is something that is very helpful as a very near term reversal sign, particularly when it is joined by particular movement in silver. It's most helpful of detecting local tops. The procedure is to search for days , when mining stocks fail to meet expectations gold (the clearer the underperformance is, the more grounded the stronger the signal becomes) and during which silver outfperforms. The white metal's outperformance could be just few hours of exceptionally solid intraday or medium-term rally – that is generally enough.
In the event that there is no confirmation from silver, at that point we'd like to have other reversal signs also, before acting on the signal,the daily lack of reaction in the mining stocks with respect to gold's development is one of the more dependable short term signals, however it's not great.
The inquiry that we got wasn't generally about the short term trades, however. It was about the benefit of the major signals. For example, the ones that could affirm or refute the final bottomfor this decrease in the valuable metals division.
it turns out that the individuals who are stating that mining stocks regularly lose their use to gold before the inversion (declining to decay much while gold keeps on declining, or reviving a tad, while gold is energizing unequivocally), and the individuals who say that excavators are frequently wrong at the boundaries are both right.
What does it mean for us in the present circumstance? It implies that we shouldn't be amazed by activity that is like what we found in the late 2015 and mid 2016. Mining stocks could continue to show weakness for short then start to show strength for days (maybe even weeks if the last base happens later than in October) while gold decline, in this way blazing the last cautioning signs for those, who haven't set up for THE base yet. Be that as it may, the correct base, could be joined by the rebound of mining stocks' shortcoming.
As it were, while the mining stocks strength can be seen as "the base or bottom is coming!" sign (and a few financial specialists may like to begin aggregating the long term interests in the PM part around then), different systems and techniques should be used to determine the exact timing of bottoming and price.
Summing up, it's very likely that the pause in the valuable metals is finished and the following enormous move down is as of now in progress. The move is probably going to be sharp and the benefits on the present short position are probably going to change from being immense to being colossal and afterward at last to being crazy.
As usual, we'll keep you – our supporters – educated.
many regards-Neeraj Pandey
Our existing positions
ASSET--XAGUSD
Sell Limit Price: 14.900
Take Profit: 12.80
Stop Loss: 14.413(modified)
ASSET-GOLD
Sell limit Price: 1185
Take Profit: 1080
Stop Loss: 1231
( It doesn’t, however, mean that we won’t adjust (limit, close or even reverse) the position before this price level is reached. If we get enough confirmations other than gold’s price level itself (for instance, mining stocks show strength and silver 0.43% 0.07% 0.21% -0.07% -1.14% 0.07% -0.53% 0.13% -0.13% -0.06% -0.26% -0.19% -0.06% reaches a very important support level , while the USD reaches a key resistance), then we might do it, just like we’ve done previously (which ultimately caused the short position to be more profitable).

XAGUSD approaching resistance, potential drop! XAGUSD is approaching our first resistance at 14.39 (horizontal overlap resistance, 38.2% Fibonacci retracement, 61.8%, 100% Fibonacci extension) and a strong drop might occur below this level pushing price down to our major support at 13.67 (horizontal swing low support).
Ichimoku cloud is also showing signs of bearish pressure in line with our bearish bias. Stochastic (21,5,3) is also approaching resistance and a reaction below this level might see a corresponding drop in price.
Trading CFDs on margin carries high risk.
Losses can exceed the initial investment so please ensure you fully understand the risks.

Brief journey in trading viewThis post is nothing just our brief journey in trading view about our profitable trades(we will update you about everything whether profit or loss)
we predicted sell position in gold -1.00% 0.20% 0.11% and silver -0.34% -0.73% -0.06% When gold -1.00% 0.20% 0.11% was at 1358 and silver -0.34% -0.73% was at around 17.800, first post regarding our short view sent on March 8th, we took the entire profit out of the table @1260-gold and @16.100-Silver,multiple short-term trades has been executed while riding this fall including short-term buy
After taking profit out@1260 we took only short-term trades until the yellow metal reaches 1231 and now our long-term trade is active once again in gold -1.00% 0.20% and silver -0.34% ,
recent short term trade in gold -1.00% hits TP,entered at 1219-closed-1200
recent short term trade in silver -0.34% hits TP entered at 15.450-closed-15.00
Enjoy
recent long-term trade in gold were profitable, entered at 1231-closed-1180
recent long-term trade in silver were profitably entered at 15.450-closed-14.650
Enjoy

YOU HAVE NO IDEA WHAT YOU ARE IGNORING!!!At the moment of writing this update our full 250% net short positions in gold -0.46% -1.65% , silver 0.07% -0.53% and mining stocks are well justified from the risk and reward perspective.
In today’s analysis, we will present you numbers of key factors that are likely to result in lower Gold -0.46% , Silver 0.07% and Mining stocks(precious metals)prices in the coming weeks and months. obviously, we will not discuss them in detail as that would imply writing a book but due to this platform text restriction if we won't be able to finish our post here, we will highly suggest you visit our page(mentioned at the end) for full analysis
we’ll provide very brief summaries of each point that is likely to result in lower Gold -0.46% , Silver 0.07% , and Mining stocks(precious metals)prices in the coming weeks and months. Let’s start with the big picture.
1-Apex based reversal shows that the shape of gold -0.46% decline, The way yellow metal is declining since 2011 is very similar to the way in which gold -0.46% declined in the 1980s. This is a major issue for gold -0.46% bulls because it suggests that gold -0.46% is likely to form new lows.
Long term situation is USD Index is yet another major factor which suggests that the precious metals are about to plunge in a drastic manner.we are not referring to the last couple years chart of USD Index,Instead we are talking about the 48 year chart where you would be able to see the extremely massive confirmed breakout in the case of the USD Index. Implications are profound as it suggests more rallies in the USD Index.
2-The next factor that remains in place is the link between 2012-13 decline to current plunging going on in the yellow metal. we wrote in our previous posts that gold -0.46% was likely to move higher for about 2-3 weeks in July and then to decline with the strong and major decline will start in august.we have exactly seen that and our previous comments are still up-to-date.
3-On January 28,2018, we saw the major signs from the volume reading in terms of weeks. On Feb 2,2018 we wrote about the major record-breaking monthly volume levels. The implications are bearish anyway and they may contribute to lower gold -0.46% prices in the future.
4-let's talk about key analogies, The first analogy in silver 0.07% is between 2008 and last few years. This analogy is shockingly accurate in terms of prices. The WHITE metal rallied to the price levels and to which it declined in 2008 are extremely similar to where it rallied since early 2016. The implications are very bearish .
5-let's talk about the important ratio in the precious metals sector-gold to silver 0.07% ratio. most analyst and traders have a misconception about it.you may have read some analysis about the ratio is moving or reaching to its long-term resistance at about 80. Instead, the real long long-term resistance in the gold -0.46% to silver 0.07% ratio is at about 100. This is the actual level at which the ration really reversed from the long-term perspective.
6-Another factor is the way gold -0.46% reacted to the extremely positive fundamental news this year and in the previous years. due to some news and some short-term rallies, even some of our investors got excited, we tried to calm them down by posting another analysis.we saw a price barrier of $1350-$1451 in gold -0.46% within previous years. We saw the news like Russia taking over Crimea, we had trade wars, nuclear threats regarding North Korea. Gold -0.46% didn't really by this news which shows that P. Ms 0.12% is not ready to rally yet-it really needs to find the real bottom first.
7-If you have been following our trades for some in trading view or if you are our premium subscriber.you made a lot of money in this year, you know technical analysis and daily written updates matters a lot but if you haven't you might be thinking why you should even care about these charts and daily updates instead of just watching and observing the real-Gold supply and demand , geopolitical conditions, interest rates and so on. you are making a very novice and dumb mistake because the technical analysis of the precious metals market is clearly justified from the fundamental point of view
8-Another major factor which we would address here is the currency sector. Interest rates drive the currency prices but in practice, the reaction can be delayed. The rally in USDX started in early 2018 and it seems that there is much more room for the higher prices in the USDX, This is a bearish implication for the PMs prices, we covered this full subject in our old analysis
9-The next and last factor is the correlation between the Nikkei 225 0.14% Index with gold -0.46% . This correlation is negative.we still view Japanese stock market as an indication of what's likely to happen in the PMs.it seems that Nikkei value is about to soar in the medium and long-term which indicates lower Gold -0.46% prices.
The conclusion-our outlook for Gold -0.46% 0.05% , Silver 0.07% -0.53% and mining stocks is very bearish for the medium and long-term, and it seems gold -0.46% 0.05% is likely to plunge more within next 2.5 weeks and it seems $1130 target is very much likely to reach but it may even drop to $1060.We may touch a local bottom later this month, though and we’ll keep you informed regarding the possibility of seeing a bigger turnaround.
we will keep you informed anyway
many regards-Neeraj Pandey
Our existing positions
ASSET--XAGUSD
Sell Limit Price: 14.900
Take Profit: 12.80
Stop Loss: 15.560
ASSET-GOLD
Sell limit Price: 1185
Take Profit: 1080
Stop Loss: 1221
( It doesn’t, however, mean that we won’t adjust (limit, close or even reverse) the position before this price level is reached. If we get enough confirmations other than gold’s price level itself (for instance, mining stocks show strength and silver 0.07% -0.53% 0.13% -0.13% -0.06% -0.26% -0.19% -0.06% reaches a very important support level , while the USD reaches a key resistance), then we might do it, just like we’ve done previously (which ultimately caused the short position to be more profitable).

Another big slide is likely just aheadAt the moment of writing this update our full 250% net short positions in gold 0.33% 0.28% -0.29% -0.08% -1.31% -1.65% , silver 0.41% 0.54% -0.81% -0.88% 0.14% -0.53% and mining stocks are well justified from the risk and reward perspective.
Comparing Analogies with 2013-There are precious lessons you can learn-
The conclusion-our outlook for Gold 0.33% -0.29% -0.07% -1.31% 0.05% , Silver 0.41% -0.81% -0.88% 0.28% -0.53% and mining stocks is very bearish for the medium and long-term, and it seems gold 0.33% -0.29% -0.07% -1.31% 0.05% is likely to plunge more within next 2.5 weeks and it seems $1130 target is very much likely to reach but it may even drop to $1060.We may touch a local bottom later this month, though and we’ll keep you informed regarding the possibility of seeing a bigger turnaround.
more likely scenario- we’ll see some kind of local bottom with gold 0.33% -0.29% -0.07% -1.31% at $1,125 - $1,130 or so. This week’s declines shows that the slide has already begun
we will keep you informed anyway
many regards-Neeraj Pandey
Our existing positions
ASSET--XAGUSD
Sell Limit Price: 14.750
Take Profit: 12.80
Stop Loss: 15.600
ASSET-GOLD
Sell limit Price: 1185
Take Profit: 1080
Stop Loss: 1221
( It doesn’t, however, mean that we won’t adjust (limit, close or even reverse) the position before this price level is reached. If we get enough confirmations other than gold’s price level itself (for instance, mining stocks show strength and silver 0.41% -0.81% -0.88% 0.28% -0.53% 0.13% -0.13% -0.06% -0.26% -0.19% -0.06% reaches a very important support level , while the USD reaches a key resistance), then we might do it, just like we’ve done previously (which ultimately caused the short position to be more profitable).

No it's not over yet-last warningAt the moment of writing this update our full 250% net short positions in gold 0.28% -0.29% -0.08% -1.31% -1.65% , silver 0.54% -0.81% -0.88% 0.14% -0.53% and mining stocks are well justified from the risk and reward perspective.
Following a to a great degree bearish week, we at long last observed a touch of quality in the valuable metals showcase on Friday. Notwithstanding mining stocks – at last – revived. While all the critical subtle elements appear to originate from gold, silver, mining stocks, or one of their proportions, one ought not disregard the business sectors that effect the above seriously. The most essential of these business sectors is the USD Index, and it simply framed a bearish falling star candle as far as the week after week value changes. That is an exceptionally bearish advancement, which – on the off chance that it is trailed by a sizable decrease in the USDX – is probably going to trigger a ground-breaking rally in the valuable metals area.
We may have surely observed an imperative bearish sign in light of the week after week value changes in the USD Index, however it has positively no suggestions for our exchanging positions in the valuable metals division. Indeed, it scarcely changes the viewpoint for the USDX. The plain here and now suggestions are bearish. Yet, the above simply isn't the full truth. The full truth is that while we may see a move lower, it's probably going to be little. Besides, it's something very normal as of now.
The USD Index has as of late broken over the rising wedge design or more the neck level of the turn around head-and-shoulders design. This implies one can anticipate that the USDX will decrease back to the beforehand broken levels and to confirm them as help. What's more, there will be nothing bearish about it.
These two levels make the close term drawback target zone and is near where the USDX shut on Friday – somewhere in the range of 95.4 and 95.7. Since the USDX simply shut at around 96, the potential size of the downswing is somewhere in the range of 0.3 and 0.6. At the end of the day, the USDX is probably going to at most rehash its Friday's decay and maybe it will decrease by just about portion of its Friday's decrease.
Is this a considerable decay? No. Thusly, is it liable to trigger a generous (!) rally in the valuable metals or mining stocks? No.
Gold has not just broken beneath the past lows (counting the late-January 2017 low as far as the day by day shutting costs), however it likewise shut the week underneath them. The breakdowns underneath the past lows give off an impression of being affirmed. With gold in the red territory that incorporates no critical help, and given the solid medium-term downtrend, we can expect another wave down, despite the fact that the RSI is as of now extremely oversold.
The white metal moved underneath the rising red help line and shut the week beneath it. It didn't figure out how to promptly break beneath the July 2017 low, however that was not required for the viewpoint to stay bearish. The decrease was and still is exceptionally bearish (simply look how close silver is to its 2015 low), however no market can climb or down in a straight line. The July 2017 low was one of the levels that could have created an interruption – and it did. It was definitely not a beyond any doubt wager and changing the positions wasn't advocated in our view, particularly that the circumstance in the USD Index indicated significantly higher USDX esteems with just a probability of seeing lower esteems quickly.
The RSI marker in light of the week after week costs is beneath 30, yet it's not yet at the levels that beforehand activated bounce back in 2013. Therefore, we hope to see more shortcoming . Maybe not today, but rather doubtlessly this week.
For a long time we have been underlining that there is nothing extremely bullish about the mid 2018 rally in the valuable metals part and in the gold stocks to gold proportion. On account of the last it was only a check of the past breakdown underneath the critical 2016 base. The breakdown was undoubtedly confirmed by a move back to the beforehand broken level and the enormous medium-term decay proceeded with presently. What we are seeing presently is a characteristic aftereffect of the above.
Much the same as it is the situation with the HUI Index, its proportion is additionally underneath the key close-by help levels and the closest solid help is at the 2015 lows. This makes the suggestions for the short and medium term extremely bearish.
We have quite recently observed a week by week close beneath the most minimal week after week close of 2015, which is a vital breakdown. This move isn't yet affirmed, however it's unquestionably present. Therefore, the ramifications of the proportion and its present position with respect to the 2015 lows are bearish, not bullish.
Outline
Summing up, there are various extremely important reasons because of which the valuable metals part is probably going to move bring down in the next many months and a week ago's decays demonstrate that the tremendous slide is unmistakably in progress. At the end of the day, it appears that our sizable benefits on the short positions will turn out to be much greater shortly. We may have a neighborhood base not long from now, however, and we'll keep you educated in regards to the likelihood of seeing a greater turnaround.
Long term positions
ASSET--XAGUSD(Silver)-Inactive
Sell Limit Price: 14.900
Take Profit: 12.80
Stop Loss: 15.560
ASSET-XAUUSD(GOLD)-Active
Sell limit Price: 1185
Take Profit: 1080
Stop Loss: 1221
( It doesn’t, however, mean that we won’t adjust (limit, close or even reverse) the position before this price level is reached. If we get enough confirmations other than gold’s price level itself (for instance, mining stocks show strength and silver -0.06% -0.06% -0.26% -0.19% -0.06% reaches a very important support level , while the USD reaches a key resistance), then we might do it, just like we’ve done previously (which ultimately caused the short position to be more profitable).

The Bulls are Back??At the moment of writing this update our full 250% net short positions in gold -0.08% -1.31% -1.65% , silver -0.88% 0.14% -0.53% and mining stocks are well justified from the risk and reward perspective
As our current long-term positions are in good profit, one may ask to close the position and take the entire profit out of the table but just as a loss on a position is not a reason to close it, a big profit isn't too. Remember-The market simply doesn’t care about any one individual’s loss or profit and will not use it as a factor in determining the next move.
Those who believe we are long-term gold bears just keep in mind we are working on the report of how gold could soar once it finally bottoms, the numbers may surprise you, anyways we will keep you updated regarding this biggest turnaround.
Gold, silver and mining stocks declined in a significant manner within days and our long-term position is already running with a sizable profit. That was the first time we had increased the size of our position by up to 250% that we had never increased it to before. we saw the enormous sizes of decline, especially in silver and mining stocks. The HUi Index broke below 2008 like it never existed but the silver stopped at around July 2017 intraday low, So does it mean we are going to see a huge rally in silver prices from this point?
The answer really depends on how you define a rally. If a 40-50 cent move or so defines a case of a rally for you then yes, this might be true, for us, it doesn't seem that we witnessed anything that would justify changing our current short positions.
Gold already broke below the March 2017 low and there is no important support all the way down to 2016 bottom. with taking intraday prices into account late January 2017 bottom worked as a support yesterday but in terms of daily closing prices gold closed below that, we didn't saw the lowest close like we witnessed yesterday since January, so we also saw a breakdown. we don't expect the late-January bottom to generate any sizable rally, Instead, we think gold will plunge to December 2016 bottom which is more likely compared to yellow metals breaking below the December 2015 bottom(still possible). overall our previous comments on yellow metal is still up-to-date.
Silver-From the shorter point of view, we saw the sizable decline in white metal and than it stopped the decline at July 2017 bottom. It seems very bullish from the short-term perspective but these are very short term signals without having many bullish confirmations so we shouldn't focus on the very short-term signals.
The conclusion-our outlook for Gold -0.07% -1.31% 0.05% , Silver -0.88% 0.28% -0.53% and mining stocks is very bearish for the medium and long-term, and it seems gold -0.07% -1.31% 0.05% is likely to plunge more within next 2.5 weeks and it seems $1130 target is very much likely to reach but it may even drop to $1060.We may touch a local bottom later this month, though and we’ll keep you informed regarding the possibility of seeing a bigger turnaround.
more likely scenario- we’ll see some kind of local bottom with gold -0.07% -1.31% at $1,125 - $1,130 or so. This week’s declines shows that the slide has already begun
we will keep you informed anyway
many regards-Neeraj Pandey
Our existing positions
ASSET--XAGUSD
Sell Limit Price: 15.500
Take Profit: 12.80
Stop Loss: 15.600
ASSET-GOLD
Sell limit Price: 1231
Take Profit: 1080
Stop Loss: 1221
( It doesn’t, however, mean that we won’t adjust (limit, close or even reverse) the position before this price level is reached. If we get enough confirmations other than gold’s price level itself (for instance, mining stocks show strength and silver -0.88% 0.28% -0.53% 0.13% -0.13% -0.06% -0.26% -0.19% -0.06% reaches a very important support level , while the USD reaches a key resistance), then we might do it, just like we’ve done previously (which ultimately caused the short position to be more profitable).

Part 8 - Risk-off August - XAG/USD DailyXAG/USD – Daily Resistance & Support:
Resistance: 15.70 / 16.00 / 16.75 / 17.75 / 19.00 / 20.00 / 21.00 / 22.00
Support: 15.00 / 14.75 / 14.35
XAG/USD – Summary:
Expected to commence a Bullish Corrective Structure in a three-swings sequence at or around the 15.00 Levels and possibly retest the 16.00 – 16.75 vibration zone.
Bearish Impulse expected around the 16.00 – 16.75 vibration zone.
If all scenarios would turn out to unfold as expected and Silver would retest the 14.35 levels, then that specific area could be seen by bulls as an opportunity for longs, which could even reach the 21.00 levels in an Impulse.
