XAGUSD correction towards the end of the year.Silver (XAGUSD) has made a Double Top (red circle) on October 04 near the Higher Highs trend-line of the 2-year Channel Up. Last time it did a similar Higher High was on May 05 2023, after remarkably a similar +48.50% rise, it started a correction that extended below bot the 1D MA50 (blue trend-line) and the 1D MA200 (orange trend-line).
The first stop was the 1D MA200 and the 0.382 Fibonacci retracement level and that's where our end-of-year Target is at 28.500.
Notice also the 1W MACD similarities between the two peak fractals. Also the time from bottom to top has been highly identical at 246 and 248 days respectively.
-------------------------------------------------------------------------------
** Please LIKE 👍, FOLLOW ✅, SHARE 🙌 and COMMENT ✍ if you enjoy this idea! Also share your ideas and charts in the comments section below! This is best way to keep it relevant, support us, keep the content here free and allow the idea to reach as many people as possible. **
-------------------------------------------------------------------------------
💸💸💸💸💸💸
👇 👇 👇 👇 👇 👇
Xagusdsignals

#SILVER: Risk Entry Vs Safe Entry! ! Dear Traders,
The XAGUSD/SILVER price has declined since the normalization of Middle Eastern conflict tensions. These scenarios occur when fundamental pressure diminishes, resulting in market sell-offs, particularly for metals. While gold reached a multi-month low of 2607 before reversing, silver continues to decline. We anticipate a potential price reversal within two specific areas.
Additionally, we have identified three potential reversal targets. Please conduct thorough research before making any decisions regarding silver. It is important to note that the price may reverse upon reaching the first target. Therefore, a well-defined plan is crucial when trading highly volatile market instruments. We wish you the best of luck in your endeavours.

XAG/USD "The Silver" Market Money Heist Plan on Bullish SideHello My Dear Robbers / Money Makers & Losers, 🤑 💰
This is our master plan to Heist XAG/USD "The Silver" Market Bank based on Thief Trading style Technical Analysis.. kindly please follow the plan I have mentioned in the chart focus on Long entry. Our target is Red Zone that is High risk Dangerous level, market is overbought / Consolidation / Trend Reversal / Trap at the level Bearish Robbers / Traders gain the strength. Be safe and be careful and Be rich.
Attention for Scalpers : If you've got a lot of money you can get out right away otherwise you can join with a swing trade robbers and continue the heist plan, Use Trailing SL to protect our money 💰.
Note: If you've got a lot of money you can get out right away otherwise you can join with a swing trade robbers and continue the heist plan, Use Trailing SL to protect our money.
Entry : Can be taken Anywhere, What I suggest you to Place Buy Limit Orders in 15mins Timeframe Recent / Nearest Swing Low
Stop Loss 🛑 : Recent Swing Low using 1H timeframe
Warning : Fundamental Analysis news 📰 🗞️ comes against our robbery plan. our plan will be ruined smash the Stop Loss. Don't Enter the market at the news update.
Loot and escape on the target 🎯 Swing Traders Plz Book the partial sum of money and wait for next breakout of dynamic level / Order block, Once it is cleared we can continue our heist plan to next new target.
Support our Robbery plan we can easily make money & take money 💰💵 Follow, Like & Share with your friends and Lovers. Make our Robbery Team Very Strong Join Ur hands with US. Loot Everything in this market everyday make money easily with Thief Trading Style.
Stay tuned with me and see you again with another Heist Plan..... 🫂

XAGUSDPair : XAGUSD ( Silver / U.S Dollar )
Description :
Completed " 12345 " Impulsive Waves and " AB " Corrective Waves
Break of Structure
RSI - Divergence
Bullish Channel as an Corrective Pattern in Short Time Frame and Long Time Frame
S / R Level

XAGUSD Pair : XAGUSD ( Silver / U.S Dollar )
Description :
Completed " 12345 " Impulsive Waves
Demand Zone
Bullish Channel as an Corrective Pattern in Short Time Frame
Break of Structure
RSI - Divergence

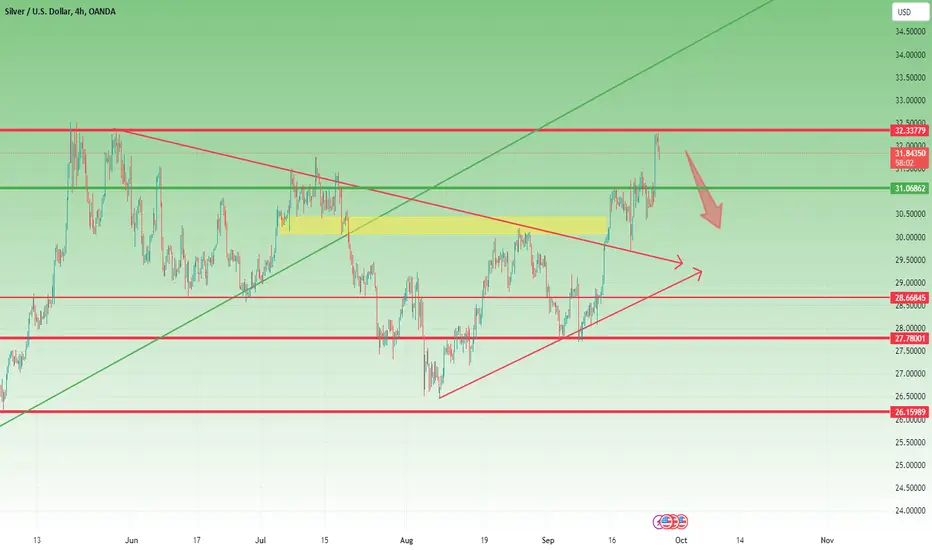
Silver could drop from resistanceAfter bouncing off the 28 support zone and breaking above the falling trend line, Silver continued its upward momentum, reaching key resistance around the 32 level.
Now, the price has begun to pull back, signaling a potential correction.
The 30 level stands as a crucial support to watch, with an interim support at 31.
SILVER (XAGUSD): Pullback From Resistance Confirmed
Silver looks quite bearish on a 4H time frame
after a test of a key daily resistance.
The price violated a support line of a symmetrical triangle formation
and closed below that.
The price may drop lower.
Next support - 30.1
❤️Please, support my work with like, thank you!❤️

#XAUUSD 1DAYXAGUSD Daily Analysis: Buy Opportunity on Trendline Breakout
The silver market (XAGUSD) is currently presenting a compelling buy opportunity following a significant trendline breakout. This technical development suggests a potential shift in market sentiment and upward momentum.
1.Trendline Breakout: The price has decisively broken above the established downward trendline, signaling a shift from bearish to bullish sentiment. This breakout typically indicates the possibility of a sustained upward movement.
2.Confirmation Indicators: The breakout is supported by increased trading volume, which reinforces the strength of this move. A closing candle above the trendline further validates the bullish outlook.
3.Support Levels: The previous resistance level is now acting as a support zone, providing a safety net for buyers entering at this point.
4.Technical Indicators: Momentum indicators, such as the RSI, are moving toward overbought territory, while the MACD is showing a bullish crossover, suggesting that momentum is building.
5.Market Sentiment: Positive economic developments and increased demand for silver in industrial applications contribute to the favorable outlook. Additionally, geopolitical tensions may drive safe-haven buying.
Conclusion
With the trendline breakout signaling a shift in momentum, a buy opportunity in XAGUSD looks promising. Traders should consider entering positions with a stop-loss just below the breakout level to manage risk effectively. Keep an eye on economic data releases and market developments that may impact silver prices.

XAGUSD: AB=CD pattern is forming, what is next? Dear Traders,
Bullish pattern is forming, and we have witness change in price. Tomorrow Fed news will likely to take down the price and then reverse from the area that we have identified. We can target a swing area and target a reasonable position. Good luck.

SILVER (XAGUSD): Bullish Rally Continues
Silver keeps rallying like crazy.
The price was rapidly growing the entire last week.
It managed to violate a significant horizontal daily resistance
and close above that on Friday.
With a high probability, the market will keep growing and reach 31.4 level soon.
❤️Please, support my work with like, thank you!❤️

SILVER (XAGUSD): Bullish Rally Confirmed
Silver will continue next week after a confirmed breakout of a
key daily horizontal resistance and a candle close above that.
The price is now heading towards 31.24 resistance.
❤️Please, support my work with like, thank you!❤️

XAGUSDPair : XAGUSD ( Silver / U.S Dollar )
Description :
Completed " 12345 " Impulsive Waves and " ABC " Corrective Waves
Break of Structure
RSI - Divergence
Demand Zone
Fibonacci Level - 61.80%

XAGUSD One final Low remaining.Silver (XAGUSD) has been trading within a 2-year Channel Up pattern and since its last Higher High (top) on the week of May 20 2024, it has been declining on the new Bearish Leg. The price already broke below the 1D MA100 (red trend-line) and so far seems to be replicating the Bearish Leg (Channel Down) of May - September 2023.
With the 1D RSI sequences between the two fractals also similar, we expect Silver to make one final Low just below the 1W MA50 and above the 0.618 Fibonacci level, before bottoming and rebound. Our Target is 26.500.
-------------------------------------------------------------------------------
** Please LIKE 👍, FOLLOW ✅, SHARE 🙌 and COMMENT ✍ if you enjoy this idea! Also share your ideas and charts in the comments section below! This is best way to keep it relevant, support us, keep the content here free and allow the idea to reach as many people as possible. **
-------------------------------------------------------------------------------
💸💸💸💸💸💸
👇 👇 👇 👇 👇 👇

SILVER (XAGUSD): Long From Support
I see a nice buying opportunity on Silver.
The test of a key intraday/daily structure support triggered a strong bullish reaction.
A double bottom was formed, and we see a bullish movement above the neckline
this morning.
I think that the price will keep growing at least to 28.61
❤️Please, support my work with like, thank you!❤️

XAUUSD GoldPair : XAGUSD ( Silver / U.S Dollar )
Description :
Completed " 12345 " Impulsive Waves and " AB " Corrective Waves
Break of Structure
RSI - Divergence
Fibonacci Level - 78.60%
Bullish Channel as an Correction in Short Time Frame

XAG/USD Silver Bullish Side Money Heist PlanHola ola Robbers / Money Makers & Losers,
This is our master plan to Heist SILVER Market based on Thief Trading style Technical Analysis.. kindly please follow the plan I have mentioned in the chart focus on Long entry. Our target is Red Zone that is High risk Dangerous level, market is overbought / Consolidation / Trend Reversal at the level Bearish Robbers / Traders gain the strength. Be safe and be careful and Be rich.
Note: If you've got a lot of money you can get out right away otherwise you can join with a swing trade robbers and continue the heist plan, Use Trailing SL to protect our money.
Entry : Can be taken Anywhere, What I suggest you to Place Buy Limit Orders in 15mins Timeframe Recent / Nearest Swing Low
Stop Loss : Recent Swing Low using 2h timeframe
Warning : Fundamental Analysis comes against our robbery plan. our plan will be ruined smash the Stop Loss. Don't Enter the market at the news update.
Loot and escape on the target 🎯 Swing Traders Plz Book the partial sum of money and wait for next breakout of dynamic level / Order block, Once it is cleared we can continue our heist plan to next new target.

XAGUSDPair : XAGUSD ( Silver / U.S Dollar )
Description :
Completed " 12345 " Impulsive Waves
Break of Structure
RSI - Divergence
Demand Zone
Bullish Channel as an Corrective Pattern in Short Time Frame

SILVER XAG/USD Money Heist Plan on BullishMy Dear Robbers / Traders,
This is our master plan to Heist SILVER "XAGUSD" based on Thief Trading style Technical Analysis.. kindly please follow the plan I have mentioned in the chart focus on Long entry. Our target is Red Zone that is High risk Dangerous level, market is overbought / Consolidation / Trend Reversal at the level Bearish Robbers / Traders gain the strength. Be safe and be careful and Be rich.
Note: If you've got a lot of money you can get out right away otherwise you can join with a swing trade robbers and continue the heist plan, Use Trailing SL to protect our money.
Entry : Can be taken Anywhere, What I suggest you to Place Buy Limit Orders in 15mins Timeframe Recent / Nearest Swing Low
Stop Loss : Recent Swing Low using 1h timeframe
Warning : Fundamental Analysis comes against our robbery plan. our plan will be ruined smash the Stop Loss. Don't Enter the market at the news update.
Loot and escape on the target 🎯 Swing Traders Plz Book the partial sum of money and wait for next breakout of dynamic level / Order block, Once it is cleared we can continue our heist plan to next new target.
Support our Robbery plan we can easily make money & take money 💰💵 Follow, Like & Share with your friends and Lovers. Make our Robbery Team Very Strong Join Ur hands with US. Loot Everything in this market everyday make money easily with Thief Trading Style

SilverPair : XAGUSD ( Silver / U.S Dollar )
Description :
Completed " 12345 " Impulsive Waves and " A - wxyx " Corrective Waves
Break of Structure
CHoCH
Bullish Channel as an Corrective Pattern in Short Time Frame
RSI - Divergence

SILVER (XAGUSD): More Growth is Coming?!
I see a confirmed structure breakout on Silver.
The price broke and closed above a key daily resistance.
We see its retest at the moment.
Presumably, the broken structure turned into support now.
The market may continue growth at least to 30.3 resistance.
❤️Please, support my work with like, thank you!❤️

XAGUSDPair : XAGUSD ( Silver / U.S Dollar )
Description :
Bullish Channel as an Corrective Pattern in Short Time Frame
Completed " 12345 " Impulsive Waves
Break of Structure and Retracement
CHoCH
Bearish Channel as Correction in Long Time Frame with the Breakout of Upper Trend Line

Silver- Ready for 35usd A few months ago, I wrote an XAG/USD analysis, predicting that Silver could rise by 10,000 pips to reach 35.
Achieving such a significant target requires patience, and the price won't climb in a straight line. However, my long-term conviction remains unchanged: Silver will likely rise to 35 USD/oz.
But as Keynes said, "In the long run, we are all dead," so let's focus on the short term.
Recently, as shown in the posted chart, Silver broke below horizontal support.
However, after a bullish Pin Bar formation a few days ago, the price reversed strongly and is now trading back at the old support, which has become resistance.
This suggests the possibility of a false break.
At this moment, given the proximity to resistance, a correction is possible. However, this correction should be seen as a good opportunity to buy in anticipation of a false break. Depending on your patience, you could set your target at 30, 32, or my long-term target of 35.

XAGUSD / SILVER Bearish Side Robbery Plan To Steal EverythingMy Dear Robbers / Traders,
This is our master plan to Heist XAGUSD SILVER Market based on Thief Trading style Technical Analysis.. kindly please follow the plan I have mentioned in the chart focus on Short entry. Our target is Green Zone that is High risk Dangerous level, market is oversold / Consolidation / Trend Reversal at the level Bullish Robbers / Traders gain the strength. Be safe and be careful and Be rich.
Note: If you've got a lot of money you can get out right away otherwise you can join with a swing trade robbers and continue the heist plan, Use Trailing SL to protect our money.
Stop Loss : Recent Swing High using 1h timeframe
Warning : Fundamental Analysis comes against our robbery plan. our plan will be ruined smash the Stop Loss. Don't Enter the market at the news update.
Loot and escape on the target 🎯 Swing Traders Plz Book the partial sum of money and wait for next breakout of dynamic level / Order block, Once it is cleared we can continue our heist plan to next new target.
Support our Robbery plan we can easily make money & take money 💰💵 Follow, Like & Share with your friends and Lovers. Make our Robbery Team Very Strong Join Ur hands with US. Loot Everything in this market everyday make money easily with Thief Trading Style.
