XAIUSDT Eyes Bullish BreakoutXAIUSDT Technical analsysi update
XAIUSDT has been trading within a parallel channel for the past 110 days. The price is now moving toward the channel's resistance, signaling a potential breakout. Additionally, the price is trading above the 100 EMA on the daily chart, further supporting a bullish outlook.
XAIUSDT

TradeCityPro | XAIUSDT - Buying Opportunity for a New Coin👋 Welcome to the TradeCityPro channel! Let's dive into XAI and analyze its technical structure, entry points, and potential scenarios.
🌍 Bitcoin’s Impact on Altcoins
Bitcoin has set another new high since yesterday, attracting global attention.
Its dominance in the global financial system now surpasses major banks like JPMorgan Chase, Bank of America, and ICBC China.
However, Bitcoin's dominance has started to decline on lower timeframes, creating opportunities for altcoins to rise, as mentioned in our previous analysis.
🕒 Weekly Timeframe Analysis
XAI has retraced nearly 90% from its ATH, typical for newly listed coins. These large corrections often result in the formation of accumulation boxes, where the price consolidates for an extended period.
With the current weekly candle nearing a breakout from the accumulation zone, there’s potential for an uptrend to begin. If this breakout fails, a stop-loss near 0.1680 can minimize losses.
Buy if the weekly candle closes above the current range , Set a stop-loss at 0.1680 for better risk management , Utilize XAI in DeFi platforms after a breakout for additional yield opportunities.
📆 Daily Timeframe Analysis
XAI remains range-bound between 0.1699 and 0.2583, showing clear signs of accumulation.
Higher lows indicate buying strength and the absence of strong sellers.
Each test of resistance (0.2583) is accompanied by increased volume, signaling interest from buyers.
After breaking 0.2583, consider a spot buy with a stop-loss at 0.2142 for a riskier but calculated entry.
⏱ 4-Hour Timeframe Analysis
sharp upward move has brought the price close to 0.2497, where immediate resistance lies.
📈 Long Position:
Buy after a confirmed breakout above 0.2497.
Watch for RSI to enter the overbought zone, as this often precedes sharp upward moves.
📉 Short Position:
Avoid shorting. Instead, wait for corrections and look for long opportunities at lower entry points near 0.2102.
🔄 XAI/Bitcoin Pair Analysis
The XAI/BTC pair shows a downtrend but with significant weakening momentum in recent times.
On lower timeframes, the pair may begin a new uptrend, which could result in faster and sharper moves in the XAI/USDT chart.
Break and confirm above 0.00000299 on the XAI/BTC chart to signal a stronger bullish move.
📝 Final Thoughts
XAI is showing promising signs of an impending breakout on multiple timeframes. Monitor key levels closely and manage risk with appropriate stop-loss settings.
This analysis reflects our opinions and is not financial advice.
Share your thoughts in the comments, and don’t forget to share this analysis with your friends! ❤️

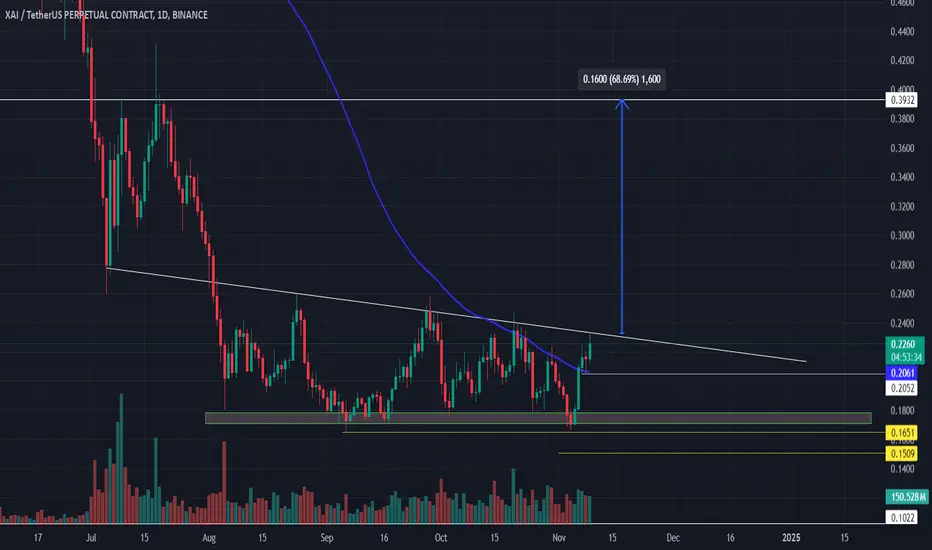
Last call for #XAI NASDAQ:XAI 1D;
For 4 months, it has been accumulating very smoothly and has now reached the end of the trend breakout.
Although it gave its first signal with the arrival of the MSS breakout, it will now start an uptrend with the closing above the -OB level.
In short, all the necessary infrastructure has been formed and it is only waiting for the trend to shift in this direction.
With a hard momentum candle, the first reaction level will be $0.39.
For the target, the Ath level can be considered in the first place. So exactly 6x the current level
#xai #ai

#XAI/USDT#XAI
The price is moving in a descending channel on the 4-hour frame and is sticking to it well
We have a bounce from the lower limit of the descending channel and we are now touching this support at 0.1860
We have an upward trend on the RSI indicator that is about to be broken, which supports the rise
We have a trend to stabilize above the moving average 100
Entry price 0.2110
First target 0.2302
Second target 0.2478
Third target 0.2668

XAIUSDT Breaks Out of Accumulation ZoneXAIUSDT Technical analysis update
XAIUSDT has been trading inside a rectangle pattern at the bottom for the last 100 days, which is considered an accumulation stage. The price is now breaking the rectangle resistance and has crossed the 100 EMA on the daily chart. We can expect a strong bullish move in the coming days.
Regards
Hexa

Long trade idea for XAIUSDT Long trade idea for XAIUSDT
Falling Wedge measured from Sept
Entry after pullback from 0.217 till 1.17
Potentially 483% profit
Note that there are Bearish Order Blocks as shown.
Do exercise due diligence and that all trades comes with risks.

XAI out of cage?xai was on consolidation zone from 3month & its giving breakout if price give breakout & sustain above trendline a big move is possible
target 0.4000$
XAIUSDTXAI ~ 3D
#XAI This looks like a Whale accumulation zone. if you have Conviction on this coin,. Maybe this support block will be a good buy for now.

#XAI/USDT#XAI
The price is moving in a descending channel on the 4-hour frame and is sticking to it very well and is expected to break it upwards
We have a bounce from a major support area at the lower line of the channel at 0.1750
We have a downtrend on the RSI indicator which supports the rise
We have a trend to stabilize above the moving average 100
Entry price 0.1800
First target 0.2000
Second target 0.2223
Third target 0.2450

#XAI Trendline Traders ( XAI going to breakout so soon)(((( Announcement for Trendline Traders ))))
*** #XAI going to breakout so soon***
#XAI
#XAIUSDT
#XAIUSD
BINANCE:XAIUSDT
#swingtrade
#shortterminvestment
#ALTCOIN
#Cryptotading
#cryptoinvesting
#investment
##trading
#cryptocurrencytrading
#bitcoininvestments
#Investing_Coins
#Investingcoins
#Crypto_investing
#Cryptoinvesting
**** #Manta ,#OMNI, #DYM, #AI, #IO, #XAI , #ACE #NFP #RAD #WLD #ORDI #BLUR #SUI #Voxel #AEVO #VITE #APE #RDNT #FLUX ****
#bitcoin
#BTC
#BTCUSDT

#XAI ,$XAI#XAI is in a very good range for #investors and #swing_trader
#trading #cryptocurrencytrading #bitcoininvestments #bitcoin #Investing_Coins , #Investingcoins, #Crypto_investing, #Cryptoinvesting, #investing, (#BTC, CRYPTOCAP:BTC , #Manta, #OMNI, #DYM, #AI, #IO, #XAI , #ACE)
BINANCE:XAIUSDT

XAIUSDT Chart Idea - Swing Long SetupXAIUSDT broke the falling wedge on daily TF in May and retested today on Friday 6/21. A little bullish BTC momentum can send this chart to the moon since it's a AI play as well. Taking a swing long for next few weeks from current price on the following confirmations.
Confirmations:
- Successfully retested the falling wedge breakout on daily TF
- Daily RSI is in oversold area
Swing Long Setup:
-- Entry: 0.5021
-- TP: 1.18 (0.618 Fib)
-- SL: 0.44


XAIUSDT Daily tf Range Updated till 09-07-24XAIUSDT Daily timeframe range. if it breaks below 0.2695 thats not looking good bravs a huge empty space with no backlog below it. it can retrace when market reverse or big pocket picks up, valid trade setup is in that point. recent resistance at 0.4320.

XAI ANALYSIS (12H)According to the data we have on the chart, XAI seems to be completing a large triangle.
In the green range, wave D (which is a diametric) is expected to end and then move towards the specified supply and again reject the supply strongly downwards.
Let's see what will happen
Closing a daily candle below the invalidation level will violate the analysis.
For risk management, please don't forget stop loss and capital management
When we reach the first target, save some profit and then change the stop to entry
Comment if you have any questions
Thank You

xai trade ideaXai is looking good and its in FVG now and big demand zone where we can see reversal to upside. Chart is very clear and everything is mentioned on the chart.

XAIUSDT.4HBased on the technical analysis of the XAI/USDT 4-hour chart provided, here’s a detailed and professional first-person analysis in English:
Upon examining the XAI/USDT 4-hour chart, several key technical indicators and levels emerge, providing insights into potential price movements.
Trend and Resistance Analysis:
The chart shows that XAI has experienced a significant decline from its high of 1.6370 USD but is currently in a consolidation phase with a slight upward movement. The current price is approximately 0.7934 USD. The price is attempting to break above the immediate resistance level marked as R1, around 0.8658 USD. A successful breakout above this level could lead the price to test the next significant resistance at R2, which is around 1.0747 USD.
Support Levels:
On the downside, the primary support level is identified as S1 at 0.5814 USD. This level has shown strong buying interest previously and could act as a floor if the price starts to decline. Below S1, the next significant support level is at 0.5814 USD, which has been a critical support zone in the past.
RSI and MACD Indicators:
The Relative Strength Index (RSI) is currently at 54.82, indicating a neutral position. The RSI is neither in the overbought nor oversold territory, suggesting that the market is currently undecided and waiting for a clear direction. The Moving Average Convergence Divergence (MACD) indicator shows a slight bullish trend, with the MACD line (blue) above the signal line (orange)
and the histogram indicating positive momentum. This suggests that bullish momentum is currently building.
Volume Analysis:
The volume pattern indicates moderate trading activity, with no significant spikes during recent price movements. This suggests balanced participation from both buyers and sellers, contributing to the current consolidation phase.
Conclusion:
In conclusion, the XAI/USDT pair is currently in a consolidative phase with a slight bullish bias. The RSI indicates a neutral position, while the MACD suggests building bullish momentum. Traders should closely monitor the support levels at 0.5814 USD and the resistance levels at 0.8658 USD and 1.0747 USD. A break above the resistance levels would confirm a bullish trend continuation, while a failure to hold the support levels could lead to further declines.
Overall, the market sentiment for XAI remains cautiously optimistic, with critical attention needed at the aforementioned levels and indicators to make informed trading decisions.

XAIUSD 3DXAI ~ 3D
#XAI Make purchases gradually after successfully breaking through the resistance line of this pattern, with a minimum target of 15%+

Xai will reach 1$?👀We can see a pattern of triple bottom pattern.once the breakdown done the we can see a good upside rally.
Go for long by using small time frame like 15min or 1hr.

XAi ready to the moon!I think that when it reaches 0.77-0.78, it clearly shows that it is a very good moment to buy. His target will be 1.22.
We are waiting for the resistance break at 0.77 and then BINANCE:XAIUSDT XAi will go to the moon.

XAIXAI is an innovative cryptocurrency that aims to leverage advanced algorithms to offer predictive analytics and automated trading strategies within the crypto markets. Its focus is on harnessing machine learning techniques to enhance investment decisions and optimize portfolio management.
Based on XAI's unique value proposition in the crypto analytics and trading sphere, and considering the current momentum, the next price targets for XAI might be $1.05, $1.40, and $2.80. Investors may want to capitalize on this bullish trend by entering at the current price. This trade idea exploits the growing trend towards incorporating AI and machine learning in financial technologies, which is increasingly attracting investment interest.

#XAI/USDT#XAI
We have a bearish channel pattern on a 12-hour frame, within which the price moves and adheres to its limits well.
We have a tendency to stabilize above moving average 100
We have a downtrend on the RSI indicator that supports the price higher when it is broken
Entry price is 0.6900
The first target is 0.8300
The second goal is 1.06
the third goal is 1.30

#XAI declination from the resistanceAfter fading the AI hype, XAI formed bearish pattern and it must breakup the trend resistance + ichimoku cloud. Not financial advice.
