HelenP I. Gold will little correct and then rise to top of wedgeHi folks today I'm prepared for you Gold analytics. If we look at the chart, we can see a clear ascending wedge pattern that has been guiding the price action. The structure is well-defined by a lower trend line providing consistent support and an upper resistance line. I believe that the key area to watch right now is the support zone between 3310 and 3295 points. The logic is that after the recent push, the price may undergo a small, healthy correction to test this zone's strength. The condition for our bullish scenario to unfold is a successful hold of this support; a bounce or signs of buyer interest in this area would be the confirmation we are looking for. Once this condition is met, I believe that gold will have enough momentum to continue its upward movement within the confines of the wedge. Therefore, the main goal for this scenario is set at 3415 points. This target is not arbitrary; it directly coincides with the resistance line of the wedge, which represents a logical point for the current upward swing to conclude. If you like my analytics you may support me with your like/comment.❤️
Disclaimer: As part of ThinkMarkets’ Influencer Program, I am sponsored to share and publish their charts in my analysis.
Xau-usd

GOLD | Testing Key Support at 3320 — Breakdown or Rebound Ahead?GOLD: Futures Dip as Dollar Strengthens, Eyes on 3320 Support
Gold futures declined as the U.S. dollar gained strength following President Trump’s denial of plans to fire Fed Chair Jerome Powell. While concerns over central bank independence persist, gold remains up over 26% YTD, supported by strong central bank demand and ongoing macro uncertainty.
Technical Outlook:
The price is now approaching the 3320–3312 zone.
A break below 3312 would trigger a bearish move from 3315 toward 3297 and 3281.
However, if the price stabilizes above 3320 on a 4H close, a bullish rebound may follow toward 3333 and 3342.
Key Levels:
Support: 3312, 3297, 3281
Resistance: 3333, 3342, 3363
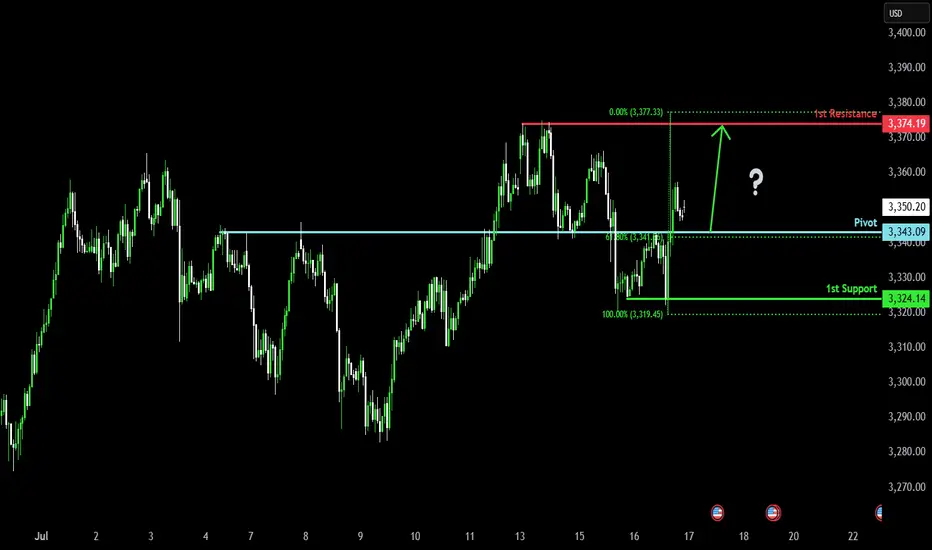
Bullish bounce off overlap support?The Gold (XAU/USD) is falling towards the pivot which has been identified as an overlap support and could bounce to the pullback resistance.
Pivot: 3,343.09
1st Support: 3,324.14
1st Resistance: 3,374.19
Risk Warning:
Trading Forex and CFDs carries a high level of risk to your capital and you should only trade with money you can afford to lose. Trading Forex and CFDs may not be suitable for all investors, so please ensure that you fully understand the risks involved and seek independent advice if necessary.
Disclaimer:
The above opinions given constitute general market commentary, and do not constitute the opinion or advice of IC Markets or any form of personal or investment advice.
Any opinions, news, research, analyses, prices, other information, or links to third-party sites contained on this website are provided on an "as-is" basis, are intended only to be informative, is not an advice nor a recommendation, nor research, or a record of our trading prices, or an offer of, or solicitation for a transaction in any financial instrument and thus should not be treated as such. The information provided does not involve any specific investment objectives, financial situation and needs of any specific person who may receive it. Please be aware, that past performance is not a reliable indicator of future performance and/or results. Past Performance or Forward-looking scenarios based upon the reasonable beliefs of the third-party provider are not a guarantee of future performance. Actual results may differ materially from those anticipated in forward-looking or past performance statements. IC Markets makes no representation or warranty and assumes no liability as to the accuracy or completeness of the information provided, nor any loss arising from any investment based on a recommendation, forecast or any information supplied by any third-party.
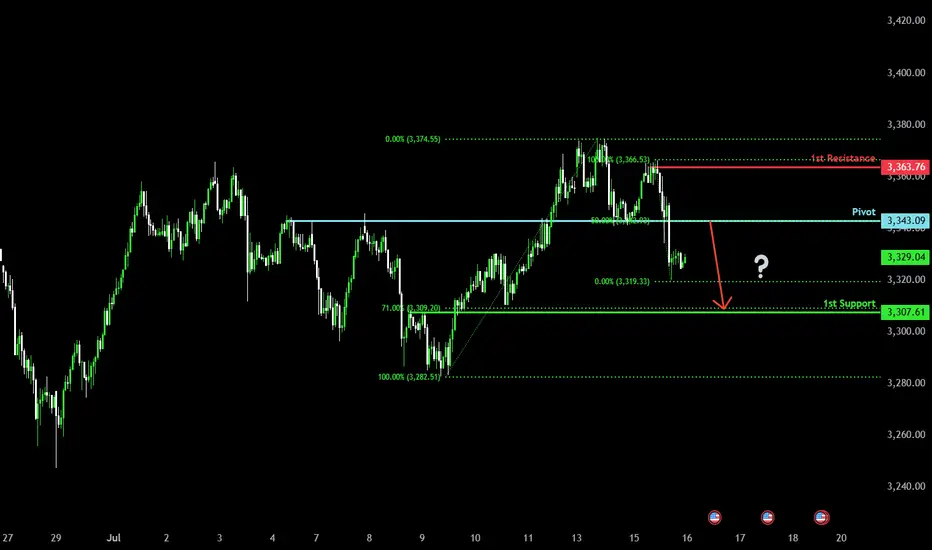
Major resistance ahead?The Gold (XAU/USD) is rising towards the pivot and could reverse to the overlap support.
Pivot: 3,343.09
1st Support: 3,307.61
1st Resistance: 3,363.76
Risk Warning:
Trading Forex and CFDs carries a high level of risk to your capital and you should only trade with money you can afford to lose. Trading Forex and CFDs may not be suitable for all investors, so please ensure that you fully understand the risks involved and seek independent advice if necessary.
Disclaimer:
The above opinions given constitute general market commentary, and do not constitute the opinion or advice of IC Markets or any form of personal or investment advice.
Any opinions, news, research, analyses, prices, other information, or links to third-party sites contained on this website are provided on an "as-is" basis, are intended only to be informative, is not an advice nor a recommendation, nor research, or a record of our trading prices, or an offer of, or solicitation for a transaction in any financial instrument and thus should not be treated as such. The information provided does not involve any specific investment objectives, financial situation and needs of any specific person who may receive it. Please be aware, that past performance is not a reliable indicator of future performance and/or results. Past Performance or Forward-looking scenarios based upon the reasonable beliefs of the third-party provider are not a guarantee of future performance. Actual results may differ materially from those anticipated in forward-looking or past performance statements. IC Markets makes no representation or warranty and assumes no liability as to the accuracy or completeness of the information provided, nor any loss arising from any investment based on a recommendation, forecast or any information supplied by any third-party.
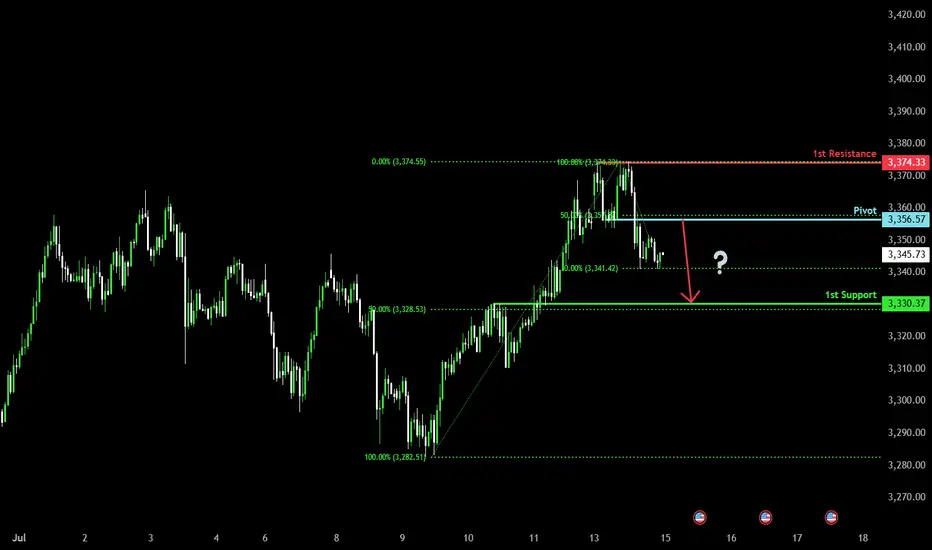
Beaish drop?The Gold (XAU/USD) is rising towards the pivot which aligns with the 50% Fibonacci retracement and could reverse to the 1st support.
Pivot: 3,356.57
1st Support: 3,330.37
1st Resistance: 3,374.33
Risk Warning:
Trading Forex and CFDs carries a high level of risk to your capital and you should only trade with money you can afford to lose. Trading Forex and CFDs may not be suitable for all investors, so please ensure that you fully understand the risks involved and seek independent advice if necessary.
Disclaimer:
The above opinions given constitute general market commentary, and do not constitute the opinion or advice of IC Markets or any form of personal or investment advice.
Any opinions, news, research, analyses, prices, other information, or links to third-party sites contained on this website are provided on an "as-is" basis, are intended only to be informative, is not an advice nor a recommendation, nor research, or a record of our trading prices, or an offer of, or solicitation for a transaction in any financial instrument and thus should not be treated as such. The information provided does not involve any specific investment objectives, financial situation and needs of any specific person who may receive it. Please be aware, that past performance is not a reliable indicator of future performance and/or results. Past Performance or Forward-looking scenarios based upon the reasonable beliefs of the third-party provider are not a guarantee of future performance. Actual results may differ materially from those anticipated in forward-looking or past performance statements. IC Markets makes no representation or warranty and assumes no liability as to the accuracy or completeness of the information provided, nor any loss arising from any investment based on a recommendation, forecast or any information supplied by any third-party.
Gold Bullish Above 3342 – Watching 3365 BreakoutGold Futures Rise on Trade & Geopolitical Tensions
Gold continues to gain as renewed tariff threats from the U.S. and rising geopolitical risks weigh on market sentiment.
While markets have become somewhat desensitized to Trump’s recurring trade rhetoric, concerns remain that resolutions may be delayed.
Technical Outlook:
As long as the price holds above 3342, the bullish trend is likely to continue toward 3355 and 3365.
A stable close above 3365 would open the way to 3395.
However, a 1H close below 3342 may trigger a pullback to 3329.
Pivot: 3342
Resistance: 3355, 3365, 3395
Support: 3329, 3319, 3309

XAUUSD 4Hour TF - July 13th, 2025XAUUSD 7/13/2025
XAUUSD 4 hour Long Idea
Monthly - Bullish
Weekly - Bullish
Daily - Bullish
4hour - Bullish
Gold is looking pretty bullish this week as we saw a significant push above our 3,320.000 resistance zone. Looking to ride that same trend through this next week.
Bullish continuation - After a nice rally last week gold looks primed for another long setup. Ideally, price action goes for the retest of 3,320.000 and forms a higher low. This would confirm bullish structure and we can begin targeting higher toward major levels of resistance.
Bearish Reversal - For us to consider bearish setups we would first need to see a break back below 3,320.000 followed by a confirmed lower high. If this happens we can consider short positions and look to target lower toward major levels of support.

Heading into Fibonacci confluence?XAU/USD is rising towards the resistance level, which is a pullback resistance aligning with the 127.2% Fibonacci extension, the 71% Fibonacci retracement, and the 100% Fibonacci projection. A reversal from this level could lead to our take profit
Entry: 3,392.02
Why we like it:
There is a pullback resistance that lines up with the 127.2% Fibonacci extension, the 71% Fibonacci retracement and the 100% Fibonacci projection.
Stop loss: 3,451.74
Why we like it:
There is a pullback resistance.
Take profit: 3,338.86
Why we like it:
There is a pullback support.
Enjoying your TradingView experience? Review us!
Please be advised that the information presented on TradingView is provided to Vantage (‘Vantage Global Limited’, ‘we’) by a third-party provider (‘Everest Fortune Group’). Please be reminded that you are solely responsible for the trading decisions on your account. There is a very high degree of risk involved in trading. Any information and/or content is intended entirely for research, educational and informational purposes only and does not constitute investment or consultation advice or investment strategy. The information is not tailored to the investment needs of any specific person and therefore does not involve a consideration of any of the investment objectives, financial situation or needs of any viewer that may receive it. Kindly also note that past performance is not a reliable indicator of future results. Actual results may differ materially from those anticipated in forward-looking or past performance statements. We assume no liability as to the accuracy or completeness of any of the information and/or content provided herein and the Company cannot be held responsible for any omission, mistake nor for any loss or damage including without limitation to any loss of profit which may arise from reliance on any information supplied by Everest Fortune Group.

Gold Eyes 3365 as Tariff Tensions Support Bullish MomentumGOLD OVERVIEW
Gold extended gains to around $3,329 amid a weaker dollar and ongoing tariff tensions, with markets reacting to new U.S. trade actions and divided Fed minutes on rate cuts.
Technical Outlook:
Gold remains bullish while above 3320.
A 1H close above 3342 opens the door to 3365.
A 1H close below 3314 will turn sentiment bearish toward 3297 and potentially 3282.
Resistance: 3330, 3342, 3365
Support: 3309, 3297, 3282

Falling towards 50% Fibonacci supprt?The Gold (XAU/USD) is falling towards the pivot and could bounce to the 1st resistance which is a pullback resistance.
Pivot: 3,306.96
1st Support: 3,287.36
1st Resistance: 3,342.69
Risk Warning:
Trading Forex and CFDs carries a high level of risk to your capital and you should only trade with money you can afford to lose. Trading Forex and CFDs may not be suitable for all investors, so please ensure that you fully understand the risks involved and seek independent advice if necessary.
Disclaimer:
The above opinions given constitute general market commentary, and do not constitute the opinion or advice of IC Markets or any form of personal or investment advice.
Any opinions, news, research, analyses, prices, other information, or links to third-party sites contained on this website are provided on an "as-is" basis, are intended only to be informative, is not an advice nor a recommendation, nor research, or a record of our trading prices, or an offer of, or solicitation for a transaction in any financial instrument and thus should not be treated as such. The information provided does not involve any specific investment objectives, financial situation and needs of any specific person who may receive it. Please be aware, that past performance is not a reliable indicator of future performance and/or results. Past Performance or Forward-looking scenarios based upon the reasonable beliefs of the third-party provider are not a guarantee of future performance. Actual results may differ materially from those anticipated in forward-looking or past performance statements. IC Markets makes no representation or warranty and assumes no liability as to the accuracy or completeness of the information provided, nor any loss arising from any investment based on a recommendation, forecast or any information supplied by any third-party.

Bullish reversal off major support?The Gold (XAU/USD) has bounced off the pivot and could rise to the 1st resistance which is an overlap resistance.
Pivot: 3,301.09
1st Support: 3,280.12
1st Resistance: 3,343.92
Risk Warning:
Trading Forex and CFDs carries a high level of risk to your capital and you should only trade with money you can afford to lose. Trading Forex and CFDs may not be suitable for all investors, so please ensure that you fully understand the risks involved and seek independent advice if necessary.
Disclaimer:
The above opinions given constitute general market commentary, and do not constitute the opinion or advice of IC Markets or any form of personal or investment advice.
Any opinions, news, research, analyses, prices, other information, or links to third-party sites contained on this website are provided on an "as-is" basis, are intended only to be informative, is not an advice nor a recommendation, nor research, or a record of our trading prices, or an offer of, or solicitation for a transaction in any financial instrument and thus should not be treated as such. The information provided does not involve any specific investment objectives, financial situation and needs of any specific person who may receive it. Please be aware, that past performance is not a reliable indicator of future performance and/or results. Past Performance or Forward-looking scenarios based upon the reasonable beliefs of the third-party provider are not a guarantee of future performance. Actual results may differ materially from those anticipated in forward-looking or past performance statements. IC Markets makes no representation or warranty and assumes no liability as to the accuracy or completeness of the information provided, nor any loss arising from any investment based on a recommendation, forecast or any information supplied by any third-party.

Bullish reversal off major support?XAU/USD has bounced off the support level which is an overlap support that lines up with the 76.4% Fibonacci projection and could rise from this level to our take profit.
Entry: 33,295.00
Why we like it:
There is an overlap support level that lines up with the 76.4% Fibonacci projection.
Stop loss: 3,278.48
Why we like it:
There is a pullback support level that aligns with the 100% Fibonacci projection.
Take profit: 3,338.86
Why we like it:
There is a pullback resistance level.
Enjoying your TradingView experience? Review us!
Please be advised that the information presented on TradingView is provided to Vantage (‘Vantage Global Limited’, ‘we’) by a third-party provider (‘Everest Fortune Group’). Please be reminded that you are solely responsible for the trading decisions on your account. There is a very high degree of risk involved in trading. Any information and/or content is intended entirely for research, educational and informational purposes only and does not constitute investment or consultation advice or investment strategy. The information is not tailored to the investment needs of any specific person and therefore does not involve a consideration of any of the investment objectives, financial situation or needs of any viewer that may receive it. Kindly also note that past performance is not a reliable indicator of future results. Actual results may differ materially from those anticipated in forward-looking or past performance statements. We assume no liability as to the accuracy or completeness of any of the information and/or content provided herein and the Company cannot be held responsible for any omission, mistake nor for any loss or damage including without limitation to any loss of profit which may arise from reliance on any information supplied by Everest Fortune Group.

Gold Recovers on Safe-Haven Flows Amid U.S. Trade UncertaintyFX:XAUUSD – Market Overview
Fundamental Outlook:
Gold has recovered from prior losses, stabilizing on the back of renewed safe-haven demand amid escalating global trade tensions.
Analysts point to growing concerns over a broader U.S.-led trade war, which has pushed investors toward gold as a defensive asset. While President Trump has delayed the reimplementation of tariffs until August 1 to allow for negotiation, markets remain cautious, and volatility is expected to persist.
Technical Outlook:
Gold is currently trading above the pivot level at 3320, which has a consolidation within 3320 - 3342 range
Stability above 3342 would likely extend the rally toward 3365, with 3356 as an intermediate resistance.
However, a 1H candle close below 3320 could shift momentum back to bearish, targeting 3297 and 3281.
Support Levels: 3312 / 3297 / 3281
Resistance Levels: 3342 / 3356 / 3365

Bearish reversal off pullback resistance?XAU/USD is rising towards the resistance level which is a pullback resistance that is slightly below the 38.2% Fibonacci retracement and could drop from this level too ur take profit.
Entry: 3,324.16
Why we like it:
There is a pullback resistance level that is slightly below the38.2% Fibonacci retracement.
Stop loss: 3,344.28
Why we like it:
There is an overlap resistance level that aligns with the 61.8% Fibonacci retracement.
Takeprofit: 3,295.40
Why we like it:
There is a pullback support level that aligns with the 61.8% Fibonacci retracement.
Enjoying your TradingView experience? Review us!
Please be advised that the information presented on TradingView is provided to Vantage (‘Vantage Global Limited’, ‘we’) by a third-party provider (‘Everest Fortune Group’). Please be reminded that you are solely responsible for the trading decisions on your account. There is a very high degree of risk involved in trading. Any information and/or content is intended entirely for research, educational and informational purposes only and does not constitute investment or consultation advice or investment strategy. The information is not tailored to the investment needs of any specific person and therefore does not involve a consideration of any of the investment objectives, financial situation or needs of any viewer that may receive it. Kindly also note that past performance is not a reliable indicator of future results. Actual results may differ materially from those anticipated in forward-looking or past performance statements. We assume no liability as to the accuracy or completeness of any of the information and/or content provided herein and the Company cannot be held responsible for any omission, mistake nor for any loss or damage including without limitation to any loss of profit which may arise from reliance on any information supplied by Everest Fortune Group.

Gold Holds Above 3342 Ahead of Key U.S Data –Bullish Bias IntactGold Rises as Market Awaits Key U.S. Economic Data
Gold prices are pushing higher as investors position ahead of today’s major U.S. economic releases, including NFP and unemployment figures. Expectations of weaker data are supporting bullish sentiment.
Technical Outlook (XAU/USD):
Gold maintains a bullish structure as long as it trades above 3,342.
→ A push toward 3,365 is likely
→ A 1H close above 3,365 would open the path toward 3,375
However, if price closes below 3,342 on the 1H chart, bearish momentum may build, targeting 3,331 and 3,320
Key Levels:
• Resistance: 3,365 / 3,375 / 3,390
• Support: 3,341 / 3,331 / 3,320

Bullish rise for the Gold?The price is reacting off the resistance level which is a pullback resistance and could potentially rise from this level to our take profit.
Entry: 3,344.54
Why we like it:
There is a pullback resistance level.
Stop loss: 3,302.57
Why we like it:
There is a pullback support level.
Take profit: 3,403.53
Why we like it:
There is a pullback resistance level that lines up with the 78.6% Fibonacci retracement.
Enjoying your TradingView experience? Review us!
Please be advised that the information presented on TradingView is provided to Vantage (‘Vantage Global Limited’, ‘we’) by a third-party provider (‘Everest Fortune Group’). Please be reminded that you are solely responsible for the trading decisions on your account. There is a very high degree of risk involved in trading. Any information and/or content is intended entirely for research, educational and informational purposes only and does not constitute investment or consultation advice or investment strategy. The information is not tailored to the investment needs of any specific person and therefore does not involve a consideration of any of the investment objectives, financial situation or needs of any viewer that may receive it. Kindly also note that past performance is not a reliable indicator of future results. Actual results may differ materially from those anticipated in forward-looking or past performance statements. We assume no liability as to the accuracy or completeness of any of the information and/or content provided herein and the Company cannot be held responsible for any omission, mistake nor for any loss or damage including without limitation to any loss of profit which may arise from reliance on any information supplied by Everest Fortune Group.

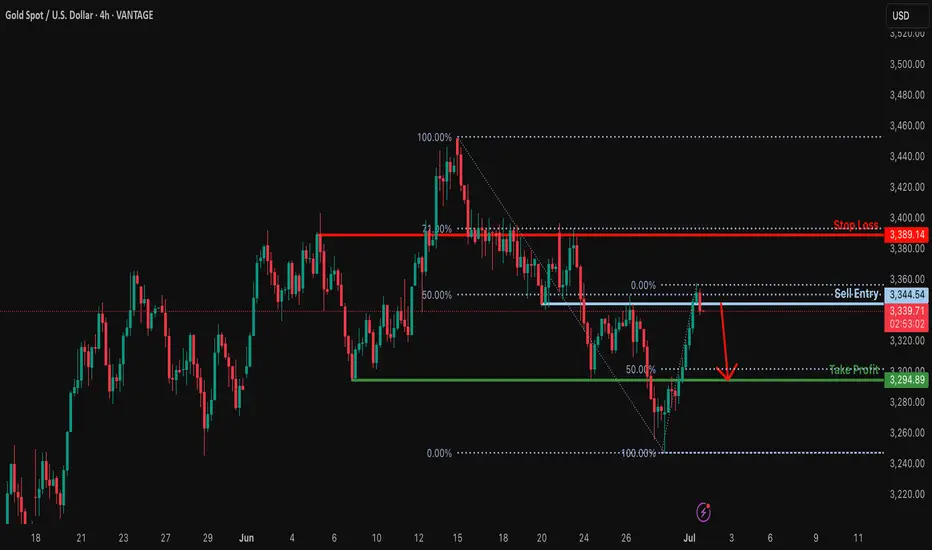
Bearish drop?XAU/USD is reacting off the resistance which is a pullback resistance that lines up with the 50% Fibonacci retracement and could drop from this level to our take profit.
Entry: 3,344.54
Why we like it:
There is a pullback resistance that lines up with the 50% Fibonacci retracement.
Stop loss: 3,389.14
Why we like it:
There is a pullback resistance that lines up with the 71% Fibonacci retracement.
Take prpofit: 3,294.89
Why we like it:
There is a pullback support level that aligns with the 50% Fibonacci retracement.
Enjoying your TradingView experience? Review us!
Please be advised that the information presented on TradingView is provided to Vantage (‘Vantage Global Limited’, ‘we’) by a third-party provider (‘Everest Fortune Group’). Please be reminded that you are solely responsible for the trading decisions on your account. There is a very high degree of risk involved in trading. Any information and/or content is intended entirely for research, educational and informational purposes only and does not constitute investment or consultation advice or investment strategy. The information is not tailored to the investment needs of any specific person and therefore does not involve a consideration of any of the investment objectives, financial situation or needs of any viewer that may receive it. Kindly also note that past performance is not a reliable indicator of future results. Actual results may differ materially from those anticipated in forward-looking or past performance statements. We assume no liability as to the accuracy or completeness of any of the information and/or content provided herein and the Company cannot be held responsible for any omission, mistake nor for any loss or damage including without limitation to any loss of profit which may arise from reliance on any information supplied by Everest Fortune Group.
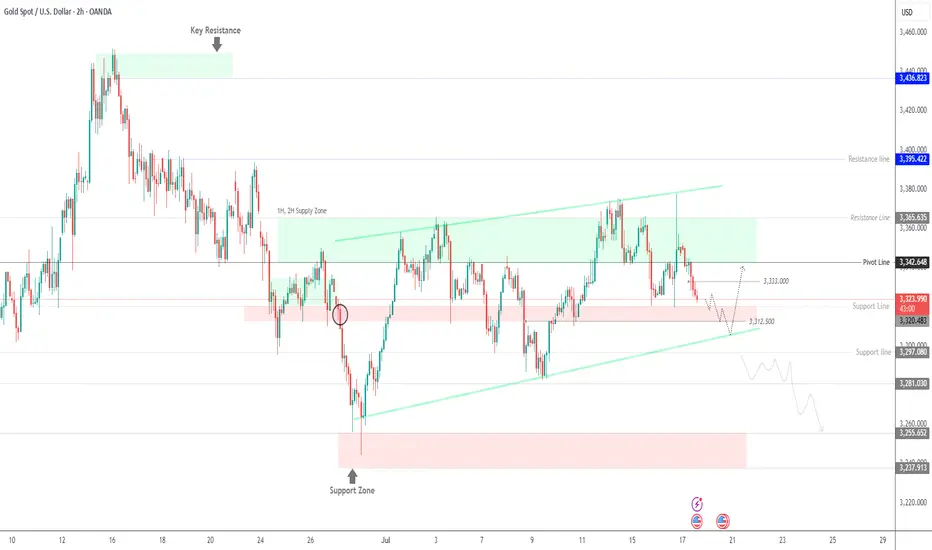
XAU/USD – Testing 2H/1H Supply Zone | Breakout or Rejection?XAU/USD – Testing 1H/2H Supply Zone | Bullish Continuation or Rejection Ahead
Gold has rallied strongly from the support zone around 3,238–3,255, breaking multiple intraday resistance levels and now approaching a critical 1H/2H Supply Zone near 3,348–3,366.
This area previously acted as a strong sell-off zone, making it a key decision point.
Scenario 1: Bullish Continuation
If price breaks and closes above 3,366 with momentum, we could see further upside toward the next resistance at 3,400 and possibly retest the ATH zone at 3,486. A short consolidation or retest within the zone would confirm strength.
Scenario 2: Rejection from Supply Zone
If the supply holds, a rejection from the zone could lead to a pullback toward:
3,320.48 (minor support)
3,297.08 (support line)
Or deeper retracement to the 3,255–3,238 support zone
Key Technical Levels
Supply Zone: 3,348 – 3,366
Resistance: 3,400 – 3,486 (ATH)
Support Levels: 3,320 – 3,297 – 3,255 – 3,238
Pivot Line: 3,348

Bullish bounce off major support?XAU/USD has bounced off the support level which is an overlap support and could rise from this level to our take profit.
Entry: 3,265.39
Why we like it:
There is an overlap support level.
Stop loss: 3,121.15
Why we like it:
There is a pullback support level that aligns with the 145% Fibonacci extension.
Take profit: 3,344.54
Why we like it:
There is a pullback resistance that lines up with the 50% Fibonacci retracement.
Enjoying your TradingView experience? Review us!
Please be advised that the information presented on TradingView is provided to Vantage (‘Vantage Global Limited’, ‘we’) by a third-party provider (‘Everest Fortune Group’). Please be reminded that you are solely responsible for the trading decisions on your account. There is a very high degree of risk involved in trading. Any information and/or content is intended entirely for research, educational and informational purposes only and does not constitute investment or consultation advice or investment strategy. The information is not tailored to the investment needs of any specific person and therefore does not involve a consideration of any of the investment objectives, financial situation or needs of any viewer that may receive it. Kindly also note that past performance is not a reliable indicator of future results. Actual results may differ materially from those anticipated in forward-looking or past performance statements. We assume no liability as to the accuracy or completeness of any of the information and/or content provided herein and the Company cannot be held responsible for any omission, mistake nor for any loss or damage including without limitation to any loss of profit which may arise from reliance on any information supplied by Everest Fortune Group.

XAUUSD 4hour TF - June 29th, 2025XAUUSD 4hour Neutral Idea
Monthly - Bullish
Weekly - Bullish
Daily - Bullish
4hour - Bearish
Gold has been on the rally of a century for a while and isn’t showing too many signs of slowing down long term. For now we do have a couple opportunities I can bring to your attention.
4hour bearish continuation - For this to happen we would like to see price action come back to our pocket of confluence near the 3,320.000 level followed by bearish conviction. If this happens look to target lower toward major support levels like 3,225.500.
4hour trend reversal - If we are to see a reversal of the 4hour trend we would need to see price action pop back above the 3,320.000 resistance area. Look for strong bullish conviction above this level and target higher toward appropriate levels of resistance.

Gold Holds Above $3340 as Dollar Drops and Fed Uncertainty Rises GOLD OVERVIEW
Gold Holds Gains as Dollar Weakens and Fed Uncertainty Grows
Gold climbed above $3,340 per ounce on Thursday, supported by a sharp decline in the U.S. dollar amid growing dovish expectations from the Federal Reserve.
Adding to market speculation, U.S. President Donald Trump hinted he may announce a new Fed Chair as early as September or October, potentially reducing Jerome Powell’s influence before his term ends in June and boosting expectations for a more accommodative policy stance.
TECHNICAL OUTLOOK – XAU/USD
Gold shows bearish potential if the price can stabilize below the pivot level at 3,341.
However, while trading above 3,341, a short-term correction toward 3,364–3,365 is likely before any renewed selling pressure.
Today’s U.S. GDP release may add further volatility and direction to the market.
Key Levels
Pivot Line: 3,341
Resistance: 3,364 → 3,373
Support: 3,320 → 3,302
previous idea:

Bullish breakout for the Gold?The price is reacting off the resistance level which is a pullback resistance that aligns with the 50% Fibonacci retracement and a breakout of this level could lead the price from this level to our take profit.
Entry: 3,343.14
Why we like it:
There is a pullback resistance level that lines up with the 50% Fibonacci retracement.
Stop loss: 3,296.15
Why we like it:
There is a pullback support level.
Take profit: 3,390.77
Why we like it:
There is a pullback resistance level that aligns with the 61.8% Fibonacci retracement.
Enjoying your TradingView experience? Review us!
Please be advised that the information presented on TradingView is provided to Vantage (‘Vantage Global Limited’, ‘we’) by a third-party provider (‘Everest Fortune Group’). Please be reminded that you are solely responsible for the trading decisions on your account. There is a very high degree of risk involved in trading. Any information and/or content is intended entirely for research, educational and informational purposes only and does not constitute investment or consultation advice or investment strategy. The information is not tailored to the investment needs of any specific person and therefore does not involve a consideration of any of the investment objectives, financial situation or needs of any viewer that may receive it. Kindly also note that past performance is not a reliable indicator of future results. Actual results may differ materially from those anticipated in forward-looking or past performance statements. We assume no liability as to the accuracy or completeness of any of the information and/or content provided herein and the Company cannot be held responsible for any omission, mistake nor for any loss or damage including without limitation to any loss of profit which may arise from reliance on any information supplied by Everest Fortune Group.

Potential bullish rise?The Gold (XAU/USD) is reacting off the pivot and could rise to the 1st resistance.
Pivot: 3,334.86
1st Support: 3,315.22
1st Resistance: 3,356.66
Risk Warning:
Trading Forex and CFDs carries a high level of risk to your capital and you should only trade with money you can afford to lose. Trading Forex and CFDs may not be suitable for all investors, so please ensure that you fully understand the risks involved and seek independent advice if necessary.
Disclaimer:
The above opinions given constitute general market commentary, and do not constitute the opinion or advice of IC Markets or any form of personal or investment advice.
Any opinions, news, research, analyses, prices, other information, or links to third-party sites contained on this website are provided on an "as-is" basis, are intended only to be informative, is not an advice nor a recommendation, nor research, or a record of our trading prices, or an offer of, or solicitation for a transaction in any financial instrument and thus should not be treated as such. The information provided does not involve any specific investment objectives, financial situation and needs of any specific person who may receive it. Please be aware, that past performance is not a reliable indicator of future performance and/or results. Past Performance or Forward-looking scenarios based upon the reasonable beliefs of the third-party provider are not a guarantee of future performance. Actual results may differ materially from those anticipated in forward-looking or past performance statements. IC Markets makes no representation or warranty and assumes no liability as to the accuracy or completeness of the information provided, nor any loss arising from any investment based on a recommendation, forecast or any information supplied by any third-party.
