HelenP. I Gold will rebound of resistance zone and start fallHi folks today I'm prepared for you Gold analytics. Some days ago price declined to the trend line, and even fell lower, breaking this line, but soon turned around and made impulse up to the 2275 support level, which coincided with the support zone. Soon, Gold broke this level, made a retest, and continued to grow to the resistance level, which coincided with the resistance zone too, after which rebounded and declined to the trend line. Then the price broke this line again and fell to the 2275 support level, where it some time traded and later rebounded and started to move up to the 2430 level. When Gold reached the resistance level, it even entered to resistance zone, but after it touched the trend line, XAU at once rebounded and declined below the 2430 level, making a fake breakout. Just now, the price continues to trades near this level and I expect that Gold will enter to resistance zone again and then start to decline. Therefore I set my goal at 2355 points. If you like my analytics you may support me with your like/comment ❤️
Xau-usd

XAUUSD Bullish scenario - 4HRSimple trading - Cup and handle pattern
Watch gold to see if the handle will be filled. I have marked the probable retracement using the FIBB (purple lines) If gold manages to hold above .618 or 2340 we can look to continue buying.
With the DXY making its way back up after testing previous support (104.05) it is only a matter of time before GOLD gets the pullback it deserves. If GOLD wants to remain bullish on the macro level it needs to make a macro pullback to gain its momentum.
This week Powell gave the dollar a bullish outlook for the remaining quarters. With a natural dollar into Q2, start taking profits on buys and get ready for more sell pressure in the markets.
**Gold bearish scenario will come out this weekend if gold remains below 2400.
These are just my thoughts, not financial advice.

Potential bullish rise off 38.2% Fibonacci support?XAU/USD has just bounced off the support level which is an overlap support that lines up with the 38.2% and the 50% Fibonacci retracement and could potentially rise from this level to our take profit.
Entry: 2,374.74
Why we like it:
There is an overlap support level which lines up with the 38.2% and the 50% Fibonacci retracement.
Stop loss: 2,358.30
Why we like it:
There is a pullback support level which aligns with the 61.8% Fibonacci retracement.
Take profit: 2,397.10
Why we like it:
There is a pullback resistance level.
Please be advised that the information presented on TradingView is provided to Vantage (‘Vantage Global Limited’, ‘we’) by a third-party provider (‘Everest Fortune Group’). Please be reminded that you are solely responsible for the trading decisions on your account. There is a very high degree of risk involved in trading. Any information and/or content is intended entirely for research, educational and informational purposes only and does not constitute investment or consultation advice or investment strategy. The information is not tailored to the investment needs of any specific person and therefore does not involve a consideration of any of the investment objectives, financial situation or needs of any viewer that may receive it. Kindly also note that past performance is not a reliable indicator of future results. Actual results may differ materially from those anticipated in forward-looking or past performance statements. We assume no liability as to the accuracy or completeness of any of the information and/or content provided herein and the Company cannot be held responsible for any omission, mistake nor for any loss or damage including without limitation to any loss of profit which may arise from reliance on any information supplied by Everest Fortune Group.

xauusd: Bullish but overbought Near the peak of a mid-term bullish channel, we're slightly overbought, suggesting a mild correction or a couple of days of consolidation for the pair. Keep an eye on unemployment news, as possible change of direction in the market
Could price drop from the 61.8% Fibonacci resistance?The gold (XAU/USD) has just reacted off the pivot which has been identified as an overlap resistance and could drop to the 1st support.
Pivot: 2,359.93
1st Support: 2,331.99
1st Resistance: 2,378.45
Risk Warning:
Trading Forex and CFDs carries a high level of risk to your capital and you should only trade with money you can afford to lose. Trading Forex and CFDs may not be suitable for all investors, so please ensure that you fully understand the risks involved and seek independent advice if necessary.
Disclaimer:
The above opinions given constitute general market commentary, and do not constitute the opinion or advice of IC Markets or any form of personal or investment advice.
Any opinions, news, research, analyses, prices, other information, or links to third-party sites contained on this website are provided on an "as-is" basis, are intended only to be informative, is not an advice nor a recommendation, nor research, or a record of our trading prices, or an offer of, or solicitation for a transaction in any financial instrument and thus should not be treated as such. The information provided does not involve any specific investment objectives, financial situation and needs of any specific person who may receive it. Please be aware, that past performance is not a reliable indicator of future performance and/or results. Past Performance or Forward-looking scenarios based upon the reasonable beliefs of the third-party provider are not a guarantee of future performance. Actual results may differ materially from those anticipated in forward-looking or past performance statements. IC Markets makes no representation or warranty and assumes no liability as to the accuracy or completeness of the information provided, nor any loss arising from any investment based on a recommendation, forecast or any information supplied by any third-party.

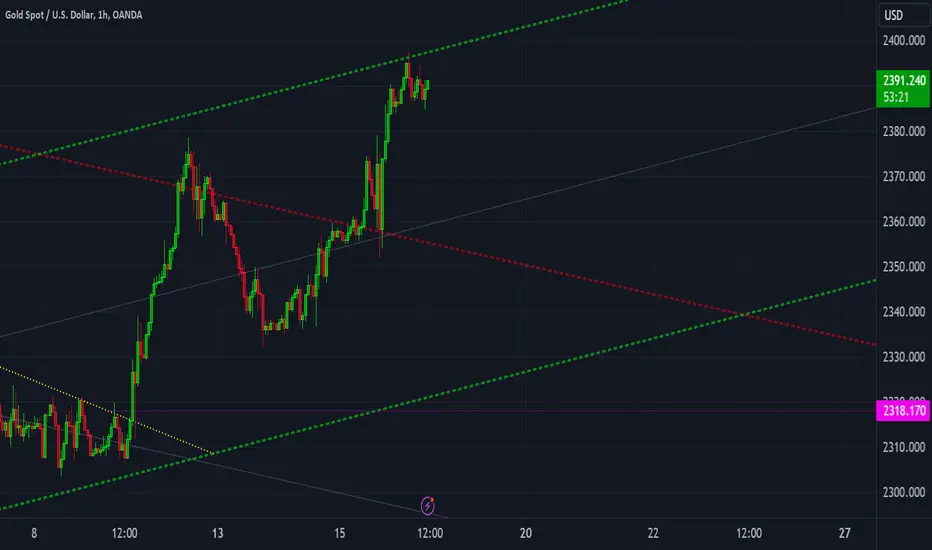
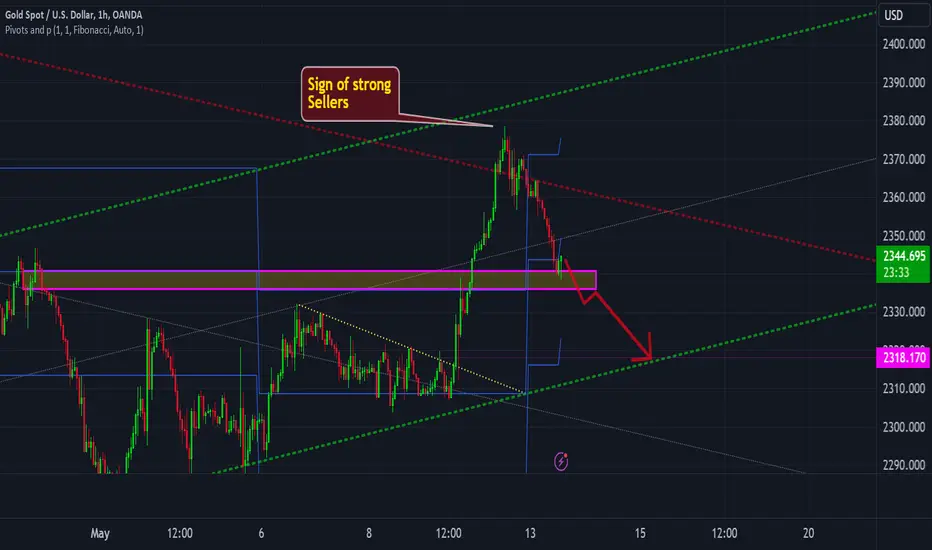
GOLDThe gap between the bullish channel's top border and the current price, along with the fake breakout, indicates significant bearish momentum.
If you entered a short position at the top of the channel, consider partially exiting now and holding the remainder until around 2318.17.
Potential bullish bounce off 61.8% Fibonacci support?Gold (XAU/USD) has just bounced off the pivot which has been identified as a pullback support and could potentially rise to the 1st resistance.
Pivot: 2,331.93
1st Support: 2,306.80
1st Resistance: 2,377.03
Risk Warning:
Trading Forex and CFDs carries a high level of risk to your capital and you should only trade with money you can afford to lose. Trading Forex and CFDs may not be suitable for all investors, so please ensure that you fully understand the risks involved and seek independent advice if necessary.
Disclaimer:
The above opinions given constitute general market commentary, and do not constitute the opinion or advice of IC Markets or any form of personal or investment advice.
Any opinions, news, research, analyses, prices, other information, or links to third-party sites contained on this website are provided on an "as-is" basis, are intended only to be informative, is not an advice nor a recommendation, nor research, or a record of our trading prices, or an offer of, or solicitation for a transaction in any financial instrument and thus should not be treated as such. The information provided does not involve any specific investment objectives, financial situation and needs of any specific person who may receive it. Please be aware, that past performance is not a reliable indicator of future performance and/or results. Past Performance or Forward-looking scenarios based upon the reasonable beliefs of the third-party provider are not a guarantee of future performance. Actual results may differ materially from those anticipated in forward-looking or past performance statements. IC Markets makes no representation or warranty and assumes no liability as to the accuracy or completeness of the information provided, nor any loss arising from any investment based on a recommendation, forecast or any information supplied by any third-party.

XAUUSD 12/5/24For this week on gold we're looking for price to play within the bullish range that it created on Friday price played pretty much perfectly within our bias that we gave out last Sunday. Following the same principle we have tapped into the 50% of the bearish auto block above meaning that we are expecting price to drop lower and break out of the range that we are in currently in or for this range to hold and take us to a new all time high which would be above the daily high that we have marked on our chart here.
Points to watch for this week are the order block we have marked which is the one responsible for taking us higher out of the trend line liquidity structure that we have marked, The lower 50% of the order block that created are new range and the fifty percent of the higher time frame water block that we are currently reacting off of. personally I am expecting price to drop down at the beginning of the week giving us eight possible bullish scenario midweek but of course the red folded news will determine this we are overall bullish on the major higher time frames for this pair so I am looking for bullish movements if we do maintain this range.
Read what price shows you and follow the trend! always trade with the correct risk!

GOLD, xauusd: We've observed a break in the bullish trend line and a response to the high time frame (HTF) zone, coinciding with the bearish long-term channel.
A short-term bearish channel is clearly visible.
First Entry: Wait for resistance around the weekly pivot. Only enter if the price shows no signs of rise for some candles.
Second Entry: After breaking above 1.076, consider entering around the cluster of daily pivots and within the bearish channel.

XAUUSD - 15m Sell 4 Scalperswe are tracking a descending channel pattern, outlined by the red boundaries.
Currently, gold's price has rallied to the upper resistance of the channel, marking a pivotal moment for traders.
Should the price adhere to the channel's resistance, we anticipate a potential reversal heading back down.
However, unlike previous lows, a higher low is expected this time around, likely within the green highlighted support zone, suggesting a nuanced adjustment in market sentiment and providing a strategic entry point for those monitoring this precious metal's price movements.

XAUUSD | 30 Min Safe ZoneXAUUSD | 30 Min Safe Zone
Hey Traders ! Hope you are doing well
Keep trading simple with us ..
- Resistance Levels 2316.00
- Next Resistance Levels at 2321.79
- Firstly we have to observed the circle which indicates if #XAUUSD break the Trendline our
Target would be at 2331.00 and then 2344.00
- If #Gold completely reject the Trend line our Targets would be 2307.00 - 2303.00 - 2291.00
Don't be hurry in taking false positions
Stick with our Decisions
Cheers and wait for the next Confirmations

Potential bullish bounce?Gold (XAU/USD) is falling towards the pivot and could potentially bounce to the 1st resistance.
Pivot: 2,284.24
1st Support: 2,265.35
1st Resistance: 2,327.67
Risk Warning:
Trading Forex and CFDs carries a high level of risk to your capital and you should only trade with money you can afford to lose. Trading Forex and CFDs may not be suitable for all investors, so please ensure that you fully understand the risks involved and seek independent advice if necessary.
Disclaimer:
The above opinions given constitute general market commentary, and do not constitute the opinion or advice of IC Markets or any form of personal or investment advice.
Any opinions, news, research, analyses, prices, other information, or links to third-party sites contained on this website are provided on an "as-is" basis, are intended only to be informative, is not an advice nor a recommendation, nor research, or a record of our trading prices, or an offer of, or solicitation for a transaction in any financial instrument and thus should not be treated as such. The information provided does not involve any specific investment objectives, financial situation and needs of any specific person who may receive it. Please be aware, that past performance is not a reliable indicator of future performance and/or results. Past Performance or Forward-looking scenarios based upon the reasonable beliefs of the third-party provider are not a guarantee of future performance. Actual results may differ materially from those anticipated in forward-looking or past performance statements. IC Markets makes no representation or warranty and assumes no liability as to the accuracy or completeness of the information provided, nor any loss arising from any investment based on a recommendation, forecast or any information supplied by any third-party.

Sell XAUUSD Channel BreakoutThe XAU/USD pair (spot gold) on the M30 timeframe presents a potential shorting opportunity due to a recent downward breakout from a well-defined bearish channel pattern. This breakout suggests a shift in momentum towards the downside and a higher likelihood of further price declines in the coming hours.
Key Points:
Sell Entry: Consider entering a short position (selling) below the broken support level of the channel, ideally around 2322 after confirmation of the breakout. This offers an entry point close to the perceived shift in momentum.
Target Levels: Initial bearish targets lie at the previous support levels within the channel, now acting as potential resistance zones:
2294: This represents the first level of support within the channel.
2279: This is a further extension of the downside target, based on the height of the recent price movement before the breakout.
Stop-Loss: To manage risk, place a stop-loss order above the broken support line of the channel, ideally around 2332. This helps limit potential losses if the price unexpectedly reverses and breaks back upwards.
Thank you.

Sell XAUUSD Bearish PennantThe XAU/USD pair (spot gold) on the M30 timeframe presents a potential shorting opportunity due to the presence of a bearish flag pattern following a strong downward move.
Potential Short Trade :
Entry: Consider entering a short position (selling) below the broken support trendline of the flag after confirmation. Ideally, this would be around 2330 or lower if the price continues to decline.
Target Levels:
2272: This represents the height of the flag, measured from the flagpole (initial downtrend) to the top of the flag, projected downwards from the breakout point.
2240: This is a further extension of the downside target, based on the height of the flagpole.
Stop-Loss: Once the entry point is confirmed, place a stop-loss order above the broken support line of the flag, ideally with some buffer around 2340. This helps limit potential losses if the price unexpectedly reverses and breaks back upwards.
Thank you.

Buy XAUUSD Channel BreakoutThe XAU/USD pair (spot gold) on the M30 timeframe presents a potential buying opportunity due to a recent upward breakout from a well-defined bullish channel pattern. This breakout suggests a shift in momentum towards the upside and a higher likelihood of further price increases in the coming hours.
Key Points:
Buy Entry: Consider entering a long position (buying) above the broken resistance level of the channel, ideally around 2320 after confirmation of the breakout. This offers an entry point close to the perceived shift in momentum.
Target Levels: Initial bullish targets lie at the following points:
2373: This represents the height of the channel, measured from the channel's base (opposite trendline) to the breakout point, projected upwards from the breakout.
2410: This is a further extension of the upside target, based on the height of the recent price movement before the breakout.
Stop-Loss: To manage risk, place a stop-loss order below the broken resistance line of the channel, ideally around 2290. This helps limit potential losses if the price unexpectedly reverses and breaks back downwards.
Thank you.

GOLD | APR 24 2024Running in good profit here, although longer than I expected. Moved my stops slightly below entry to cover the swap fees

Sell Stop adjustmentLearned I can press record ! LEts see if this adjustment to the sell stop pays off

Sell Stop GCM2024Been a while, Ill be getting back i the mix, didnt see a set up yesterday I liked for Technical Tuesday, heres what I like today.

HelenP. I Gold will correct to support level and then rebound upHi folks today I'm prepared for you Gold analytics. A few moments ago price reached the support level, which coincided with the support zone, but at once rebounded and declined to the trend line. After this movement, XAU turned around and made a strong impulse up, breaking the 2300 level, after which it rose a little more. Later Gold corrected, after which in a short time rose to a resistance level, which coincided with the resistance zone. Also, the price broke this level and rose a little more, but soon it turned around and made an impulse down to the trend line, breaking the 2400 level again. After this movement, the price in a short time rose to the resistance level and then made a strong impulse down to the support level, thereby breaking the trend line. As well price formed a pennant pattern, but for this day XAU continues to trades near the 2300 support level and I expect that Gold will make a correction to the support level and then rebound up. That's why I set my target at 2350 points. If you like my analytics you may support me with your like/comment ❤️

Gold (Xau/Usd) Symmetrical TriangleSymmetrical Triangle Pattern on Gold (XAU/USD) H1 Chart
A symmetrical triangle pattern has been identified on the H1 chart for Gold (XAU/USD). Here's a breakdown of its characteristics:
Description:
This pattern is formed by two converging trendlines, one drawn above the highs and another below the lows, with price action oscillating between them and creating a triangular shape.
The trendlines ideally have a similar slope, making the triangle symmetrical.
Potential Interpretations:
Continuation Pattern: Often, symmetrical triangles act as continuation patterns. If the price breaks above the resistance trendline (upper trendline), it suggests a potential continuation of the previous uptrend. Conversely, a break below the support trendline (lower trendline) might indicate a continuation of the downtrend.
Reversal Pattern: In some cases, symmetrical triangles can precede reversals. A breakout above resistance could signal a bullish reversal, while a breakdown below support might indicate a bearish reversal.
Additional Considerations:
Volume: Ideally, there should be a decrease in volume as the triangle progresses, suggesting dwindling momentum before the breakout.
Volatility: A breakout is often accompanied by a surge in volatility.
Trading the Pattern:
Breakout Confirmation: Wait for a confirmed breakout above resistance or below support before entering a trade in the direction of the breakout.
Stop-Loss: Place a stop-loss order below the support trendline for long positions and above the resistance trendline for short positions.
Profit Target: Potential profit targets can be based on the height of the triangle or technical indicators.
Thank you.

Could XAU/USD reverse from here?Price is rising towards a resistance level which is a pullback resistance that aligns with the 38.2% Fibonacci retracement and could reverse from this level to our take profit.
Entry: 2358.67
Why we like it:
There is a pullback resistance level which aligns with the 38.2% Fibonacci retracement.
Stop loss: 2399.92
Why we like it:
There is a pullback resistance level
Take profit: 2305.31
Why we like it:
There is a pullback support level which aligns with the 61.8% Fibonacci retracement.
Please be advised that the information presented on TradingView is provided to Vantage (‘Vantage Global Limited’, ‘we’) by a third-party provider (‘Everest Fortune Group’). Please be reminded that you are solely responsible for the trading decisions on your account. There is a very high degree of risk involved in trading. Any information and/or content is intended entirely for research, educational and informational purposes only and does not constitute investment or consultation advice or investment strategy. The information is not tailored to the investment needs of any specific person and therefore does not involve a consideration of any of the investment objectives, financial situation or needs of any viewer that may receive it. Kindly also note that past performance is not a reliable indicator of future results. Actual results may differ materially from those anticipated in forward-looking or past performance statements. We assume no liability as to the accuracy or completeness of any of the information and/or content provided herein and the Company cannot be held responsible for any omission, mistake nor for any loss or damage including without limitation to any loss of profit which may arise from reliance on any information supplied by Everest Fortune Group.

GOLD | APR 22 2024Still holding sells on XAUUSD. Dollar strength is getting abnormal mass bullish sentiment, which sets the market back into risk off regime and thus dollar long plays have become the thing to capitalize off of.

GOLD - Price can turn around and start decline to support areaHi guys, this is my overview for XAUUSD, feel free to check it and write your feedback in comments👊
Some days ago price traded near $2030 support level, which coincided with support area and even declined below.
But later XAU turned around and in a short time rose higher $2030 level, breaking it, and continued to grow in rising channel.
In channel, price reached resistance line, after which Gold bounced and fell to support line and then made an upward impulse.
After this movement, Gold broke $2330 level, thereby exiting from channel too, and then price made retest.
Next, price in a short time rose to $2433 points and at once fell back, but now Gold trades near resistance line.
In my mind, XAU can rise a little higher than resistance line and then bounce down to $2305 support area.
If this post is useful to you, you can support me with like/boost and advice in comments❤️
