XAUUSD GOLD: What I'm watching this weekGold has been on a retracement since the May 4th high. At the end of last week it broke but failed to close below the 61.8 fib of the last impulse move up, this is an interesting level as it may indicate the retracement is done?
To the upside though we have a falling dynamic trendline that's acted as resistance since the early May peak. That peak at 2066 matches the peak in March, which could be a double top (however needs to break 1680 neckline for confirmation of a full reversal imho).
So are we looking at a small retracement, or the start of a reversal? It's too early to say, however looking at DXY we seem to be building momentum, and if we see further strength this week in the USD then this should put more pressure on Gold, and I expect a fall-back to support around 1865.
Breaking the trendline and resistance to the upside, if confirmed with a breakout and retest of the descending trendline, should see us return to resistance around 1975.
Personally I think gold is reversing, I believe we will see more USD strength, and Gold will either drop from here, or drop from the 1975 level, without reaching May's high again for some time.
As always I'm monitoring trendlines and the LTF's for any suitable entries.
Xau-usd

XAUUSD (GOLD)XAUUSD now at OB and rejected from OB i think now rise to making new HH and break last HH maybe it take some time but i think do these in these year

XAUUSD 29/06/2023Details on chart - looking to see more sells come into fruition if data comes out better than expected

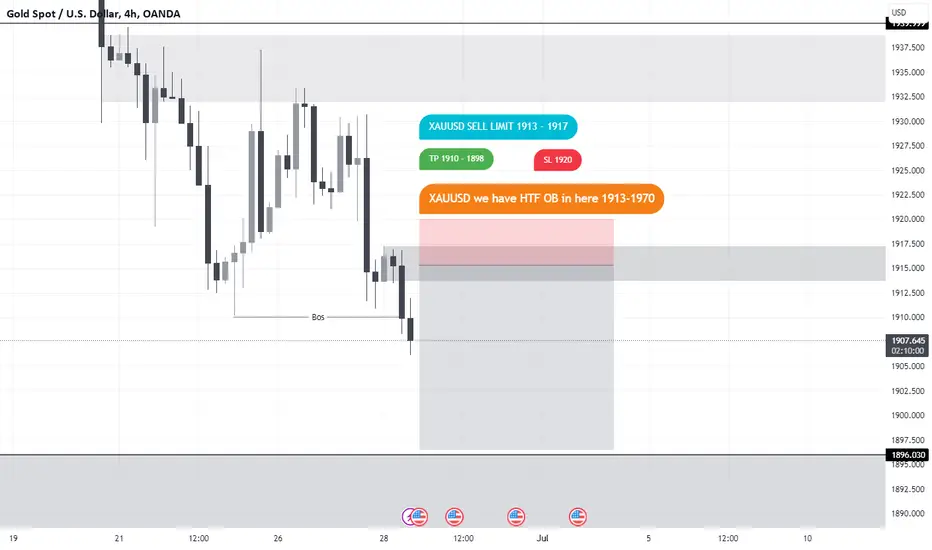
XAUUSD (GOLD) SELL LIMIT 1913-1917XAUUSD we have HTF OB in 4H time frame if can't break the zone we can sell in here and tp 1910 to support zone 1890 and if can break can rise to next OB 1932-1938
GOLD - FUNDAMENTAL ANALYSISGold Price Forecasts Revised Lower For Year-End 2023 And 2024 At ABN AMRO
In her extensive XAU strategic note to clients, Georgette Boele, Senior Economist at ABN AMRO warns of a downgrade to the bank's 2023 and 2024 gold price forecasts.
The analyst cites the gold price being close to all-time highs, a level that should it fall, might not be seen for another five years. With FED monetary policy easing being prices-in, the upside is likely to be limited from here.
Gold prices so far have been erratic in 2023. The price of gold started the year on a bullish note, recording a 13% surge in prices by May 4.
According to the analyst, however, momentum has since flagged, and the precious metal now seems to be in a phase of consolidation.
This change in trend aligns with Boele's observation that investors may be hesitant to buy at current levels, especially with the specter of a significant drop looming over the market; hinting at the risk-averse nature of gold investors, who tend to prioritise long-term stability over short-term gains.
Boele's shift in her Federal Reserve outlook significantly informs her predictions.
Originally, she did not expect an aggressive rate-cutting spree in the short term but believed that the easing cycle would commence towards the end of 2023. However, recent developments have led her to revise these expectations.
"Last week, we changed our Fed view and also our US dollar view" says Boele.
"We now expect a recession to start in Q4 and rate cuts to come in Q1 2024. We expect the last rate hike of 25bp at the Fed’s July meeting and no rate cuts this year. We still forecast aggressive rate cuts in 2024. We now have a total of 175 basis point of rate cuts in 2024," she adds.
This forecast indicates her belief that the Federal Reserve will take assertive measures to stimulate the economy and combat the recessionary pressures she expects to emerge.
In line with her altered expectations for the Federal Reserve, Boele's perspective on the US dollar has also evolved.
With fewer rate cuts expected for the remainder of 2023 and into 2024, she has upgraded her view on the US dollar, seeing this as a positive turn.
This shift indicates her belief in the resilience of the US Dollar and its likely performance in the face of adverse economic conditions.
"As a result of the change in our Fed view we have upgraded our view on the US dollar," says the analyst.
"We no longer have a rate cut for the Fed this year and fewer total rate cuts in 2023-2024. This is a positive for the US dollar. Our view is roughly in line with the market."
Boele's points out that rate expectations, both real and nominal, alongside the outlook for the US dollar, are crucial drivers for gold prices.
Consequently, her adjusted outlook for the Federal Reserve and the US dollar has led her to downgrade her gold price forecast for 2024.
"So we have also downgraded our gold price forecast for 2024 to 2,000 USD per ounce (from 2,200 before) We now have for 2023 and 2024 a year-end forecast of 2,000," says the economist.
Despite the Federal Reserve's potential easing typically being seen as a boon for gold prices, Boele sees limited upward potential for gold in relation to the US dollar. Investors, she notes, currently hold net-long gold positions, and there is a risk that part of these will be liquidated.
"What is the reasoning behind this?" she asks.
"The start of monetary policy easing by Fed is generally positive for gold prices. But as the market has already anticipated this, it is already reflected in the gold price. Therefore we think that upside in gold prices versus the US dollar is rather limited from current levels, " she adds.
Boele offers a word of caution for investors. Given the currently high levels of gold prices and potential risks, she suggests that being long may not be the most attractive stance from a risk-reward perspective.

TIN-Algorithm's GSITrade with ease with the help of the most powerful XAU/USD tool!
TIN-Algorithm's GSI (Global Strength Index)
Available only in this channel. A tool that allows viewers to spot trend reversal, price corrections, order blocks, which will enable traders to hold longs and hedged when need be.
TIN-Algorithm's GSI is a very complex tool, and not one that can be easily understood but with the help of the Creators, the data will be directly translated here in Trading View for better understanding.
Have fun trading!

XAUUSD 20/06/2023Details on chart - looking to play safer Gold buys and sells at KL's marked on the chart

BUY TRADE SETUP ON XAUUSDHey Trader,
Check this analysis out on XAUUSD.
The pair is in a bullish / ascending channel, and seeing the Yellow metal breakout of the bearish trendline, making a good retests back to the previous demand due to NFP release. It is expedient that Gold make a new run towards $2,022.
With expectation of seeing more downside movement on DXY it could help bounce Gold towards the $2,050
Keep a close tab on Gold.


XAUUSD (GOLD)XAUUSD
if can't break the demand zone 1941-1937
we can
BUY at 1945
TP1 1955
TP2 1964
TP3 1973
SL 1937
.............
XAUUSD
if can't Break supply zone 1976-1983
we can
SELL at 1974
TP1 1965
TP2 1955
TP3 1945
SL 1980
.............
XAUUSD
if can break supply zone 1976-1983
we can
BUY at 1985
TP1 1992
TP2 2001
TP3 OPEN
SL 1978

XAUUSD 06/06/2023Details on chart - with no data releases, looking to play price action purely around KL's based on how price reacts

XAUUSD Potential Forecast | 5th June 2023 Fundamental Backdrop
ISM Services PMI forecast at 52.6 with 51.9 previous.
Technical Confluences
Resistance level at 1983
Support level at 1946
Price is currently hovering around the support level and we could potentially see rejection off this level
Idea
Monday asian session, hence will wait for price to stabilise before entering onto any trade.
NOT FINANCIAL ADVICE DISCLAIMER
The trading related ideas posted by OlympusLabs are for educational and informational purposes only and should not be considered as financial advice. Trading in financial markets involves a high degree of risk, and individuals should carefully consider their investment objectives, financial situation, and risk tolerance before making any trading decisions based on our ideas.
We are not a licensed financial advisor or professional, and the information we are providing is based on our personal experience and research. We make no guarantees or promises regarding the accuracy, completeness, or reliability of the information provided, and users should do their own research and analysis before making any trades.
Users should be aware that trading involves significant risk, and there is no guarantee of profit. Any trading strategy may result in losses, and individuals should be prepared to accept those risks.
OlympusLabs and its affiliates are not responsible for any losses or damages that may result from the use of our trading related ideas or the information provided on our platform. Users should seek the advice of a licensed financial advisor or professional if they have any doubts or concerns about their investment strategies.

XAUUSD Sell BiasAfter watching gold close during Asian session I began to build a sell bias on Gold due to price movement and structure on higher timeframe and I had my Sell Limit in position to fill me into a Sell when Price pulled back into my point of interest. NFP helped push the price further to the bottom


BUY TRADE SETUP ON XAUUSDHey Traders,
Check this late XAUUSD trade out.
Looking pretty promising at the lower band of the ascending channel. making a divergence along the way.
Wait for the break and retest of the trendline and then anticipate for a nice entry.
Watch out.

XAUUSD 31/05/2023Details on chart - looking to continue playing the sells on Gold after DXY breaking above 104 and sustaining

XAUUSD Weekly Forecast | 29th May 2023Fundamental Backdrop
The key takeaways of last week's FOMC meeting show that the FEDs agreed on the need for more rate hikes after May's meeting was 'less certain'. We will likely be seeing strength in the USD.
We could see investors shift their money from GOLD to USD instead, weakening it.
Technical Confluences
Near-term resistance level at 1948
Next support at 1904
Idea
Price could head towards the next major key support level at 1904.
NOT FINANCIAL ADVICE DISCLAIMER
The trading related ideas posted by OlympusLabs are for educational and informational purposes only and should not be considered as financial advice. Trading in financial markets involves a high degree of risk, and individuals should carefully consider their investment objectives, financial situation, and risk tolerance before making any trading decisions based on our ideas.
We are not a licensed financial advisor or professional, and the information we are providing is based on our personal experience and research. We make no guarantees or promises regarding the accuracy, completeness, or reliability of the information provided, and users should do their own research and analysis before making any trades.
Users should be aware that trading involves significant risk, and there is no guarantee of profit. Any trading strategy may result in losses, and individuals should be prepared to accept those risks.
OlympusLabs and its affiliates are not responsible for any losses or damages that may result from the use of our trading related ideas or the information provided on our platform. Users should seek the advice of a licensed financial advisor or professional if they have any doubts or concerns about their investment strategies.

GOLD buy after breaking flagWe have beautiful flag here and retest of of Weekly support 1905
If we break this... MY target zone will be between 1950-1960

XAU USDPrice has approached strong support, so now I'm looking for buys. This is the scenario that I'm waiting for. Lets see how market will react.

SELL TRADE SETUP ON XAUUSDHey Traders,
Watchout for this sell opportunity on XAUUSD
The retest of the 61.8 fib level could initiate a very good bearish continuation of the trend.
Watch out.

XAUUSD 25/05/2023Details on chart - looking to see how the data releases before jumping on a buy or sell, but overall, more bearish

Xauusd Falling Wedge Has Already Broken Also Formed Double Bottom Now Incase Of Neckline Breakout Expecting Move Towards 1995 to 2000

XAUUSD 23/05/2023Details on chart - looking to see continued HTF sells in line with better than expected data
