XAUUSD Potential Forecast | Thursday 8th December 2022Hi everyone, today I will be talking about a possible XAUUSD long trade using Smart Money Concepts.
Trade idea
1. Price is forming higher highs and higher lows
2. Price tapped onto the fair value gap (FVG) and rebounded
3. Bullish structure is confirmed as price has broken structure (BOS)
4. Currently, I will be waiting for price to retrace before finding long setups and trades in the demand zone below
Things to take note of:
- FOMC meeting is round the corner and that will potentially impact the price and cause alot of volatility in the market
- It is the final month of the year, people are taking it slow and we should proper manage our risk as well
- Risk management is the most important and no matter what, always remember to partial and BE at levels
All together, I will be looking for LONGS on XAUUSD
Trade safe guys,
Chern Yu
Xau-usd

XAUUSD Potential for Bullish Continuation | 9th December 2022Looking at the H4 chart, my overall bias for XAUUSD is bullish due to the current price being above the Ichimoku cloud, indicating a bullish market. Looking for a pullback buy entry at 1786.545, where the 50% Fibonacci line is. Stop loss will be at 1768.825, where the 50% Fibonacci line and previous swing low are. Take profit will be at 1810.010, where the previous swing high is.
Any opinions, news, research, analyses, prices, other information, or links to third-party sites contained on this website are provided on an "as-is" basis, as general market commentary, and do not constitute investment advice. The market commentary has not been prepared in accordance with legal requirements designed to promote the independence of investment research, and it is therefore not subject to any prohibition on dealing ahead of dissemination. Although this commentary is not produced by an independent source, FXCM takes all sufficient steps to eliminate or prevent any conflicts of interest arising out of the production and dissemination of this communication. The employees of FXCM commit to acting in the clients' best interests and represent their views without misleading, deceiving, or otherwise impairing the clients' ability to make informed investment decisions. For more information about the FXCM's internal organizational and administrative arrangements for the prevention of conflicts, please refer to the Firms' Managing Conflicts Policy. Please ensure that you read and understand our Full Disclaimer and Liability provision concerning the foregoing Information, which can be accessed on the website.

XAUUSD 07/12/2022Details on chart - looking for more sells ahead of closing up for the week and year

XAUUSD H1 - Long SignalXAUUSD H1 - Alerts set for $1780 price, we have seen some really nice play from gold since the start of the week. Solid bounce from $1770 for 100 pips, retest of $1770 for another 170 pip bounce, then a retest of $1780 before testing $1790. Looking for $1780 yet again before taking longs.
Hopefully this pair continues to unfold as expected.

XAUUSD Potential For Bullish ContinuationLooking at the H4 chart, my overall bias for XAUUSD is bullish due to the current price being above the Ichimoku cloud, indicating a bullish market. Looking for a possible buy stop entry at 1790.59, where the 23.6% Fibonacci line is for the bullish momentum to bring price to the take profit 1810.03, where the previous swing high is. Stop loss will be placed at 1776.35, where the 23.6% Fibonacci line is.
Please be advised that the information presented on TradingView is provided to Vantage (‘Vantage Global Limited’, ‘we’) by a third-party provider (‘Everest Fortune Group’). Please be reminded that you are solely responsible for the trading decisions on your account. There is a very high degree of risk involved in trading. Any information and/or content is intended entirely for research, educational and informational purposes only and does not constitute investment or consultation advice or investment strategy. The information is not tailored to the investment needs of any specific person and therefore does not involve a consideration of any of the investment objectives, financial situation or needs of any viewer that may receive it. Kindly also note that past performance is not a reliable indicator of future results. Actual results may differ materially from those anticipated in forward-looking or past performance statements. We assume no liability as to the accuracy or completeness of any of the information and/or content provided herein and the Company cannot be held responsible for any omission, mistake nor for any loss or damage including without limitation to any loss of profit which may arise from reliance on any information supplied by Everest Fortune Group.

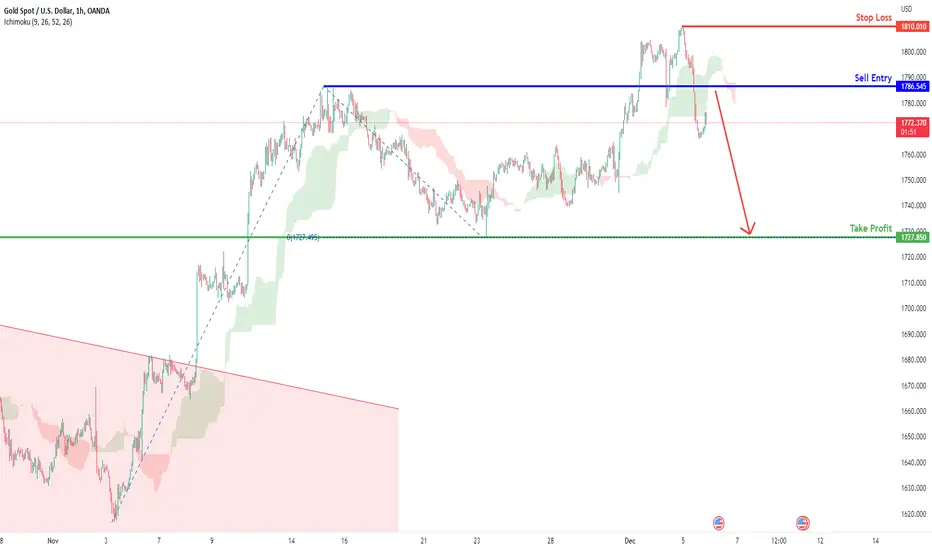
XAUUSD Potential for Bearish Drop | 8th December 2022Looking at the H4 chart, I have a bearish bias for XAUUSD because the current price is below the Ichimoku cloud, indicating a bearish market. Price has entered my pullback sell entry at 1786.545, which is the previous high and the 23.6% Fibonacci line. The stop loss will be set at 1810.010, the most recent swing high. The take profit level will be 1727.850, which is the previous swing low and the 0% Fibonacci projection line.
Any opinions, news, research, analyses, prices, other information, or links to third-party sites contained on this website are provided on an "as-is" basis, as general market commentary, and do not constitute investment advice. The market commentary has not been prepared in accordance with legal requirements designed to promote the independence of investment research, and it is therefore not subject to any prohibition on dealing ahead of dissemination. Although this commentary is not produced by an independent source, FXCM takes all sufficient steps to eliminate or prevent any conflicts of interest arising out of the production and dissemination of this communication. The employees of FXCM commit to acting in the clients' best interests and represent their views without misleading, deceiving, or otherwise impairing the clients' ability to make informed investment decisions. For more information about the FXCM's internal organizational and administrative arrangements for the prevention of conflicts, please refer to the Firms' Managing Conflicts Policy. Please ensure that you read and understand our Full Disclaimer and Liability provision concerning the foregoing Information, which can be accessed on the website.

XAUUSD Potential for Bearish Drop | 7th December 2022Looking at the H4 chart, my overall bias for XAUUSD is bearish due to the current price being below the Ichimoku cloud , indicating a bearish market. Looking for a pullback sell entry at 1786.545, where the previous high and 23.6% Fibonacci line is. Stop loss will be place at 1810.010, where the most recent swing high is. Take profit will be at 1727.850, where the previous swing low and 0% Fibonacci projection line is.
Any opinions, news, research, analyses, prices, other information, or links to third-party sites contained on this website are provided on an "as-is" basis, as general market commentary, and do not constitute investment advice. The market commentary has not been prepared in accordance with legal requirements designed to promote the independence of investment research, and it is therefore not subject to any prohibition on dealing ahead of dissemination. Although this commentary is not produced by an independent source, FXCM takes all sufficient steps to eliminate or prevent any conflicts of interest arising out of the production and dissemination of this communication. The employees of FXCM commit to acting in the clients' best interests and represent their views without misleading, deceiving, or otherwise impairing the clients' ability to make informed investment decisions. For more information about the FXCM's internal organizational and administrative arrangements for the prevention of conflicts, please refer to the Firms' Managing Conflicts Policy. Please ensure that you read and understand our Full Disclaimer and Liability provision concerning the foregoing Information, which can be accessed on the website.

GOLD:BUY From 50% FIBO Support Oversold Area LONG Setup GOLD, contrary to EUR/USD yesterday the USD news had a strong impact on this metal with a strong sell impulse where today the price reach the 50% FIBO Area from the last swing. A confluence with a Support area around 1760.00 plus the clue of the Oversold Stochastic may be given a setup for a new Bullish impulse. Our Forecast is about a new Long setup buying in discount area.


XAUUSD Potential For Bearish DropLooking at the H4 chart, my overall bias for XAUUSD is bullish due to the current price being above the Ichimoku cloud, indicating a bullish market. However, I am looking to play the pullback sell. Looking for a sell entry at 1786.53, where the 23.6% Fibonacci line is. Stop loss will be at 1810.03, where the previous swing high is. Take profit will be at 1745.09, where the 78.6% Fibonacci line is.
Please be advised that the information presented on TradingView is provided to Vantage (‘Vantage Global Limited’, ‘we’) by a third-party provider (‘Everest Fortune Group’). Please be reminded that you are solely responsible for the trading decisions on your account. There is a very high degree of risk involved in trading. Any information and/or content is intended entirely for research, educational and informational purposes only and does not constitute investment or consultation advice or investment strategy. The information is not tailored to the investment needs of any specific person and therefore does not involve a consideration of any of the investment objectives, financial situation or needs of any viewer that may receive it. Kindly also note that past performance is not a reliable indicator of future results. Actual results may differ materially from those anticipated in forward-looking or past performance statements. We assume no liability as to the accuracy or completeness of any of the information and/or content provided herein and the Company cannot be held responsible for any omission, mistake nor for any loss or damage including without limitation to any loss of profit which may arise from reliance on any information supplied by Everest Fortune Group.

Gold Daily Analysis 06.12.22Gold tested support near 1767. Today gold may move sideways between 1767 and 1778.
BUY 1768 SL 1762 TP 1778

XAUUSD Potential for Bearish Drop | 6th December 2022Looking at the H4 chart, my overall bias for XAUUSD is bearish due to the current price being below the Ichimoku cloud, indicating a bearish market. Looking for a pullback sell entry at 1786.545, where the previous high is. Stop loss will be place at 1810.010, where the most recent swing high is. Take profit will be at 1727.850, where the previous swing low and 0% Fibonacci projection line is.
Any opinions, news, research, analyses, prices, other information, or links to third-party sites contained on this website are provided on an "as-is" basis, as general market commentary, and do not constitute investment advice. The market commentary has not been prepared in accordance with legal requirements designed to promote the independence of investment research, and it is therefore not subject to any prohibition on dealing ahead of dissemination. Although this commentary is not produced by an independent source, FXCM takes all sufficient steps to eliminate or prevent any conflicts of interest arising out of the production and dissemination of this communication. The employees of FXCM commit to acting in the clients' best interests and represent their views without misleading, deceiving, or otherwise impairing the clients' ability to make informed investment decisions. For more information about the FXCM's internal organizational and administrative arrangements for the prevention of conflicts, please refer to the Firms' Managing Conflicts Policy. Please ensure that you read and understand our Full Disclaimer and Liability provision concerning the foregoing Information, which can be accessed on the website.
EUR/USD:BUY From Pullback 1794.00 For A new LONG Setup Gold it's inside a Bullish channel and today the price may have a pullback on the level of 1794.000 in confluence with the 50% Fibonacci level for a new Bullish impulse. The pair follow the positive correlation with the EUR and if the ISM Services PMI will be against the USD we will see a new positive impulse also for the GOLD

XAUUSD 05/12/2022Details on chart - looking for more sells ahead of reaching a strong HTF zone however, buys are not off the table yet with upcoming FOMC and more data reports which will no doubt be a strong catalyst for price

XAUUSD Potential for Bullish Continuation | 5th December 2022Looking at the H4 chart, my overall bias for XAUUSD is bullish due to the current price being above the Ichimoku cloud , indicating a bullish market. With price tapping into my buy entry at 1786.545, where the previous high is. Stop loss will be at 1739.675, where the previous swing low and 61.8% Fibonacci line is. Take profit will be at 1832.405, where the 61.8% Fibonacci projection line is.
Any opinions, news, research, analyses, prices, other information, or links to third-party sites contained on this website are provided on an "as-is" basis, as general market commentary, and do not constitute investment advice. The market commentary has not been prepared in accordance with legal requirements designed to promote the independence of investment research, and it is therefore not subject to any prohibition on dealing ahead of dissemination. Although this commentary is not produced by an independent source, FXCM takes all sufficient steps to eliminate or prevent any conflicts of interest arising out of the production and dissemination of this communication. The employees of FXCM commit to acting in the clients' best interests and represent their views without misleading, deceiving, or otherwise impairing the clients' ability to make informed investment decisions. For more information about the FXCM's internal organizational and administrative arrangements for the prevention of conflicts, please refer to the Firms' Managing Conflicts Policy. Please ensure that you read and understand our Full Disclaimer and Liability provision concerning the foregoing Information, which can be accessed on the website.

XAUUSD 4hour Analysis December 4th, 2022Gold Neutral idea
Weekly Trend: Bullish
Daily Trend: Bullish
4Hour Trend: Bullish
Trade scenario 1: We are very clearly bullish on gold but we are currently resting at 1800.00 resistance waiting on some reactions to better understand where gold will go next.
We know we want to ride the overall bullish trend so ideally, we are looking for a retest of 1735.00 with strong bullish rejection. Look to enter long if this happens and re-target 1800.00
Trade scenario 2: While we are waiting for a bullish scenario, a retrace will have to occur first. Due to the heightened volume as of recent, we could see a massive retracement to 1735.00.
If we can spot clear 1 hour & 30minute bearish structure near 1800.00 we will potentially have a nice counter trend short opportunity down to 1735 support.

GOLDmoved as we predicted
descending channel breakout already done
double bottom breakout and alnd retest has already done
expecting massive bulish moves in coming days

GOLD:BUY From Accumulation Pattern Waiting For US News LONG Same vision today for the GOLD that, like the EUR/USD still in a solid bullish rally. Yesterday the price reached our target and today the value of the Gold, as for the EUR/USD it's inside an accumulation pattern waiting for the US release of economic news. If you are reading my post about USD/JPY where I explain my Daily Market Analysis you will know that the uncertain condition of the US economy today can impact the markets correlated with USD in a negative view. That's our point of view in general. We are looking for a new Bullish impulse here.

XAUUSD 02/12/2022Details on chart - waiting for NFP and unemployment today to provide volume and direction for price

XAUUSD Potential for Bullish Continuation | 2nd December 2022Looking at the H4 chart, my overall bias for XAUUSD is bullish due to the current price being above the Ichimoku cloud , indicating a bullish market. Looking for a buy entry at 1786.545, where the previous high is. Stop loss will be at 1739.675, where the previous swing low and 61.8% Fibonacci line is. Take profit will be at 1869.750, where the previous swing high and 127.2% Fibonacci extension line is.
Any opinions, news, research, analyses, prices, other information, or links to third-party sites contained on this website are provided on an "as-is" basis, as general market commentary, and do not constitute investment advice. The market commentary has not been prepared in accordance with legal requirements designed to promote the independence of investment research, and it is therefore not subject to any prohibition on dealing ahead of dissemination. Although this commentary is not produced by an independent source, FXCM takes all sufficient steps to eliminate or prevent any conflicts of interest arising out of the production and dissemination of this communication. The employees of FXCM commit to acting in the clients' best interests and represent their views without misleading, deceiving, or otherwise impairing the clients' ability to make informed investment decisions. For more information about the FXCM's internal organizational and administrative arrangements for the prevention of conflicts, please refer to the Firms' Managing Conflicts Policy. Please ensure that you read and understand our Full Disclaimer and Liability provision concerning the foregoing Information, which can be accessed on the website.

Gold continues to gain as the DXY dropsAs the DXY continued to weaken, Gold saw the most benefit as the price climbed steadily to the upside, reaching a high of 1800 which was previously tested in August.
Further upside can be anticipated with the price expected to break above the round number resistance of 1800.
Be aware of higher volatility with the rice expected to continue climbing toward the 1875 key resistance level as the DXY continues to weaken.


gold daily analysis 01-12-2022Gold made a breakout from the the zone above 1767
Today gold will test the resistance at 1787
Gold may become bearish after this test
SELL 1787 SL 1790 TP 1770
