XAUUSD 1HR ACCUMULATIONPotential 1HR Accumulation for XAU/USD currently. I've inserted two positions, one has a risk reward of 1 : 3.16 and the other is 1 : 5.09 and targets the weekly high. We are also within a symmetrical triangle and have h=had our spring / manipulation from a previous demand zone.
Xausud

XAUUSD ANALYSISMy view for gold . Gold have already entered a very hot area which is the areaa of 1760-1770. If price breaks above 1774 , potential that price might go up to 1800+ . But if price is to be rejected below 1774 , we could see that price will hit rock bottom

GOLD up to 1950? (medium term analysis)Diary - Analysis
Gold at 4h time frame is forming an W pattern and an inverted HS diary.
Now I think we will go to a final target 1950.
Monetary and Fiscal Stimulus
Monetary stimulus (from the Fed) is not expected to let up this year. As one example, Chicago Fed President Charles Evans said, “Economic agents should be prepared for… an expansion of our balance sheet…”
And fiscal stimulus (from congress and the president) is likely to explode in 2021. The interesting thing about this type of stimulus is that it bypasses the banks and puts funds directly into the hands of people who will have a propensity to spend it.
President-elect Joe Biden has explicitly stated that his “first priority” when he takes office is a stimulus package. And with the return of Janet Yellen—now as Treasury Secretary—further stimulus will be supported. During her tenure as Fed Chair and in recent communications, the message is very clear: more fiscal stimulus is coming.
Fiscal stimulus amounts are not finalized as we write, but based on what has been said publicly so far, we should expect something in the range of at least $3 trillion in fiscal spending in 2021.
Monetary and fiscal stimulus is arguably one of the strongest catalysts for gold, not to mention the ramifications that can come from it. Of course if they don’t enact stimulus, or much less than expected, it would be a drag on the gold price. But that isn’t likely to happen, at least this year.
If stimulus efforts play out as expected, the gold price will increase…
Gold price will increase
Low Interest Rates
The Fed has signaled ultra-easy monetary conditions for at least the next year. Chicago Fed President Charles Evans said, “The Fed’s policy stance will have to be accommodative for quite a while… economic agents should be prepared for a period of very low interest rates.”
The “real” rate (10-year Treasury minus the CPI) is already negative in the US. And many analysts expect the spread between the nominal interest rate and inflation to widen if the economy begins to recover. In other words, even if nominal yields stay flat, the real yield would continue to fall if inflation picks up.
The relationship between gold and real yields is one of the most consistent predictors of the gold price.
Inflation-adjusted yields are likely to remain negative. If so, the gold price will increase…
gold price will increase
U.S. Dollar: Because gold is universally priced in U.S. dollars, they are usually inversely correlated. As such, a weak U.S. dollar is supportive of higher gold prices. Ongoing stimulus efforts will keep the USD under pressure—and given the amount of fiscal expenditures expected this year, the dollar is likely to fall, which will push the gold price up...
gold price will increase
If the virus is contained and the Fed and congress scale back on their stimulus efforts, the dollar would rise and gold would probably decrease...
gold price will decrease
Inflation Threat: Since the Fed has expressly stated it is comfortable with inflation rates exceeding 2%, a higher CPI is a distinct possibility. Consider what else is transpiring that could lead to higher inflation rates this year…
Debts and deficits have reached record territory, which historical studies have shown lead to higher rates of inflation. The federal debt ended 2020 at 135.6% of GDP, a level unmatched in modern history. And the federal deficit is now $3.2 trillion, more than twice the level of the Great Recession and a level not seen in U.S. history.
Meanwhile, the last reading of the Purchasing Managers Index (PMI) in 2020 showed that while new orders dropped, input prices rose. In the case of the services PMI, input prices jumped to the highest on record for the second straight month, while input prices in the manufacturing survey hit the highest level since mid-2018.
Commodity prices have also jumped. Many are up double-digits from a year ago, with lumber prices up triple digits.
Meanwhile, St. Louis Fed President James Bullard said his bank has gotten reports of supply constraints of various kinds that are “intense” and led to a big increase in prices. “The quiescence of inflation that has characterized the last decade may not be a good guide for what’s going to happen in 2021, where I would expect possibly higher inflation than we’re used to.”
And Kansas City Federal Reserve President Esther George, one of the “hawks” at the central bank, said she is “worried inflation is brewing and could surprise to the upside.”
If rising consumer prices visit us in 2021, investors are bound to look for inflation hedges, gold being an obvious choice and one that will push the price up...
gold price will increase

XAUUSD Trading Idea BIG SHOTDisclaimer :
This is just a personal analysis as an analysis note, and it means a lot to me.
Please do not act as a signal to enter a trade because the analysis I post can be wrong.
If you follow this analysis please complete it with great detail And always with care.
Beaware of fear and greedy instead bewise
>>ALI<<

Triangle at GOLDOne of the most popular pattern is the triangle. It is also among the figures with the best performance.
The idea behind it is very simple - The price makes lower peaks and higher bottoms, thus closing in a triangle. At one point it must break and this will trigger movement in the direction of the break. In most cases, the break is in the direction of the previous trend.
If we see a break here, we can expect a quick reach to 1754.
In case of a break down we can look for 1701.
To receive confirmation of the break, wait for closing below / above the previous level.
LIKE AND COMMENT - this is how you help us!

XAUUSD long position on support all the way to resistance XAUUSD long position on support all the way to resistance for short term

GOLD UPCOMING FORECAST!!!As stated in last weeks forecast. Gold has been making lower lows and lower highs. Will this keep trending down? The probability of the monthly and Daily imb above @
$1770 - $1815 getting filled is highly likely. I will look for short term continuation long trades to this area. This was a petty corrective week on the HT's. I will wait to see how PA react to those specific areas highlighted before entering a trade short. If I see a nice continuation pattern around the Asian ranges for long I will enter that too the $1780 above. There is some IMB around the $1900 level which could be a nice long term trade.

++ its possible gold could go early but I am in no rush ++Corrective ascending channel followed by a possible double top at 1740?
possible entry but I will wait for the first bear flag then enter if this happens. xau/usd is still technicaly in no man's land.

GBP/AUD : PRICE ACTION IN DAILY TMF , PRICE IS GROWING ! 🔔🔔🔔Welcome back Traders, Investors, and Community!
If you LIKE this analysis, Please support our page by hitting the LIKE 👍 button
Feel free to request any pair/instrument analysis or ask any questions in the comment section below.
Strategy : BULLISH CHANNEL + FIBO RETRACEMENT
Good trading at everyone!

XAUUSD LONG TERM BUYGold might just come back to retest that support zone again forming a double bottom before shooting all the way up and possibly breaking out of the channel as a continuation pattern (bullish flag).

XAUUSD SHORT POTENTIAL forecast !!!!XAUUSD Short forecast!!
This pair still has great potential to the downside. Long term this will hit the 20.00 at least. I will be looking for my key areas to get hit and then executing my trades on the lower time frames. If a short term potential long becomes available and it fits all my rules, I will take a trade short term to hit my key POI area. I missed 2 entries last week short as I was watching other pairs. I would expect a pullback Monday, Tuesday and then a nice push later in the week. Trade safe, trade smart and lets make some money!! Hit that like button and give us Follow for more upcoming trade forecasts.

XAU/USD Weekly Chart Long Term Cup and Handle PredictionWhen we look at the weekly chart we see a pattern forming, Cup and Handle, if this cup and handle works, we can see Gold around 2600-3200 zone, this is a nice income in 1-2 years. This is not a financial advice, but I have reasonable amount of gold in my portfolio for the next coming years.

Gold similarities between topsGold is usually seen as a safe haven when stocks are falling or when inflation is rising. Neither of those two things are happening right now.
Investors also are worried about a rise in U.S. layoffs as spiking coronavirus infections cause more businesses to shut down. Congress has yet to agree on more economic aid.
All that has increased uncertainty about the direction of the economy. And uncertainty is often seen as good for gold prices.
This was said back in 2011 in August right at the top, I do think this also applies to today's environment.
- Inflation Rate for January 2021 is 1.4
"Gold is considered a good hedge against inflation," he said, "But the increase in gold price has far outpaced inflation, especially during the last decade."
He noted that inflation has only picked up 2.4% on an annual basis during the last 10 years, but the price of the yellow metal has climbed more than 21% a year during the same time period.
Unless higher inflation -- to the tune of 10% a year -- is forthcoming, Thomas said gold prices are "clearly in a bubble."
Buffet's famous words:
The prices of stocks and U.S. houses have risen faster over time than gold. Buffett has called investors who buy gold when the price is rising, even during times of uncertainty, "foolish."
Conclusion:
Short term exuberance because of the expected economic aid package, this will lead to a spike which will form a double top.

GOLD BUY LONGGOLD Long.. Putting my SL at 1805 and I am aiming for 1870 area atleast. Could go even higher IMO

Gold-The completion of the first descending waveThere can be many scenarios for gold
One scenario is that the first downtrend has ended in the 240-minute chart and the corrective movement of the price can be in the range of $ 1892, and in continuation the downtrend can be expanded for the range of $ 1645.
On the daily chart, we are expecting the downtrend up to the range of $ 1645.
( Daily Chart )

GOLD XAUUSD Intraday 3rd February 2021There have 2 entries
You can choose 1 entry only can entry for both
After reach Take profit 50 pips closed all open entries
This setup valid for today only and must be close today wether you profit or loss

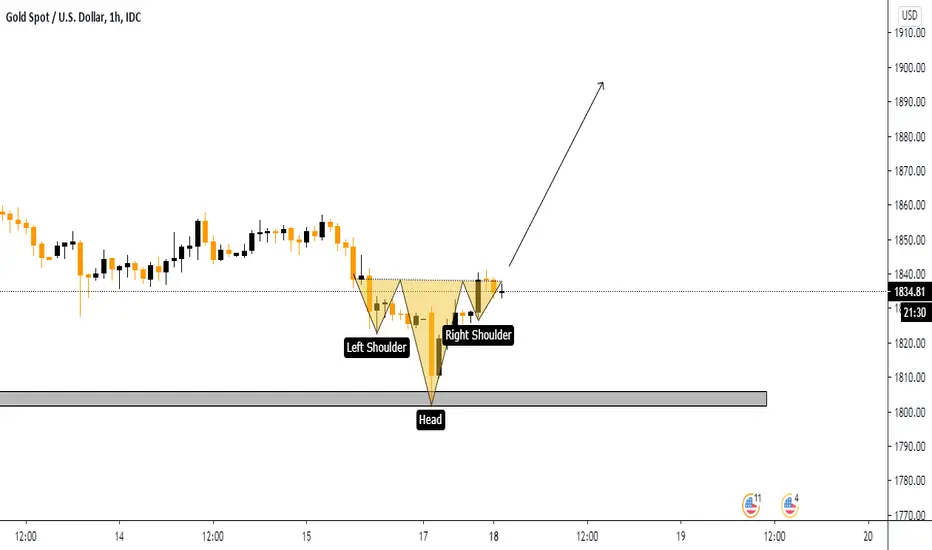
XAUUSD Head shoulder pattern !!hello trders
We found a bluish infrastructure on Gold chart.
head and shoulder pattern breakout of the neck line we may see a potential bull run till 1900.
Thank you