XAU(GOLD) - ATH SOON?The below image illustrated is M-Prof
This 4H SVP chart of Gold (XAU/USD) shows a clear uptrend structure supported by consistently shifting value areas, POCs, and VAHs toward higher prices. The price action has built strong acceptance near 3,320 and 3,370 zones, both showing overlapping value and consolidation before new legs higher. Notably, after a tight range between June 10–12, price broke out with aggressive initiative buying visible through vertical profiles and newly formed higher VAH/POC levels near 3,435. This suggests strong buyer conviction, and the current session holding above the previous VAH/POC indicates potential continuation unless price falls back into the old range. The move looks healthy, with demand pushing new value upward and little resistance unless exhaustion prints near 3,450+ which clearly states that the purple line cant be happening but if it happens it would be the best buys! Also the small move of green can aid them to new ATH!
Xauuasd

THE KOG REPORT - FOMCTHE KOG REPORT – FOMC
This is our view for FOMC, please do your own research and analysis to make an informed decision on the markets. It is not recommended you try to trade the event if you have less than 6 months trading experience and have a trusted risk strategy in place. The markets are extremely volatile, and these events can cause aggressive swings in price.
Ok team, a simple one for this FOMC as we're expecting a bit of a curveball which is going to make it difficult to hold trades. For that reason, we have plotted the extreme key levels on the charts, anything intra-day and immediate support and resistance has been removed as it’s simply irrelevant if we see aggressive volume.
We have the level below which is also the order region 2730-40, a spike there with rejection can give this the momentum it needs to break upside and attack that 2800 level which is ideally what we want to see if they’re going to attempt it. We’ll be waiting higher however for them to complete the move and confirm a reversal, only then will we want to attempt the short trade back down using the red boxes.
Below the order region is the key level 2710-03, a push down there with a confirmed rejection and reversal, we’ll decide on whether to long or not back up using the red boxes level to level. We’ve done well on the KOG Report, we’ve shorted, we’ve longed and we’ve closed nicely on the bias level targets this week. We’re suggesting our traders take it easy, instil some patience and discipline, wait for them to take the price to where they want, then hunt the trade.
RED BOXES:
Break above 2762 for 2775, 2782, 2790 and 2810 in extension of the move
Break below 2740 for 2730, 2720, 2710 and 2698 in extension of the move
Please do support us by hitting the like button, leaving a comment, and giving us a follow. We’ve been doing this for a long time now providing traders with in-depth free analysis on Gold, so your likes and comments are very much appreciated.
As always, trade safe.
KOG

Gold continues to decline according to the technical chart.Gold prices continue to decline according to the technical chart. World gold prices dropped sharply last Wednesday after Mr. Trump won the election to the White House.
The USD skyrocketed after this event, and the gold market experienced sell-offs. Bond yields rose as investors worried that the tariffs and tax cuts that Mr. Trump promised before his election could cause inflation to rise again.
Morrison said, USD and interest rates increased. Gold prices fell sharply and found a bottom, then increased slightly in the last session of the week, gold was under strong selling pressure. Gold prices hold support from 2,635 to 2,675 USD/ounce. This is the resistance level of gold prices in the last week of September and early October.
This week, the market is interested in some economic information such as US core CPI - data for the Fed to monitor inflation, weekly unemployment benefit data, US retail sales,... Owner Fed Chairman Jerome Powell will also speak on Thursday.
According to Adam Button, Director of Currency Strategy at Forexlive, the market is watching who will be America's next finance minister. He expects the price of gold to increase again if John Paulson is chosen, because he is a gold price speculator.

xausd - 15 minThe gold price seems to relieve some stress - then continue the tempo..... ):
I would be happy if you share your thoughts with me.

XAUUSD (GOLD) EVERYDAY TRADE SETUPHello traders ,
This my idea for Short. XAUUSD (GOLD) The Zone 5MIN choch. then i will go to short.
this is my ideas only. what you are flow your trading statistics you can continue.
If you Like my ideas follow me...

GOLD EVERYDAY TRADE SETUP >>XAUUSD<<Hello traders ,
Xauusd (GOLD) Sell Confirm trad running...
If you need more my ideas follow me.

Yesterdays positionsWe lost 50 pips after 7 days profit in row and try to save this weeks profit dont worry we still in profit 🙏

BTCUSDT, Possible scenarios (Details on caption)Hello traders.
As you can see, the price shifted the market structure to bearish by breaking the low at 44300.
The price grabbed the liquidity above 43578 and had a bearish reaction, now the price is in the supply zone that may push the price down. The target of this scenario can be the FVG created on 40280_ 40915.
on the other hand, there are two supply zones above the current price. So we can expect the price rise to fill the FVG, in this case, we can define the first target at 44300 and then the supply zone that formed at the 0.705 level of Fibonacci.
💡Wait for the update!
🗓️03/02/2024
🔎 DYOR
💌It is my honor to share your comments with me💌

Hellena | GOLD (1H): Short to support area 2024.854. Dear Colleagues, the price is still flat. I assume that the price will continue to decline, because the price is in a large wave 1 of the higher order. The nearest target is the support area at 2024.854.
Manage your capital correctly and competently! Only enter trades based on reliable patterns!

The uptrend remains the main trend for the XAUUSD marketIG Company market analyst Yep Jun Long said gold prices were "neutral" in today's trading ahead of the PCE data release on the same day.
He said strong third-quarter U.S. gross domestic product data dispels market speculation about a possible Fed rate cut, as investors are still following commentary cues. It is said that it is not possible. Recent comments from Fed officials. This week, Fed officials talked about the possibility of rate cuts in the coming months, predicting slower growth and further cooling of inflation. The comments sent the yield on the 10-year U.S. Treasury note down to 4.2470%, its lowest level in 2 1/2 months. In current trading, the U.S. dollar index, which measures the dollar's strength against a basket of major currencies, has fallen to its lowest level in nearly three months, ending November with its steepest decline in a year. This development made gold cheaper for buyers using other currencies.
BUY 2036-2038
TP 2045
SL 2032

GOLD ( XAUUSD ) Long Term Selling Trading IdeaHello Traders
In This Chart GOLD HOURLY Forex Forecast By FOREX PLANET
today Gold analysis 👆
🟢This Chart includes_ (GOLD market update)
🟢What is The Next Opportunity on GOLD Market
🟢how to Enter to the Valid Entry With Assurance Profit
This CHART is For Trader's that Want to Improve Their Technical Analysis Skills and Their Trading By Understanding How To Analyze The Market Using Multiple Timeframes and Understanding The Bigger Picture on the Charts

consolidation on XAUUSD. FOREXCOM:XAUUSD OANDA:XAUUSD
As you can see clearly, XAUUSD is on consolidation between 1950-1965.
I hope for the next week, price break this box no matter on which direction.
but totally, GOLD is bearish for me and there is lots of FVG on lower prices that needs to be filled.
my idea is on SHORTING GOLD again around 1960-1965. but if price break the last swing high, i will take some LONGS for at least 100 pips.
good luck traders. wish you all some big banks for next week

XAUUSD H4 : WOW SUCH GOOD BUY AREA Hi Guys Hope you well,
As we said before, gold is slowly approaching the perfect area for buying. There is a very good amount of liquidity in that area, which I think can push gold to the 2350 area. Right now I expect a very boring uptrend in gold to the supply zone around 2020.
SecondChanceCrypto
⏰17/May/23
⛔️(DYOR)
always do your research.
If you have any questions, you can write them in the comments below, and I will answer them.
And please don't forget to support this idea with your likes and comment.

xauusd shortbefor newsssssssssssssssssssssssssssssssssssssssssssssssssssssssssssssssssssssssssssssssssssssssssssssssssssssssssssssssssssssssssssssss


GoldViewFX - 4H CHART UPDATED LEVELS & TARGETSHey Everyone,
The 4H chart is looking very much Bullish with the with price breaking out of a resistance structure with an immediate gap target open to 1685. We can also see MEA5 has crossed all MAs for a Bullish continuation with the last MA, MA200 being crossed on market close and potentially lock on Market open.
Our plans are to trade this with taking buys from any dips for the bull targets and track the movement level to level up and down using EMA5 cross and lock to confirm the movement.
EMA5 CROSS AND LOCK ABOVE 1672 WILL OPEN FOLLOWING BULLISH TARGETS
BULLISH TARGETS
1685 -
1691 -
1700 -
EMA5 CROSS AND LOCK ABOVE 1700 WILL OPEN 1708, 1718
BULLISH TARGET
1708 -
1718 -
BEARISH TARGETS
1672 -
1661 -
EMA5 CROSS AND LOCK BELOW 1661 WILL OPEN THE FULL SWING RANGE
SWING RANGE
1636
As always, we will keep you all updated with regular updates throughout the week and how we manage the setups. Please don't forget to like, comment and follow to support us, we really appreciate it!
GoldViewFX
XAUUSD TOP AUTHOR

#XAUUSD sell planI am looking to sell on gold below 1695. possible retest and continuation to the downside. created major reversal from the high and broke below previous resistance turn support.

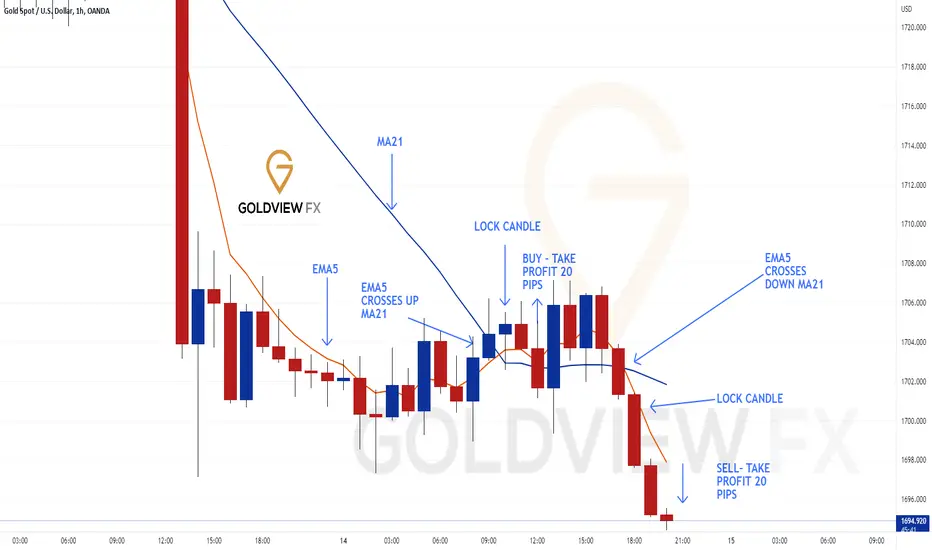
GoldViewFX - 20 PIP SIGNAL SETUP IN ACTION!!!
This is a simple 20 pip setup that can be used in ranging conditions allowing intraday setups both ways.
We look for EMA5 to crossover MA21 UP or DOWN followed with a 1H closing candle, which we call the locking candle. Once this is done, we then enter on the next candle and target 20pips.
The example on this chart shows the setup in action hitting targets up and down.
Please don't forget to like, comment and follow to support us, we really appreciate it!
GoldViewFX
XAUUSD TOP AUTHOR
Gold is on a little Buy mode after PMI data eventGold is looking on a zigzag buy sell pattern as per the suggestion by elliot wave chart pattern. All are suggest to trade with proper risk management and proper cut loss today.

XAUUSD Short Tram SELL signal....NOW
AronnoFX will not accept any liability for loss or damage as a result of
reliance on the information contained within this channel including
data, quotes, charts and buy/sell signals.
If you like this idea, do not forget to support with a like and follow.
Traders, if you like this idea or have your own opinion about it,
write in the comments. I will be glad.

GoldViewFX - WEEKLY CHART UPDATEHey Everyone,
Please see updated weekly chart with a overall longer range target.
You can clearly see, we are still in a Bullish structure with the Goldturn trendline providing the ascending support.
Bullish TARGET
1944
SWING RANGE
1960
Please don't forget to like, comment and follow to support us.
GoldViewFX
XAUUSD TOP AUTHOR

XAUUSD Short Tram SELL signal....NOWAronnoFX will not accept any liability for loss or damage as a result of
reliance on the information contained within this channel including
data, quotes, charts and buy/sell signals
If you like this idea, do not forget to support with a like and follow.
Traders, if you like this idea or have your own opinion about it,
write in the comments. I will be glad.

xauusdRegardless of the effects of the news, the probability of correction to the desired range before the price growth
