Go long on dips and short on rallies📰 News information:
1. Gold market liquidity at the end of the month
2. Impact of geopolitical situation
📈 Technical Analysis:
Last week we predicted that gold would rebound. Today, after gold rebounded as expected, we gave a short trading strategy. Gold fell precisely at the point we gave, 3295, and successfully hit our TP3280-3270. The result confirmed the correctness of our trading strategy. Next, we will focus on the long trading opportunities below 3270-3260.
🎯 Trading Points:
BUY 3270-3260
TP 3290-3300
SELL 3295-3300-3310
TP 3280-3270
In addition to investment, life also includes poetry, distant places, and Allen. Facing the market is actually facing yourself, correcting your shortcomings, confronting your mistakes, and strictly disciplining yourself. I hope my analysis can help you🌐.
TVC:GOLD FXOPEN:XAUUSD PEPPERSTONE:XAUUSD FX:XAUUSD FOREXCOM:XAUUSD OANDA:XAUUSD
Xauusd(w)

GOLD ROUTE MAP UPDATEHey Everyone,
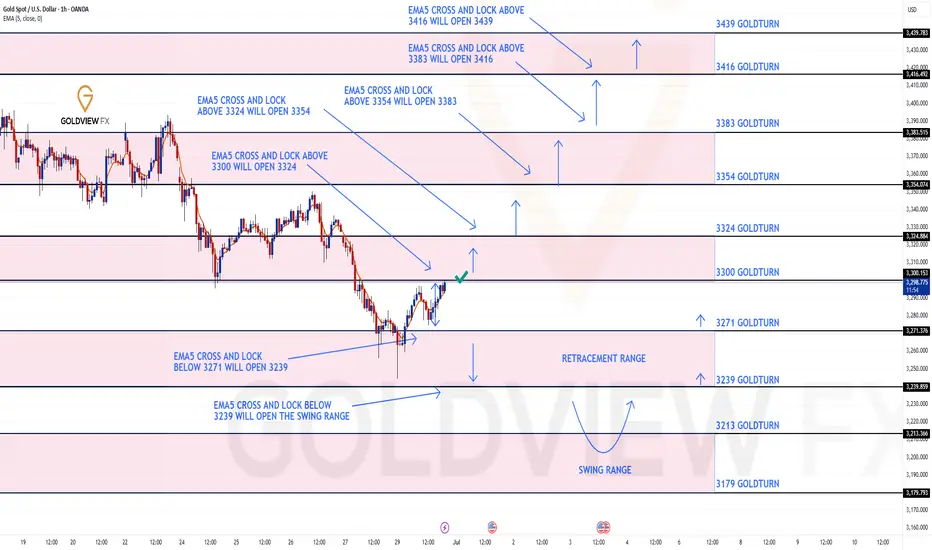
Great start to the week with our Bullish target at 3300 hit perfectly!!!!
We will now look for ema5 cross and lock to confirm a continuation or failure to lock will follow with a rejection into the lower Goldturns for support and bounce.
We will see levels tested side by side until one of the weighted levels break and lock to confirm direction for the next range.
We will keep the above in mind when taking buys from dips. Our updated levels and weighted levels will allow us to track the movement down and then catch bounces up.
We will continue to buy dips using our support levels taking 20 to 40 pips. As stated before each of our level structures give 20 to 40 pip bounces, which is enough for a nice entry and exit. If you back test the levels we shared every week for the past 24 months, you can see how effectively they were used to trade with or against short/mid term swings and trends.
The swing range give bigger bounces then our weighted levels that's the difference between weighted levels and swing ranges.
BULLISH TARGET
3300 - DONE
EMA5 CROSS AND LOCK ABOVE 3300 WILL OPEN THE FOLLOWING BULLISH TARGETS
3324
EMA5 CROSS AND LOCK ABOVE 3324 WILL OPEN THE FOLLOWING BULLISH TARGET
3354
EMA5 CROSS AND LOCK ABOVE 3354 WILL OPEN THE FOLLOWING BULLISH TARGET
3383
BEARISH TARGETS
3271
EMA5 CROSS AND LOCK BELOW 3354 WILL OPEN THE FOLLOWING BEARISH TARGET
3239
EMA5 CROSS AND LOCK BELOW 3239 WILL OPEN THE SWING RANGE
3213
3179
As always, we will keep you all updated with regular updates throughout the week and how we manage the active ideas and setups. Thank you all for your likes, comments and follows, we really appreciate it!
Mr Gold
GoldViewFX
Trading Strategies Amid Geopolitical and Policy GamesToday's gold price rebounded above $3,280 after opening with a dive to a low of $3,247, showing a volatile trend.
Influencing Factors
- Geopolitics: The ceasefire between Israel and Iran earlier caused gold prices to fall, but Trump's threat to bomb Iran again and maintain sanctions has revived market risk aversion, supporting gold prices with some bargain hunting.
- Monetary Policy: Expectations for Fed rate cuts have fluctuated. The CME FedWatch Tool shows an 81.9% probability of unchanged rates in July and a 76% probability of a cumulative 25-basis-point cut by September. U.S. economic data (e.g., personal consumption expenditure) and tariff policies are influencing gold's trajectory.
- Capital Flows: Global gold ETF demand turned negative in May, with outflows led by North American and Asian funds, putting downward pressure on gold prices.
Technical Analysis
Gold rebounded after a pullback last week, closing with two consecutive weekly gains. The $3,300-$3,310 range is a key resistance zone: a firm break above could signal a short-term trend reversal, while failure to do so may lead to a test of $3,200. On the daily chart, moving averages are bearish, MACD forms a death cross below the zero axis with expanding green bars (indicating dominant bearish momentum), but RSI at 39 near oversold levels suggests potential short-term rebound for correction.
Trading Strategy
Short gold on a rebound to the $3,305-$3,310 resistance zone, setting a stop-loss at $3,320. Initial targets are $3,280-$3,290, where profits can be gradually taken based on price action and market sentiment. If the decline continues, adjust targets downward to around $3,250, and flexibly adapt to real-time market conditions.
XAUUSD
sell@3300~3310
SL:3320
TP:3290~3280-3270
I am committed to sharing trading signals every day. Among them, real-time signals will be flexibly pushed according to market dynamics. All the signals sent out last week accurately matched the market trends, helping numerous traders achieve substantial profits. Regardless of your previous investment performance, I believe that with the support of my professional strategies and timely signals, I will surely be able to assist you in breaking through investment bottlenecks and achieving new breakthroughs in the trading field.

Gold 1H Intra-Day Chart 39.06.2025Option 1: Gold rejects from CMP or from $3,346 & drops towards $3,240.
Option 2: Gold keeps moving higher into another strong demand zone of $3,416.
Which scenario do you find more likely?

GOLD Short From Resistance! Sell!
Hello,Traders!
GOLD made a bullish
Rebound from the support
Below just as we predicted in
Our previous analysis but
Gold is still trading in the
Downtrend as the lower lows
And higher highs are intact
And the structure is healthy
So after the price retested the
Horizontal resistance above
Around 3,310$ we are
Likely to see a further
Bearish move down
Sell!
Comment and subscribe to help us grow!
Check out other forecasts below too!
Disclosure: I am part of Trade Nation's Influencer program and receive a monthly fee for using their TradingView charts in my analysis.

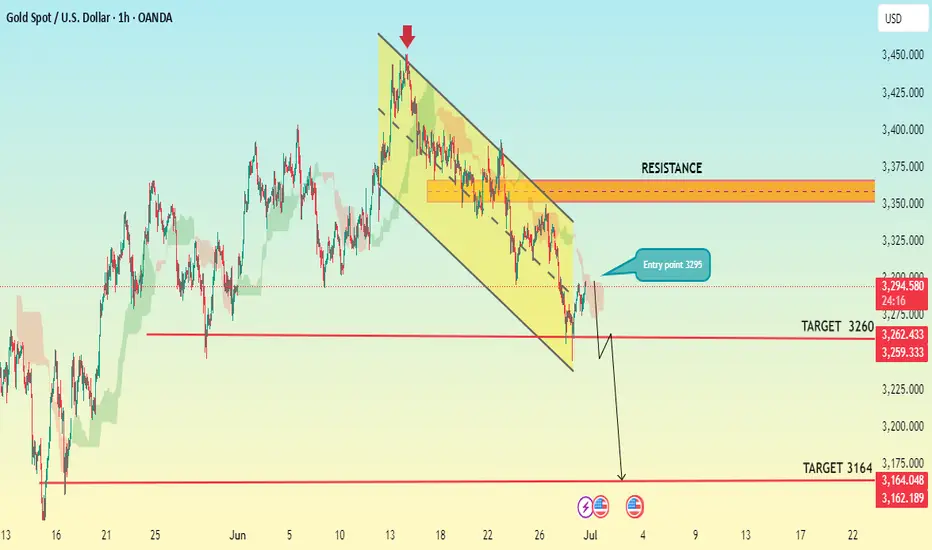
XAUUSD H-1 CHART PATTERNSell Setup (Bearish Bias)
Support: 3360
Entry Point (Sell): 3295
Target 1: 3260
Target 2: 3164
Suggested Stop Loss:
Above 3360, e.g., 3380 depending on market structure.
Summary:
Price is expected to break below the 3360 support zone.
Selling from 3295 aims to capture momentum down toward 3260 and 3164.
Gold is trading in a narrow range, awaiting a breakout.During Monday's U.S. trading session, spot gold demonstrated certain resilience, reflecting the complex game between market risk aversion and risk appetite. This week, it will welcome the impact of the U.S. non-farm payroll report. At the beginning of Monday (June 30) trading, spot gold once fell 0.8% to $3,247.87 per ounce, a new low since May 29. However, geopolitical concerns still attracted bargain hunting to support gold prices, which have now rebounded to around $3,267.30 per ounce, as Trump said he would consider bombing Iran again and abandon the plan to lift sanctions. U.S. President Trump stated that the July 9 trade negotiation deadline is not fixed and hinted that it may be advanced or postponed. This statement injected more uncertainty into the market. Although U.S. Treasury Secretary Mnuchin optimistically stated that the Trump administration is expected to reach agreements with multiple major trading partners before Labor Day on September 1, the uncertainty of the negotiations may still provide some support for gold prices. The progress of trade negotiations will become one of the important variables affecting gold prices in the coming weeks.
In the 1-hour chart, the moving averages of gold continue to form a bearish alignment with a death cross, and there is a possibility of further downward divergence. The bearish momentum in gold remains extremely strong. After breaking below the previous low of 3,295, gold failed to stage a meaningful rebound and has been in a weak, range-bound decline under pressure. Therefore, the level of 3,295 remains a key inflection point for gold's short-term bull-bear dynamics. In the early session, with gold pressured below 3,295, shorting on rallies is recommended.
Trading Strategy:
sell@3300-3295
TP:3255-3260

GOLD WILL FALL|SHORT|
✅GOLD is trading in a
Downtrend and the price is
Making a typical rebound but
After the horizontal resistance
Level above around 3,300$ is
Retested we will be expecting
A further bearish move down
SHORT🔥
✅Like and subscribe to never miss a new idea!✅
Disclosure: I am part of Trade Nation's Influencer program and receive a monthly fee for using their TradingView charts in my analysis.

Gold long-short strategy US trading range operation
Gold prices (XAU/USD) recovered some of their losses during Monday's Asian trading session, driven by expectations that the Federal Reserve may cut interest rates further this year (and perhaps earlier than previously expected). This prospect weighed on the dollar, making dollar-denominated gold more attractive to overseas buyers.
However, the recent improvement in global risk sentiment (driven by the US-China trade agreement and the Israeli-Iranian ceasefire agreement) may reduce the safe-haven demand for gold. Investors will now turn their attention to upcoming comments from Federal Reserve officials, with Atlanta Fed President Rafael Bostic and Chicago Fed President Austan Goolsbee expected to speak later in the day.
Gold prices recovered, accumulating around the 3,300 price range at the beginning of the new week. Still in a major downtrend.
⭐️Set Gold Price:
🔥Sell Gold Area: 3316-3318 SL 3323
TP1: $3305
TP2: $3290
TP3: $3277
🔥Buy Gold Area: $3248-$3246 SL $3241
TP1: $3258
TP2: $3270
TP3: $3286
⭐️Technical Analysis:
Set reasonable buy orders based on technical indicators EMA 34, EMA89 and support and resistance areas.

GOLD XAUUSD potential 1-2 setup to downsideLooking at an potential 1-2 setup to the downside wave 3 of 5. adding to my previous gameplay

XAUUSD I Trade Update Welcome back! Let me know your thoughts in the comments!
** XAUUSD Analysis - Listen to video!
We recommend that you keep this pair on your watchlist and enter when the entry criteria of your strategy is met.
Please support this idea with a LIKE and COMMENT if you find it useful and Click "Follow" on our profile if you'd like these trade ideas delivered straight to your email in the future.
Thanks for your continued support!Welcome back! Let me know your thoughts in the comments!

GOLD - Price can grow to resistance line of wedge patternHi guys, this is my overview for XAUUSD, feel free to check it and write your feedback in comments👊
Some time ago price bounced from $3390 level and declined, but soon turned back and even entered to resistance area.
After this, the price dropped from this area and then started to grow inside the wedge, where it at once made an impulse up.
Price reached $3390 level one more time and broke it, after which it continued to grow to the resistance line of the wedge.
When it reached this line, price turned around and in a short time declined below $3390 level, breaking and then made a retest.
Later, Gold broke $3300 level and fell to the support line of the wedge, after which it rose to the resistance area.
Now I expect that Gold can make a correction to almost support line and then bounce up to $3320 resistance line of the wedge.
If this post is useful to you, you can support me with like/boost and advice in comments❤️
Disclaimer: As part of ThinkMarkets’ Influencer Program, I am sponsored to share and publish their charts in my analysis.

XAUUSD – June 30, 2025: Trade Strategy Right Now – Focus on SellGold OANDA:XAUUSD has been recovering slightly toward the 3,282 USD zone, but macroeconomic headwinds remain strong:
- The U.S. Dollar Index (DXY) TVC:DXY remains above 106.3 – the highest level in a month – making gold less attractive due to increased opportunity cost.
- U.S. 10-year Treasury yields remain firm around 4.35%, reflecting market expectations that the Fed will maintain tight monetary policy.
- Core PCE data for June remains elevated, far from the Fed's 2% target – lowering the likelihood of a rate cut anytime soon.
- Geopolitical tensions are cooling off, reducing demand for safe-haven assets like gold.
➡ These macro factors suggest that the current rebound in gold is more technical than fundamental, and unlikely to signal a major trend reversal.
1. Technical Analysis – XAUUSD OANDA:XAUUSD on D1 Timeframe
- After bouncing from 3,255 USD, price is now testing the 3,285 – 3,295 USD resistance zone.
- This is a Fibonacci retracement zone (0.5 – 0.618) from the previous bearish leg 3,314 → 3,255.
- EMA20 and EMA50 remain downward-sloping, signaling that the dominant trend is still bearish.
- RSI is hovering around 52, suggesting mild momentum but not enough for a confirmed bullish reversal.
➡ The current price behavior aligns with a pullback within a downtrend, with potential for continuation to the downside.
2. Trade Setup – Short-Term Sell Strategy
Primary Setup: Sell the Rally
Entry: Sell near 3,294 – 3,295
Stop Loss: 3,300
Take Profit 1: 3,260
Take Profit 2: 3,244
Take Profit 3: 3,225
Ps: Gold OANDA:XAUUSD is showing signs of a technical bounce, but fundamentals and structure still support the downtrend. Selling at resistance remains the preferred strategy as long as macro pressure persists.
The strategy will be updated continuously – don't forget to save and follow to avoid missing key opportunities.
Analysis by @Henrybillion

Gold: Eyes on QML Zone for Potential Reaction Before Deeper DropHello guys!
Let's go deep into the GOLD chart!
Price has completed a liquidity grab near 3440 (marked as "a hunting") and is now heading downward toward a key QML zone.
First, a reaction is expected around the QML area (3180–3220), where previous structural interest and demand may cause a temporary bounce.
After this reaction, the price is likely to retest higher, potentially forming a lower high.
Then, the dominant bearish structure is expected to continue, with a possible sharp drop toward the final demand zone around 3050–3080.
This movement represents a classic manipulation.

XAUUSD: Market analysis and strategy on June 30Gold technical analysis
Daily chart resistance 3350, support 3225
4-hour chart resistance 3310, support 3245
1-hour chart resistance 3295, support 3260
From the 4-hour level, after gold fell to 3255 last Friday, the real candlestick chart was difficult to continue to fall, suggesting that the downward momentum has slowed down. It is necessary to pay attention to the possibility of double bottom support at 3245. At the same time, this is also the 0.618 support level of the golden section of the 3120-3452 band. With the MACD showing signs of bottom divergence, short-term operations are bearish, but the probability of rebound is also very high. The short-term support position below the market is near 3281, and the break will look at 3260-3247; the important pressure position is near 3295; the break will look at 3309-3313!
BUY: 3281near
BUY: 3260near
BUY: 3245near

Gold is trading sideways. Has it reached a high point?On the first trading day of this week, after hitting 3247 in the early Asian session, it quickly rebounded to around 3295, and then fell back slightly. It is currently maintained at around 3285.
From the hourly chart, the Fibonacci 0.618 position of this trend from 3247 to 3297 is at 3278. The price has always been above 3278, but it has only fallen below this position in a very short time. If the retracement does not break through the 0.618 position, there is a high probability that there will be a high point in the subsequent trend.
Next, we should focus on the area around 3280. If the price always closes above 3280, then today's high point of 3297 will most likely be refreshed. If the upward trend is opened again, it is very likely to touch around 3310. 3310 is also the current 0.618 position. And it is also the top position of this hourly chart range.
Therefore, we should be cautious when shorting gold above 3280, as there is a high probability that it will reach above 3300.
Aggressive trading can rely on entering the market and going long near 3280, and the profit range is between 3300-3310.
For short strategy trading, Quaid recommends that it is safer to short when the price rebounds near 3310.

XAUUSD:Sharing of the Latest Trading StrategyAll the trading signals this week have resulted in profits!!! Check it!!!👉👉👉
Early Session Dynamics:
Gold rebounded in today’s early trading after finding support at the prior low of 3245, aligning with our weekly forecast. The intraday strategy prioritizes a low-level rebound correction, with short positions to be initiated at resistance levels.
Key Technical Levels:
Resistance: 3295–3308
Support: 3250–3240
4-Hour Chart Perspective:
The market remains weak with high volatility. The double-bottom effect at 3245 is unconfirmed, and no bottoming pattern has emerged. Thus, the week’s initial outlook is for a range-bound oscillation between 3308 and 3240:
A rebound opportunity exists as long as 3240 holds.
A break above 3308 could trigger upward momentum.
Intraday Trading Strategy:
Lacking follow-through in the European session, the short-term trend is viewed as range-bound
Sell@3305-3295
TP:3285-3250
buy@3250-3260
TP:3285-3300

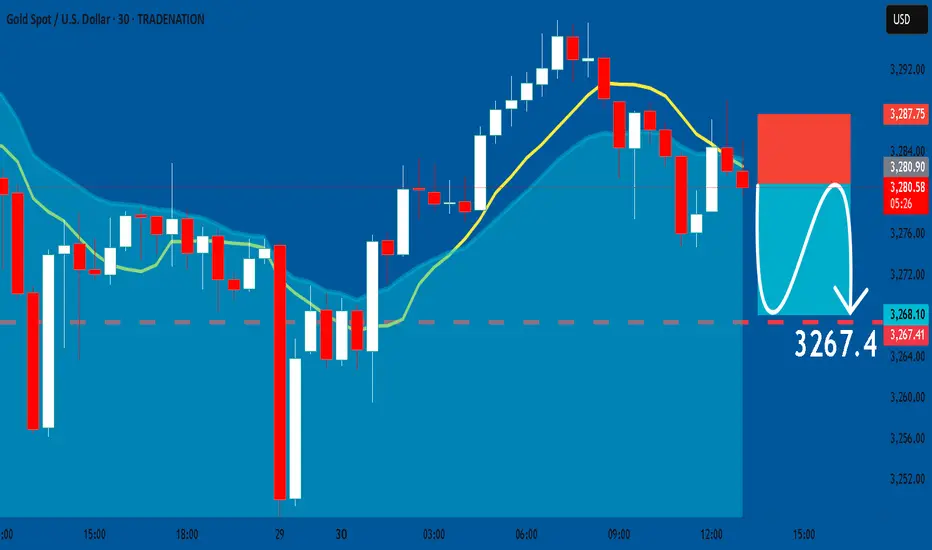
GOLD: Bearish Continuation & Short Signal
GOLD
- Classic bearish formation
- Our team expects pullback
SUGGESTED TRADE:
Swing Trade
Short GOLD
Entry - 3280.9
Sl - 3287.7
Tp - 3267.4
Our Risk - 1%
Start protection of your profits from lower levels
Disclosure: I am part of Trade Nation's Influencer program and receive a monthly fee for using their TradingView charts in my analysis.
❤️ Please, support our work with like & comment! ❤️
Battle Plan – 30 JuneHey, Snipers! It’s Sunday night, the real ones are back on the charts and the tourists are out of the game.
Last week, gold tried every trick in the book: fake bounces, liquidity sweeps, endless bearish grind. Every move up got sold. If you traded like a sniper, you’re still standing. If you chased dips blindly, you’re probably licking your wounds.
🌍Macro snapshot:
Dollar’s holding firm — no rescue from US news, just choppy reactions.
War headlines are everywhere, but structure is king: EMAs are stacked, every rally is just bait for liquidity.
Market’s running on fear and patience. Fast money gets chopped, disciplined money survives.
Sniper Mindset:
⛔No bias, no forced trades. The real win is in the waiting.
Structure will show you who’s in control — your job is to react, not predict.
🥷 GoldFxMinds Battle Plan – 30 June (Trade Nation Feed)
Demand (Buy) Zones:
3265–3245: The “half-mitigated” trap. Most buyers are already underwater — we wait for a real PA shift. First green candle? Ignore it. Let them get trapped.
3215–3200: This is the sniper zone for real discount hunters. If price freefalls, we watch for exhaustion, divergence, and a proper story. One clean engulfing here and the bounce can be massive.
3180–3160: Only for flash crash days — this is where pain turns into opportunity. But you wait for panic, not “hope trades.”
Supply (Sell) Zones:
3287–3300: First sell window — if price spikes, watch for that classic NY liquidity grab and an instant rejection.
3320–3335: The “don’t even try to buy here” zone. OB, FVG, and every EMA lines up — if the market gets here, expect a brutal fade.
3345–3360: Premium fantasy land for sellers. If bulls get cocky, this is where the big shorts reload for the next leg down.
🧠Sniper Mindset:
EMAs stacked above? No dreams, only discipline.
No confirmation in your zone? Stand down — the market isn’t your friend.
Most traders buy “cheap” — we buy right.
If the story’s not clear, patience pays. The first bounce is a trap, the second is the setup.
📝June’s about to end. Let’s close it out with surgical entries and sniper exits.
Stay sharp, stay humble, and let the crowd chase while we collect.
🧠Remember: green candles aren’t invitations, they’re traps for the impatient.
Wait for confluence, act on logic, and journal every single lesson.
Gold rewards discipline — not luck.
If you’re serious about gold, learn this:
Zone + confluence + confirmation = sniper entry.
Anything else is just gambling with a nice chart.
Review your trades, journal your mistakes, and stop blaming the market for your impatience.
Hit like🚀, follow, and drop your trading question if you want the next level.
See you on the Trade Nation feed.

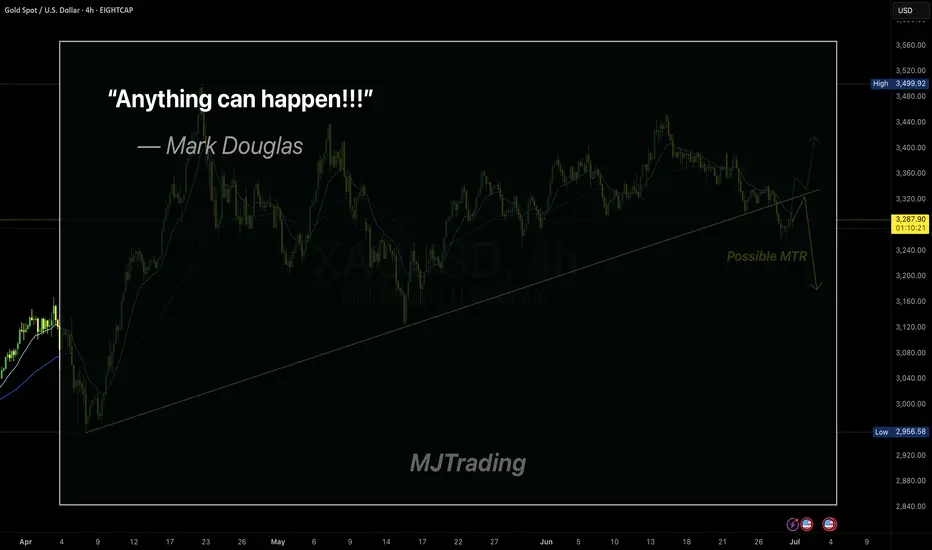
Embracing Uncertainty
In trading, the illusion of certainty is often our biggest enemy.
Even the cleanest setups—like a MTR (Major Trend Reversal)—can fail.
Mark Douglas said it best:
“Anything can happen.”
This simple truth is what keeps professional traders humble and disciplined.
Respect the market, manage your risk, and never assume you know what comes next.
Stay sharp.
#MJTrading
#GoldTrading #XAUUSD #TradingPsychology #AnythingCanHappen #MarkDouglas #ForexMindset #TradingQuotes #PriceAction #RiskManagement #MindOverMarkets #ChartOfTheDay #MJTrading
XAU/USD Trade Setup – June 30, 2025📉 XAU/USD Trade Setup – June 30, 2025
Bias: Short (Sell Position)
Entry Zone: Around $3,363–$3,370
Stop-Loss: 🔺 $3,259 (Above recent highs)
Take-Profit 1: 🎯 $3,308
Take-Profit 2: 🎯 $3,302
Risk/Reward: Favorable (1.8–2.2:1 depending on entry)
🔍 Technical View
Trend: Bearish below $3,370
Structure: Price rejected key resistance at $3,370–$3,380
Indicators:
RSI weakening near 50 (bearish bias)
MACD crossing down on H1
Key Zone: A break and close below $3,350 will likely drive price toward your TP zones at $3,308 and $3,302.
⚠️ Notes
Volatility expected near NY session open or if macro data hits (e.g. Fed speakers, inflation prints)
Consider scaling out partial profits at TP1 ($3,308) to lock gains

GOLD - SHORT TO $2,800 (UPDATE)As expected last week Gold climbed into our 'Supply Zone' of $3,347 & rejected as I said it would on our video analysis. It even managed to close below our 'BOS' zone.
The game plan this week is to keep an eye on market structure for further sells. With every pump up we should be looking at how price can sell off again & how we can join the sell trend to profit off it.

XAUUSD Channel Down starting new Bearish Leg.Gold (XAUUSD) has been trading within a 2-week Channel Down, recently rejected on its 4H MA50 (blue trend-line). The last Lower High was priced on the 0.5 Fibonacci retracement level, so currently we are on the ideal level for a new short.
With a 4H Death Cross emerging, we are targeting the 1.382 Fibonacci extension (as the previous Bearish Leg did) at 3210 for the Channel's new Lower Low.
-------------------------------------------------------------------------------
** Please LIKE 👍, FOLLOW ✅, SHARE 🙌 and COMMENT ✍ if you enjoy this idea! Also share your ideas and charts in the comments section below! This is best way to keep it relevant, support us, keep the content here free and allow the idea to reach as many people as possible. **
-------------------------------------------------------------------------------
Disclosure: I am part of Trade Nation's Influencer program and receive a monthly fee for using their TradingView charts in my analysis.
💸💸💸💸💸💸
👇 👇 👇 👇 👇 👇
