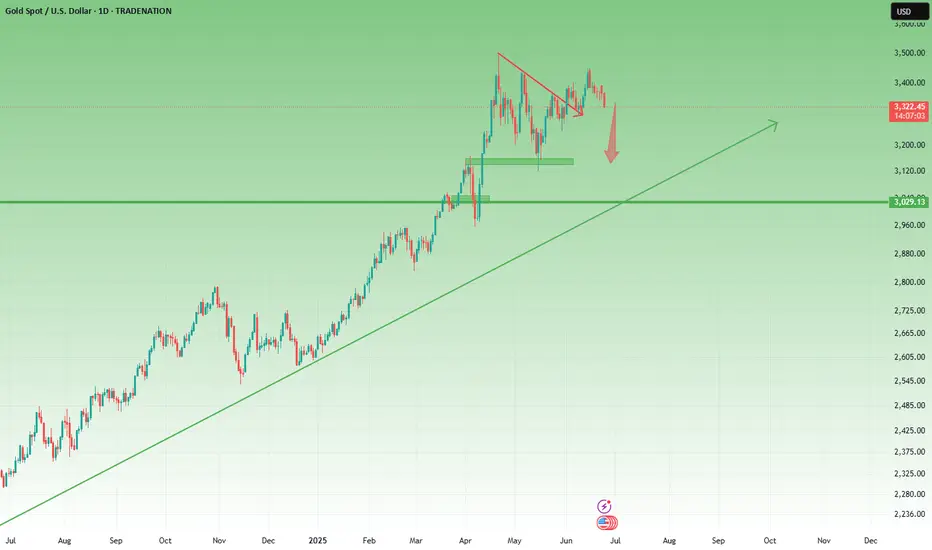
Gold Rebounds After Filling Gap >> Bullish Continuation in SightHello guys!
Gold (XAU/USD) is showing signs of strength on the 4H chart after filling a key gap around the $3,290 level and bouncing off it with bullish intent.
🔹 What I see:
– Price previously broke out of a broad descending channel, flipping the structure bullish
– After forming a rising wedge, Gold corrected lower and filled the gap
– The zone around $3,290 acted as solid support, and the current bounce suggests bulls are regaining control
📈 Outlook:
If this bounce holds and momentum builds, the next area of interest is clearly marked:
🎯 First Target: $3,466 – an area of prior structure and possible supply
📍 Current Price: $3,329
🟢 Bias: Bullish (above $3,290)
🔴 Invalidated below: $3,244
This setup offers a favorable risk-to-reward opportunity if the structure continues holding. Keep an eye on price action near the recent local highs for confirmation.
Xauusd(w)

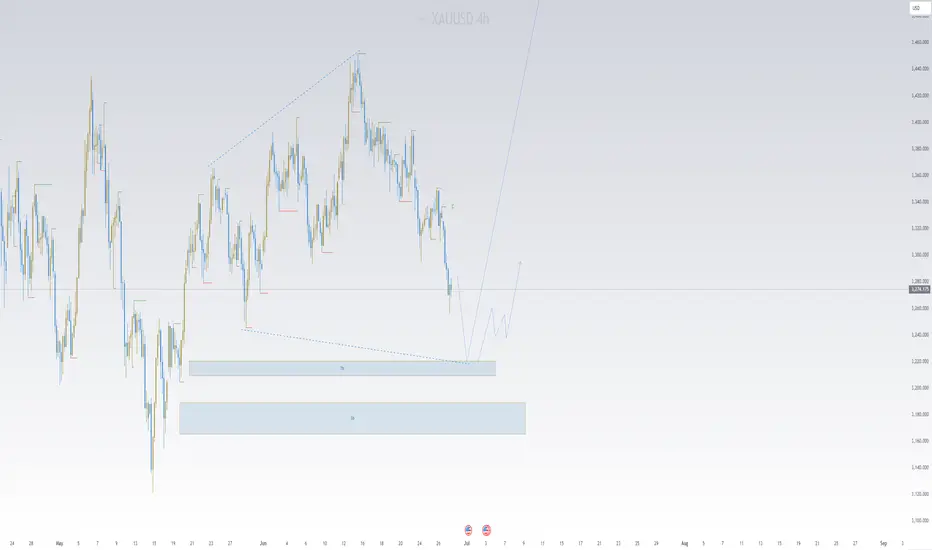
Gold may bounce up from support line of channel to 3330 pointsHello traders, I want share with you my opinion about Gold. Previously, the price broke out of a symmetrical triangle and moved confidently toward the seller zone. However, it failed to consolidate there and formed a downward channel, where price action has remained since. The movement inside this channel has been consistent, respecting both the resistance and support lines. After reaching the lower boundary, the price bounced up and approached the resistance area (3290 - 3300), which now acts as a key short-term obstacle. This zone was tested multiple times and served as support earlier, making it a strong technical level. Currently, the price is trading just below this zone and forming a base for the next move. I expect a possible retest of the support line of the downward channel, which may provide the impulse needed for a new upward move. In my opinion, the price will rebound from the bottom of the channel and start to grow toward the current resistance level at 3300. If this level is broken and confirmed via a retest, I expect continued movement toward the channel’s upper resistance line. That’s why I set my TP 1 at 3330 points, right near the resistance line of the channel. Please share this idea with your friends and click Boost 🚀
Disclaimer: As part of ThinkMarkets’ Influencer Program, I am sponsored to share and publish their charts in my analysis.

XAUUSD D1 Forecast: Gold at Pivotal 325x Support What's Next for the Yellow Metal?
Today, we're zooming out to examine the broader picture for Gold (XAUUSD) on the Daily (D1) timeframe. Our latest analysis indicates that Gold has encountered a very strong, critical support level around the 325x region. This is a pivotal point that could significantly influence Gold's medium to long-term direction!
🌍 Macroeconomic Landscape: The Underlying Forces Influencing Gold
While we've observed a degree of USD weakness stemming from speculations around the Federal Reserve (such as the rumours regarding Jerome Powell's replacement) and expectations of interest rate cuts, these factors haven't fully countered Gold's recent decline on the daily chart. Furthermore, the sustained ceasefire between Israel and Iran continues to temper Gold's appeal as a safe-haven asset.
Nevertheless, the current price action at the robust 325x support level presents a significant technical signal. The impact of forthcoming US macroeconomic data (particularly the PCE Price Index on Friday) and speeches from FOMC members will be crucial in confirming or negating our projected movements for Gold. Should positive news for Gold align with this support holding, it could act as a potent catalyst.
📊 XAUUSD D1 Technical Analysis: Projecting Gold's Next Move
Given that Gold has reached strong support at 325x, we can anticipate the following scenarios:
Bounce from 325x (Potential Upside Phase):
If the 325x area (which reinforces the 3264.400 support from image_e9d325.png) holds firm, we expect a strong reaction and an upward move for Gold.
The initial target for this bounce would be the 332x region, aligning with resistance levels 3313.737 - 3330.483 from our previous analysis. On a broader timeframe (as illustrated in image_83845c.png), this corresponds to the resistance zone around 3326.022. This 332x area might represent a continuation pattern, suggesting it could be a corrective rally before the resumption of the larger trend.
Resumption of Downtrend (After Reaching 332x):
Once Gold reaches and tests the 332x zone (3313.737 - 3330.483 / 3326.022) and exhibits bearish confirmation signals (e.g., a strong bearish engulfing candle, a pin bar, or a clear top formation), we anticipate a resumption of the downward movement.
The next major target for this decline would be the 317x area, which correlates well with the strong support at 3173.052 on the larger timeframe (as depicted in image_83845c.png).
🎯 XAUUSD D1 Trading Plan: Your Long-Term Strategy Ahead!
Considering the current D1 analysis, here's our actionable plan:
1. BUY PHASE (Bounce from Support):
Entry: Observe price reaction in the 325x - 326x zone (specifically 3264.400). Only consider buying if there are clear bullish confirmations (e.g., a confirmed bullish pattern on the daily or 4-hour candle, a strong bounce from the zone with significant volume).
SL (Stop Loss): Position just below the 325x support zone (e.g., 3245-3240, depending on confirmation).
TP (Take Profit): 3280 - 3284 - 3290 - 3295 - 3300 - 3305 - 3310 - 3313.737 - 3320 - 3326.022 (key 332x zone). This will be our primary target for the potential bounce.
2. SELL PHASE (Downtrend Resumption):
Entry: Once the price reaches and tests the 332x zone (3313.737 - 3330.483 / 3326.022) and shows bearish confirmation signals (e.g., a strong bearish engulfing, pin bar, or clear top formation).
SL (Stop Loss): Position slightly above the 332x zone (e.g., 3335-3340).
TP (Take Profit): 3326 - 3320 - 3316 - 3310 - 3305 - 3300 - 3295 - 3290 - 3280 - 3200 - 3173.052 (final 317x target).

Gold is coiling for a breakout... All eyes on the next move!📉 Gold is currently moving within a minor descending channel.
In yesterday’s analysis, I pointed out the potential for a drop. Now, after a period of range-bound movement, I expect a breakout from this channel and a return to the main trend.
🎯 The first target on a reversal would be the top of the minor channel.
Keep a close eye on price action here — this zone could be key for the next move
OANDA:XAUUSD

GOLD 4H: not all that glitters is bullish...The 4H chart shows a clean descending triangle breakdown. Price failed to reclaim the trendline and was rejected under both MA50 and MA200. The bounce into 3325–3340 was absorbed — classic liquidity sweep and fade. Volume confirms bearish control.
Technically, the breakdown below 3320 opens the way toward $3293 (1.0 Fibo), $3250 (1.272 extension), and final target at $3195 (1.618), where buyers might step in. RSI supports the continuation without signs of reversal. Structure broke — and the market is telling us where it's heading.
Tactical plan:
— Entry at market or on a retest of $3325–3335
— Targets: $3293 → $3250 → $3195
— Stop: above $3340 (above MA50 and broken trendline)
When gold looks shiny, smart traders look deeper. This breakout isn’t golden — it’s a trap for late bulls.

Gold Trade Setup - 27/Jun/2025Hi Traders,
I expect this pair to go Up after finishing the correction.
1) Need to wait for market to show changing of the direction.
2) The current move can be just a part of a correction or an impulse in itself. Going to follow the market behavior at my zones.
How to Enter : Look for engulfing with in the SL zone.
Soybeans Crashing Into Demand — Reversal Coming or Trap?1. COT REPORT — Updated June 17, 2025
📌 Non-Commercials (Speculators)
Long: +5,661 → 195,984
Short: -9,226 → 110,761
✅ Net Long Increase: A clear bullish shift in speculative positioning (+14,887 net contracts). This is an early indication of a sentiment reversal.
📌 Commercials (Hedgers / Producers)
Long: +6,023
Short: -5,806
➡️ The decrease in net shorts suggests improving confidence among institutional players.
📌 Total Open Interest: 846,169 (down by 12,776)
❗ This slight drop may be linked to position rotation or partial profit-taking.
2. NET POSITIONS CHART INSIGHT
Commercial traders remain structurally net short, but their exposure has been gradually declining since March.
Non-commercial traders have increased their net long positions since April, aligned with the price's technical recovery.
The current price is trading near the historical mean, indicating neutral conditions with potential room for further upside.
🕰️ 3. SEASONALITY OUTLOOK
The June–July period has historically been bearish:
June Average Performance:
Last 5 years: -39.61
Last 2 years: -38.71
July Average Performance:
Last 20 years: -44.82
Last 2 years: -34.73
📉 August and September typically continue this seasonal downtrend.
🟨 Caution is advised on initiating long positions during this phase.
📊 4. TECHNICAL OUTLOOK —
Current Structure:
Rising channel has broken to the downside with a strong bearish impulse candle.
RSI is neutral but previously showed bearish divergence.
Key Support Zones:
1035–1025: Intermediate support area already tested.
1012–994: Golden Pocket aligned with a demand block — likely target zone with high potential for reaction.
Possible Scenarios:
🔴 Bearish Continuation: A retracement followed by a move down into the 994–1000 range, where a tactical long setup may emerge.
🔵 Bull Trap and Reversal: A rapid recovery above 1050, potentially triggering a continuation to 1080 (range top).
5. EXECUTION SUMMARY
Primary Bias: Bearish in the short term
🎯 Target Zone: 994–1000
🛑 Invalidation Level: Weekly close above 1055
Tactical Long Setup: Monitor price action at 994–1000 for bullish reaction.
Macro context and speculative positioning suggest a structural bottom may develop in Q3 2025, but current conditions are not yet favorable for a full swing position.

CADCHF at the Cliff's Edge – Is a Breakdown Imminent? 🧭 Technical Context
Price is currently sitting at the key support area of 0.5890–0.5900, tested multiple times since April.
This week’s candlestick shows a clear close below the intermediate micro-structure (two consecutive closes under recent lows), confirming bearish pressure.
The weekly RSI remains in a neutral-to-low zone, trending downwards with no active bullish divergence.
📉 Technical Conclusion: Active bearish bias. Watch out for potential false breaks below 0.5890 as liquidity traps.
📊 COT Report – as of June 17, 2025
🇨🇦 CAD
Non-Commercials: added +8.5k long contracts, aggressively cut −18.3k shorts
→ Excessive optimism, potential exhaustion on the buy-side
Commercials: added +31k shorts
→ Typical hedge behavior – signaling protection from CAD devaluation
🇨🇭CHF
Net positions in gradual decline with no sharp moves → CHF remains in consolidation, with a defensive tone
Open Interest dropped by −19.5k → Institutional money exiting positions
→ Interpretation: Market likely preparing for a directional breakout, CHF could act as a safe haven
📉 COT Conclusion: CAD appears overbought, CHF still gathering strength. Bearish bias on CADCHF remains intact.
📅 Seasonality – June Pattern
CHF tends to strengthen in June:
+0.0095 (10Y average), +0.0068 (5Y average)
CAD shows structural weakness in June:
−0.0027 (10Y), −0.0076 (5Y)
📉 Seasonality Conclusion: June favors CAD weakness and CHF strength → Bearish confirmation for CADCHF
🧠 Retail Sentiment
92% of retail traders are long CADCHF, only 8% are short
→ Extreme imbalance = classic contrarian signal
📉 Sentiment Conclusion: Confirms potential for continued downside on CADCHF
✅ Trade Plan Summary
📌 Base scenario:
Short CADCHF if we get a daily/weekly close below 0.5890
🎯 Target 1: 0.5820
🎯 Target 2: 0.5770
🚫 Invalidation: daily close above 0.5960 (invalidates current setup)
📌 Alternative scenario:
Short from 0.5960–0.6000 if we get a bearish rejection pattern → ideal for better R/R


XAUUSD Long Trendline is broken. Mid Term Swing TradeXAUUSD, Long term trendline is now broken. Price should come up to that level to continue it's downward move.
* It's entirely my prediction with some logical reason but I will request everyone to see this as a reference, Thank you

XAUUSD – Bearish Trend Continues After Channel BreakoutGold is currently moving within a clearly defined descending channel, with successive lower highs confirmed at each retest of the dynamic resistance line. Following news of a temporary ceasefire between Iran and Israel, gold's safe-haven appeal weakened, triggering strong selling pressure that drove prices sharply lower, breaking below the key $3,260 support.
A rounded top pattern and a clean breakout beneath the channel indicate that sellers are in control. The next downside target lies around the $3,218 confluence zone, where a temporary bullish reaction may occur. The nearest resistance on a pullback is around $3,349 – aligned with the broken upper channel boundary and a dense FVG zone.
If the price fails to quickly reclaim the broken channel, the bearish trend is likely to persist in the short term. Traders should closely monitor price action near the $3,218 zone for potential entries or reversals.

XAUUSD : Ready for More Upside Before Another Fall ?By analyzing the gold chart on the 4-hour timeframe, we can see that price initially followed our bullish scenario, climbing 140 pips up to $3336. However, after hitting that level, gold reversed and entered the bearish scenario, dropping below $3300 and eventually finding support around $3255.
This area acted as a strong demand zone, and we’ve since seen a rebound. Currently, gold is trading around $3273, and as long as price holds above the marked demand zone (Bullish Rejection Block), we may expect another bullish move before price potentially targets the liquidity below $3245 and $3203.
Please support me with your likes and comments to motivate me to share more analysis with you and share your opinion about the possible trend of this chart with me !
Best Regards , Arman Shaban

Gold: Market analysis and strategy for June 27Gold technical analysis
Daily chart resistance level 3350, support level 3250
4-hour chart resistance level 3340, support level 3245
1-hour chart resistance level 3300, support level 3280
Technical indicators show that the 4-hour moving average system shows a dead cross arrangement, and the MACD indicator dead cross continues. The gold price has fallen below the lower track support of the Bollinger Band, and the Bollinger Channel is narrowing. The short-term price is in a low-level weak consolidation pattern.
The 1-hour chart price broke the previous low of 3295, but the price is oversold and may rebound in the short term. The short-term support level below is around 3280. If it falls below, continue to look at the 3271-3245 range; the important pressure level is around 3300!
If there is a short-term rebound before the NY market, wait until the rebound before continuing to sell! The current minimum is 3279. After the short-term stabilization, refer to the resistance of 3300/3310 to sell.
Sell: 3300near
Sell: 3310near

XAUUSD Daily Update: Gold Enters "Strong Bearish MomentumXAUUSD Daily Update: Gold Enters "Strong Bearish Momentum" – Where Are the Opportunities?
Hello TradingView Community!
Hot news from the Gold (XAUUSD) market today! We've just closely analyzed the Daily Chart and spotted a crucial signal: Gold's downward momentum is extremely strong and clear! This indicates that the short-term trend may have shifted, or selling pressure is currently overwhelming other supporting factors.
🌍 Current Macroeconomic Context (A Multi-faceted View):
Previously, we discussed how a weaker USD might support Gold. Indeed, concerns about the Fed's independence (due to rumors of Powell's replacement) and expectations of Fed rate cuts have pushed the USD lower, typically a positive for Gold.
However, the market isn't driven by just one factor. The sustained ceasefire between Israel and Iran is reducing Gold's safe-haven demand. It appears that, at present, factors like decreased safe-haven demand and potentially strong technical breakdowns are prevailing, creating significant selling pressure on the daily timeframe. We also need to emphasize that the market remains very cautious about confirming a bottom for Gold, and we are still awaiting crucial US economic data (especially PCE on Friday) and FOMC speeches.
➡️ In summary: While a weaker USD theoretically supports Gold, the price action on the daily chart clearly shows bears are dominating. We must respect this signal and adjust our strategy accordingly.
📊 XAUUSD Technical Analysis (Focus on Daily Chart - Strong Bearish Momentum!):
Based on the strong bearish signal from the Daily timeframe and key price levels from the chart (image_e9d325.png):
Primary Trend on Daily: Clearly strong bearish momentum. Large, consecutive bearish candles breaking previous support zones indicate overwhelming selling pressure.
Resistance Zones (Potential SELL Opportunities - where price might retrace before falling further):
3313.737 - 3315: This is the nearest and most important resistance area. If the price retraces here, it could present an opportunity to sell.
3321.466 - 3330.483: A stronger resistance zone, if price retraces deeper.
3341.947: Extremely strong resistance, unlikely to be reached in this context unless there's a major trend-reversing news event.
Support Zones (BUY Opportunities - extremely cautious, only for Scalp or clear reversal signals):
3294.414: Immediate support, but could be easily broken if bearish momentum persists.
3276.122: The next support area if the price continues to fall.
3264.400: This is a very strong support and a potential downside target if bearish momentum holds. Consider BUYs here only if price hits this level and shows clear reversal patterns on smaller timeframes.
🎯 Updated XAUUSD Trading Plan (Prioritizing SELLs):
Given the strong bearish momentum on the Daily chart, we will prioritize active SELL entries and approach BUY scalps with extreme caution, only at very strong support levels or with clear reversal confirmations.
1. ACTIVE SELL TRADES (Priority):
SELL ZONE 1 (Selling at near resistance):
Entry: 3313 - 3315 (If price retraces to this area and shows bearish rejection candle patterns on H1/H4)
SL: 3320 (Just above the nearest resistance)
TP: 3310 - 3305 - 3300 - 3295 - 3290 - 3280 - 3276.122 (Next target according to the chart) - 3264.400 (Final target if strong bearish momentum continues)
SELL ZONE 2 (Selling at stronger resistance - if deeper retracement):
Entry: 3331 - 3333 (If price retraces deeper and shows reversal signals)
SL: 3337
TP: 3326 - 3320 - 3316 - 3310 - 3305 - 3300 - 3294.414
2. CAUTIOUS BUY TRADES (Only for Scalp/Clear Reversal Signals):
BUY ZONE (BUY SCALP AT STRONG SUPPORT):
Entry: 3266 - 3264 (Only buy if price hits this zone and shows clear reversal signals on M15/M30, such as reversal candle patterns, RSI divergence, etc.)
SL: 3260 (Very tight, acknowledging higher risk)
TP: 3270 - 3276.122 - 3280 - 3284 - 3290 (Aim for short TPs, no expectation of prolonged uptrend in strong bearish conditions)
INTERMEDIATE BUY SCALP:
Entry: 3284 - 3282 (If price has broken down through here and retraces, wait for confirmation)
SL: 3278
TP: 3288 - 3292 - 3296 - 3300 (Short-term targets only)
⚠️ Crucial Factors to Monitor Closely Today:
Price Action at Resistance/Support Levels: How price reacts at these key marks will dictate the next move.
US Macro Data (especially PCE on Friday): Any surprising news can rapidly reverse the current trend.
FOMC Speeches: Can induce significant volatility in USD and Gold.
Geopolitical Situation: Although currently optimistic, any unexpected developments could reignite safe-haven demand.

GOLD - SHORT TO $2,800 (UPDATE)Our original sell bias from $3,347 which I posted live for you all, is now running in deep profits! Market is now down & running 810 PIPS in profit in just 2 days.
We have broken structure to the downside, crossing below our previous 'Wave E' low, indicating & acting as stronger confluence that Gold will carry on down towards our $2,800 target. Huge profits en-route for us all in this free channel.

GOLD ROUTE MAP UPDATEHey Everyone,
A fantastic close to the week as our analysis once again played out level to level with precision!
As a follow-up from yesterday's post:
- The swing range completed the move into 3348, as expected.
- However, we had no further EMA5 lock above, confirming rejection back into the swing range.
- This was followed by an EMA5 cross and lock below 3306, opening the secondary swing range.
- That range played out perfectly today, hitting both 3288 and 3271 targets.
We’re now seeing a bounce off those levels giving the 20 to 40 pips, and we will now be observing to see if the full secondary swing is completed.
It's Friday, and it's been a PIPTASTIC week across the board. Well done to everyone following the plan and sticking to the levels.
QUICK RECAP
BULLISH TARGET
3376 - DONE
BEARISH TARGETS
3348 - DONE
EMA5 CROSS AND LOCK BELOW 3348 WILL OPEN THE SWING RANGE
3330 - DONE
3306 - DONE
EMA5 CROSS AND LOCK BELOW 3306 WILL OPEN THE SECONDARY SWING RANGE
3288 - DONE
3271 - DONE
We’ll be back now on Sunday with our multi-timeframe analysis and trading plans for the week ahead. Thanks again for all your likes, comments, and follows.
Wishing you all a fantastic weekend!!
Mr Gold
GoldViewFX

"Gold Vault Breach! XAU/USD Heist Plan in Motion"🏴☠️💰 XAU/USD Gold Heist Blueprint 💰🏴☠️
“The Vault’s Open… Time to Load Up!”
🌟Hi! Hola! Ola! Bonjour! Hallo! Marhaba!🌟
Dear Money Makers & Market Robbers 🤑💰💸✈️
Get ready to execute the Golden Robbery with style and precision! Based on our 🔥Thief Trading Style🔥 using both technical & fundamental weapons, we’ve decoded the latest gold vault password: XAU/USD (Gold vs USD) is showing bullish bias!
🎯 Heist Instructions:
📈 Entry Point –
“The vault is wide open!”
Enter long anytime — but for the sharp shooters, place buy limits on the most recent 15/30min swing lows or pullback zones for a stealthier entry. Let the retracement pull the guards away 😏🔐
🛑 Stop Loss –
🔒 Set your Thief SL just below recent swing lows on the 4H timeframe (around 3310.0).
🔧 Adjust based on risk tolerance, lot size, and number of open trades — every heist has its escape plan!
🏁 Target Zone –
🎯 Aim for 3395.0 — or vanish before the cops show up!
Trail the stop as you go and don’t get greedy — wealth is preserved when exits are clean! 🏃♂️💨
🧲 Scalper's Advisory:
Only steal on the Long Side! Bulls are funding this operation.
💼 Big pockets? Dive in.
💳 Small stack? Swing with the pros & follow the plan.
🎯 Use Trailing SL to keep the loot safe.
📊 Market Insight – Why We Rob Gold Now?
XAU/USD shows bullish momentum 🐂 backed by:
Macro & Fundamental Data 🧠
Geopolitical & Intermarket Trends 🌍
COT Reports & Sentimental Outlook 💼
Dollar Weakness + Safe Haven Flow 💸
📚 Always cross-check the news wires & reports to validate the path! Fundamentals are the lockpick tools behind every breakout! 🔓📈
⚠️ Stealth Warnings:
📆 News Events = Increased Surveillance!
🚫 No new entries during high-volatility news drops.
🛡 Use Trailing SL on live trades to secure the bag.
💖 Wanna Support Our Heist Style?
Smash that 🚀 BOOST BUTTON 🚀
It fuels our Thief Army and helps you & your crew loot the market with confidence and flair!
Every day’s a new caper — follow the plan, manage your risk, and stay outta jail! 🏆💪🤝🎉
🔐 See you in the next Robbery Blueprint — Stay Locked & Loaded!
🐱👤💼📈💣💸

Nasdaq Hits New ATH at $22,570 – Eyes Now on $23,200 and $24,000By analyzing the #Nasdaq chart on the weekly timeframe, we can see that the index followed our previous analysis perfectly, hitting the $22,400 target and printing a new all-time high at $22,570!
Momentum remains strong and bullish, and we expect price to continue climbing toward the next targets. Based on the original projection, upcoming targets are $23,200 and $24,000.
Stay tuned for the next update!
Please support me with your likes and comments to motivate me to share more analysis with you and share your opinion about the possible trend of this chart with me !
Best Regards , Arman Shaban

GOLD Trading Opportunity! BUY!
My dear subscribers,
GOLD looks like it will make a good move, and here are the details:
The market is trading on 3270.6 pivot level.
Bias - Bullish
My Stop Loss - 3260.7
Technical Indicators: Both Super Trend & Pivot HL indicate a highly probable Bullish continuation.
Target - 3289.4
About Used Indicators:
The average true range (ATR) plays an important role in 'Supertrend' as the indicator uses ATR to calculate its value. The ATR indicator signals the degree of price volatility.
Disclosure: I am part of Trade Nation's Influencer program and receive a monthly fee for using their TradingView charts in my analysis.
———————————
WISH YOU ALL LUCK

XAUUSD - Gold Bearish Bias Remains StrongXAU/USD remains under bearish pressure on the 4-hour timeframe. Until price breaks and closes above $3,336 with strength, selling the rallies remains a preferred strategy. However, watch for potential bounces near support zones, especially if momentum weakens or reversal candles appear. The price is currently trading below both the 50, 100 and 200 EMA, indicating a short-term downtrend. The recent price action has respected the trendline resistance and failed to break higher, reinforcing sellers’ control.
Price structure has formed a descending channel, which often signals a bearish continuation. However, if price finds a strong reaction from support, a temporary rebound could occur before further downside. Overall sentiment is cautious due to recent geopolitical de-escalation between Iran and Israel, which reduced gold’s safe-haven demand. Dollar strength, driven by hawkish Fed tone, continues to pressure gold.
Key Support Levels :
$3,295 – A minor support where previous candles showed buying interest.
$3,289 – Critical horizontal support and psychological level.
$3,270 – Next significant support if $3,289 breaks.
$3,240 – Major support zone, last line before larger downside moves.
Key Resistance Levels:
$3,310 – Near-term resistance and EMA zone.
$3,320 – Price rejection level from earlier 4H candles.
$3,336 – Strong resistance with previous swing highs.
Note
Please risk management in trading is a Key so use your money accordingly. If you like the idea then please like and boost. Thank you and Good Luck!

This Trendline Has Held Since January, Will Gold Finally Break?Gold (XAUUSD) is currently testing a key ascending trendline that has acted as dynamic support since early 2025. Today's price action shows strong bearish pressure, but confirmation is still needed as the daily candle has not yet closed below the trendline. A decisive close beneath this level would signal a potential shift in market structure and open the door for further downside. Fundamentally, mixed U.S. data adds to the uncertainty—while Personal Income (-0.4%) and Spending (-0.1%) came in below expectations, the Core PCE Price Index rose to 0.2%, suggesting lingering inflationary pressure.
If price breaks and closes below 3,260, I’ll consider a bearish continuation toward 3,200, 3,120, and possibly 3,000. However, if bulls defend this zone and reclaim 3,300+, a short-term bounce could still play out. For now, I'm staying patient and waiting for the daily close to confirm direction.

GOLD recovers, capped by $3,350, trend viewOANDA:XAUUSD recovered then weakened as it failed to break above $3,350, supported by a weaker dollar and market uncertainty sparked by reports that U.S. President Donald Trump could replace Federal Reserve Chairman Jerome Powell in September or October. The reports raised concerns about the future independence of the Federal Reserve, boosting demand for safe-haven gold.
On Wednesday, Trump called Powell “terrible” and said he was considering three or four candidates to replace him. Meanwhile, the Wall Street Journal reported that Trump was even considering announcing a potential successor as early as September or October.
The current market narrative is that once Trump nominates a new Fed chair, market expectations will tend to favor a more “dovish” Fed. This could lead to a weaker US dollar, higher long-term US Treasury yields and higher stock prices.
Forexlive points out that this story may be more an emotional reaction than a result of objective and rational thinking. The policy of the FOMC (Federal Open Market Committee) is decided not only by the Fed Chairman but also by a majority vote of the 12 voting members (including 7 directors and 5 regional Fed presidents). The Fed Chairman does have a lot of influence, but he does not have absolute control over monetary policy. The Fed was originally designed to be independent of political pressure.
Moreover, even if Trump nominates the next chairman, there is no guarantee that this will automatically lead to a rate cut. In fact, Powell was also nominated by Trump, but his monetary policy decisions are still based on professional judgment rather than serving Trump's wishes.
So, in the worst case, the market could face policy uncertainty as differences between FOMC members increase and more disagreements emerge. Currently, there are fewer moderate members on the committee, while neutral or hawkish members dominate.
Markets are now focused on personal consumption expenditure (PCE) data due later today (Friday) for further clues on whether the Federal Reserve will cut interest rates.
On the geopolitical front, a ceasefire between Israel and Iran appeared to be in place on Wednesday after Trump hailed a swift end to the 12-day conflict at the NATO summit and said he would seek a commitment from Iran to abandon its nuclear ambitions in talks next week.
Technical Outlook Analysis OANDA:XAUUSD
On the daily chart, after gold recovered and reached the initial target at 3,350 USD, the nearest resistance is also the price point of the EMA21 noted for readers in the previous publication.
However, the recovery momentum is currently weakening, specifically at the time of writing, the gold price is falling below 3,320 USD. Gold falling below 3,320 USD provides conditions for a possible decline with the next target around 3,302 - 3,300 USD, which is the area of the 0.382% Fibonacci retracement confluence with the lower edge of the price channel.
In terms of momentum, the RSI is heading down and breaking below 50, which should be considered an initial bearish signal.
Overall, gold does not have a clear long-term trend as the uptrend is still the main trend, while the momentum is showing signs of decline.
But personally, I am still leaning towards the uptrend, and continue to look for positions to buy.
Finally, the notable positions will be listed as follows.
Support: 3,302 – 3,300 USD
Resistance: 3,320 – 3,350 – 3,371 USD
SELL XAUUSD PRICE 3367 - 3365⚡️
↠↠ Stop Loss 3371
→Take Profit 1 3359
↨
→Take Profit 2 3353
BUY XAUUSD PRICE 3272 - 3274⚡️
↠↠ Stop Loss 3268
→Take Profit 1 3280
↨
→Take Profit 2 3286
Gold Fails to Hold the Fear – Ceasefire Triggers 500+ Pip DropIn yesterday’s analysis, I pointed out that despite the weekend escalation in the middle-east, which triggered a gap up in Gold, the price action didn’t confirm the fear narrative. Gold failed to hold its gains – a clear sign of weakness.
📌 What happened next?
Throughout the day, Gold attempted multiple pushes toward 3400 – but each effort was met with strong selling pressure.
Then came the ceasefire announcement… and Gold dropped hard, now trading around 3320, locking in over 500 pips of profit from my short setup.
________________________________________
❓ More importantly, what’s next for Gold?
More important than the short-term noise is what the charts are now telling us:
📉 Weekly chart? Bearish.
🕯️ Daily chart? Also turned bearish after last week’s indecisive price action.
________________________________________
📌 Strategy remains the same:
I continue to sell rallies, and I’m now watching the 3280 support zone for a possible test in the coming hours.
Patience. Discipline. Let the market come to you. 🚀
Disclosure: I am part of TradeNation's Influencer program and receive a monthly fee for using their TradingView charts in my analyses and educational articles.