Gold Holds Above $3340 as Dollar Drops and Fed Uncertainty Rises GOLD OVERVIEW
Gold Holds Gains as Dollar Weakens and Fed Uncertainty Grows
Gold climbed above $3,340 per ounce on Thursday, supported by a sharp decline in the U.S. dollar amid growing dovish expectations from the Federal Reserve.
Adding to market speculation, U.S. President Donald Trump hinted he may announce a new Fed Chair as early as September or October, potentially reducing Jerome Powell’s influence before his term ends in June and boosting expectations for a more accommodative policy stance.
TECHNICAL OUTLOOK – XAU/USD
Gold shows bearish potential if the price can stabilize below the pivot level at 3,341.
However, while trading above 3,341, a short-term correction toward 3,364–3,365 is likely before any renewed selling pressure.
Today’s U.S. GDP release may add further volatility and direction to the market.
Key Levels
Pivot Line: 3,341
Resistance: 3,364 → 3,373
Support: 3,320 → 3,302
previous idea:
Xauusd(w)

Waiting for data release to rebound and short📰 Impact of news:
1. PCE and Consumer Index
📈 Market analysis:
The current price of 3280 has a higher profit and loss ratio advantage. Technical indicators show that the hourly chart is severely oversold. Combined with the top and bottom conversion of 3300 above, there is a 20-point rebound space in the short term. If the PCE data is in line with the trend, gold prices are expected to quickly regain the 3,300 mark. Note that negative data beyond expectations may cause a brief decline.
🏅 Trading strategies:
BUY 3295-3280-3275
TP 3298-3300-3310
SELL 3300-3310
TP 3290-3280-3260-3250
If you agree with this view, or have a better idea, please leave a message in the comment area. I look forward to hearing different voices.
TVC:GOLD FXOPEN:XAUUSD FOREXCOM:XAUUSD FX:XAUUSD OANDA:XAUUSD

Is gold in an ascending triangle, or in a wider range?A quick technical piece on TVC:GOLD . What are your thoughts?
MARKETSCOM:GOLD
Let us know what you think in the comments below.
Thank you.
77.3% of retail investor accounts lose money when trading CFDs with this provider. You should consider whether you understand how CFDs work and whether you can afford to take the high risk of losing your money. Past performance is not necessarily indicative of future results. The value of investments may fall as well as rise and the investor may not get back the amount initially invested. This content is not intended for nor applicable to residents of the UK. Cryptocurrency CFDs and spread bets are restricted in the UK for all retail clients.

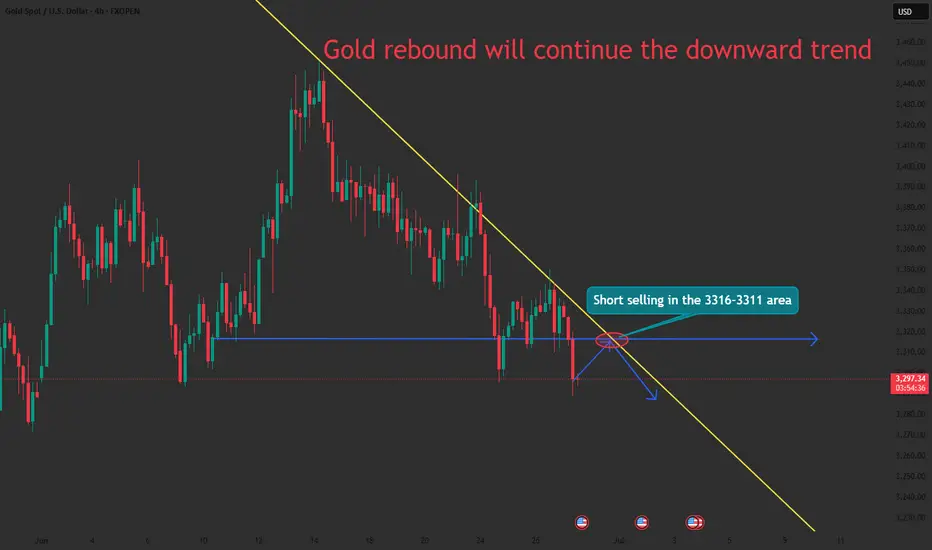
GOLD - SELL TO $3,288 (1H VIEW)Still looking for a move lower into the $2,787 - $3,276 zone, to take out the June low, like I mentioned to you all a few days ago.
Tomorrow is Friday so be careful as price action could be choppy & use strict risk management.
⭕️Imbalance Left Below $3,300 Psychological Number.
⭕️Either Wave 2 or Wave C Not Complete of Major Impulse Move Down.
⭕️Sellers Holding Below Resistance Zone.
TP: $3,288

Gold is weak. Can it continue?Gold is still fluctuating and falling slightly today. Gold is weak, so gold is likely to be short-term. If the price rebounds, it will be a short opportunity.
We need to pay attention to the release of US PCE data later.
From the 1-hour chart
the moving average continues to cross the short arrangement and diverge downward. After gold fell below the early support near 3340, it began to move downward weakly. The current upward pressure is around 3295-3310.
From the daily chart, the price is below the MA20 cycle and the 50 cycle, but remains above the 100 cycle. The technical indicators turned higher, but the momentum indicator is at a neutral level, and the RSI index is around 42.7, which does not point to an upward trend.
Since the upcoming data may have some impact on the price, the price may have a short-term high opportunity. Steady trading is still waiting for the price to rise and then short. Of course, if your trading strategy is more aggressive, you can use a long strategy before the price rises.
Operation suggestions:
Radical: Buy near 3280, stop loss at 3265, profit range 3305-3310.
Conservative: Wait for the price to rise and then bear pressure, sell near 3310, stop loss at 3320, profit range 3290-3285.

XAUUSD Daily Sniper Plan – June 27, 2025Hey traders! Today’s a trader’s dream: high-impact US news, gold trapped in a tight coil between supply and demand, and price flirting with the decision zone. The first breakout will be explosive — but only one side survives the trap. Let’s lock in the real structure, real bias, and sniper-level execution.
🔸 HTF Bias Breakdown
Daily Bias: Neutral → Price trapped between major supply (3359) and HTF demand (3282). Expect breakout after news.
H4 Bias: Bearish → Lower highs holding below 3359, structure weak below 3340.
H1 Bias: Mixed → Bullish momentum building off 3310–3282, but compression under EMAs warns of a fake rally.
🔹 Key Levels Above Price
3385 – Final top-side liquidity zone (last week’s spike high)
3359–3344 – HTF supply & OB (main short zone)
3340–3330 – The pivot zone (battle for control)
🔸 Key Levels Below Price
3317–3310 – Primary demand zone (where buyers stepped in yesterday)
3297–3282 – Deep liquidity pocket & HTF OB (last chance for bulls)
3260 – Breakdown zone if everything fails below
🔥 Sniper Zones & Execution Logic
🔴 3385–3375 – Extreme Supply
Only trade this zone if NY news launches price up and rejection is instant. Needs M5/M15 bearish reversal (engulfing, CHoCH, FVG fill). No news spike = no trade.
🔴 3359–3344 – Main Supply Zone
This is your first real short setup. Sweep into this area + rejection = clean short trigger. Confluence: HTF OB, FVG, EMA 100 rejection, bearish CHoCH.
⚔️ 3340–3330 – Pivot Decision Zone
This is where direction flips.
Break and hold above 3340 = bullish → targets 3359 / 3375
Rejection under 3330 = bearish → back toward 3310 or 3282
Plan: Use for break/retest entries only with M5/M15 confirmation. No blind trades.
🟢 3317–3310 – Primary Demand Zone
Watch for news-induced sweep, then M15 bullish PA (CHoCH, engulfing, RSI bounce). First safe buy zone if structure holds.
🟢 3297–3282 – Deep Demand Zone
Only used if NY session nukes the market. Enter only on textbook SMC/ICT reversal + RSI sub-30. This is the last stand for bulls.
🧠 Execution Strategy
Wait for NY news and first liquidity sweep. Don’t guess.
Sell 3359–3344 or 3375+ only on strong rejection
Buy 3310 or 3282 only on bullish reversal confirmation
Pivot 3340–3330 is the heart of today — use for break/retest or trap reversal
If you love clear logic, tap like, follow, and share your bias in the comments! 🚀👇
Disclosure: I am part of TradeNation's Influencer program and I'm using their TradingView charts in my analyses and educational articles.
GoldFxMinds

XAUUSD:Go long
Short - term first do a rebound.
Trading Strategy:
BUY@3283-86
TP:3297-3304
More detailed strategies and trading will be notified here ↗↗↗
Keep updated, come to "get" ↗↗↗

DeGRAM | GOLD broke the demand zone📊 Technical Analysis
● Price sliced beneath the long-term rising‐channel base and the triangle apex, turning 3 300-3 310 into fresh supply; the current pull-back is a textbook bearish retest of the break zone.
● Hourly structure now tracks a new descending trend-line; failure to reclaim 3 300 keeps momentum pointed to the next fib / horizontal shelf at 3 280, with the channel width projecting 3 245 support.
💡 Fundamental Analysis
● Rebound in US 2-yr yields after hawkish Fed speakers and a stronger-than-expected durable-goods print lifted the DXY, reducing short-term bullion appeal.
-------------------
Share your opinion in the comments and support the idea with a like. Thanks for your support!

GOLD Bearish Breakout! Sell!
Hello,Traders!
GOLD made a bearish
Breakout of the key
Horizontal level of 3,300$
And the breakout is confirmed
So we are bearish biased and
We will be expecting a
Further bearish continuation
Sell!
Comment and subscribe to help us grow!
Check out other forecasts below too!
Disclosure: I am part of Trade Nation's Influencer program and receive a monthly fee for using their TradingView charts in my analysis.

Is today Black Friday?On Thursday, gold prices rose to 3350 with support from 3333-30. When the key support of 3320 was broken, it indicated that the short-term rise turned into a fall. This morning, the rebound to 3320 confirmed the pressure of the top and bottom conversion, and then slowly fell all the way to break the integer mark of 3300 US dollars.
In 4 hours, it has fallen below the previous low of 3295, and will continue to fall. There are two support positions below, namely 3277 and 3263. Don’t expect a big rebound before going short in the negative market. If the rebound is large, it will not fall. This kind of negative decline is generally judged by the 15- and 30-minute patterns. When resistance appears in the big cycle, the market has actually fallen a lot.
Today, I think the pressure is mainly in the 3300 and 3310 areas. 3310 can be considered as the pressure of the top and bottom conversion. Pay attention to 3377 and 3363 below. If you consider more, you may be at a relatively extreme position of 3363. For the time being, the general direction is mainly short.

Gold Breakdown Confirmed — Bearish Pennant Targets UnfoldingGold ( OANDA:XAUUSD ) started to decline as I expected in my previous idea after the lower lines of the Ending Diagonal broke .
Gold is moving near the Resistance zone ($3,349-$3,325) . And Gold seems to be crossing the 50_SMA(Daily) .
From a Classical Technical Analysis perspective , the Bearish Pennant Pattern seems to indicate a continuation of the downtrend in Gold .
From an Elliott wave theory perspective , it seems that Gold has completed the Zigzag Correction(ABC) , and we can expect the next 5 downwaves .
I expect Gold to continue to decline at least to the Support zone($3,281-$3,243) and Monthly Pivot Point .
Note: Stop Loss (SL) = $3,360
Gold Analyze (XAUUSD), 1-hour time frame.
Be sure to follow the updated ideas.
Do not forget to put a Stop loss for your positions (For every position you want to open).
Please follow your strategy; this is just my idea, and I will gladly see your ideas in this post.
Please do not forget the ✅ ' like ' ✅ button 🙏😊 & Share it with your friends; thanks, and Trade safe.

XAUUSD: Gold's Muted Ascent Below $3350 XAUUSD: Gold's Muted Ascent Below $3350 – Navigating Key Levels Amidst USD Weakness!
Hello TradingView Community!
Let's delve into the intricate world of Gold (XAUUSD) today. The yellow metal is showing a subtle positive bias, largely influenced by a weaker US Dollar, yet a decisive bullish breakout above the $3350 mark remains elusive.
🌍 Macroeconomic Landscape: Forces Shaping Gold's Path
Gold has maintained a slight positive stance for the second consecutive day, but it's struggling to find significant follow-through, staying below the $3350 level in early European trading.
USD Under Pressure – A Tailwind for Gold: The primary driver for Gold's recent strength is the weakening US Dollar. Reports suggesting President Trump is considering replacing Fed Governor Jerome Powell have sparked concerns about the US central bank's future independence. This speculation has fueled market expectations for further Fed rate cuts this year, pushing the USD to its lowest point since March 2022, thereby providing support for non-yielding assets like Gold.
Cautious Outlook Prevails: Despite USD weakness, a definitive bullish trend for Gold is not yet confirmed. The ongoing ceasefire between Israel and Iran holds firm, with prevailing optimism limiting significant safe-haven rallies. This complex environment necessitates caution before confirming a definitive bottom for Gold or positioning for a substantial recovery from levels below $3300.
Key Data Ahead: Traders are keenly awaiting upcoming US macroeconomic data and speeches from FOMC members. These insights will be crucial in influencing XAU/USD, particularly ahead of Friday's pivotal US Personal Consumption Expenditures (PCE) Price Index release.
📊 XAUUSD Technical Outlook: Pinpointing Strategic Zones
Based on recent technical analysis (referencing image_e9d325.png for key levels), Gold is in a consolidation phase after a recent sharp decline, trading around the $329X mark. Price action below shorter-term moving averages suggests either lingering bearish pressure or an accumulation phase.
Strong Support Zones (Potential Buy Areas): Critical demand areas are identified around 3294.414, 3276.122, and notably 3264.400. These levels are crucial for potential price bounces.
Key Resistance Zones (Potential Sell Areas): Significant supply zones are found at 3313.737, 3321.466, 3330.483, and 3341.947. These are points where selling pressure may emerge.
🎯 XAUUSD Trading Plan: Your Actionable Strategy
Here's a breakdown of the strategic entry and exit points for your XAUUSD trades:
BUY ZONE (Strong Support - Long-Term Bias):
Entry: 3266 - 3264
SL: 3270
TP: 3280 - 3284 - 3290 - 3295 - 3300 - 3305 - 3310 - 3320
BUY SCALP (Quick Buy at Intermediate Support):
Entry: 3284 - 3282
SL: 3278
TP: 3288 - 3292 - 3296 - 3300 - 3305 - 3310 - 3320 - 3330
SELL ZONE (Key Resistance):
Entry: 3331 - 3333
SL: 3337
TP: 3326 - 3320 - 3316 - 3310 - 3305 - 3300
SELL SCALP (Quick Sell at Near Resistance):
Entry: 3313 - 3315
SL: 3320
TP: 3310 - 3305 - 3300 - 3295 - 3290 - 3280
⚠️ Key Factors to Monitor Closely:
US Macro Data: Friday's US Personal Consumption Expenditures (PCE) Price Index is paramount for market direction.
FOMC Member Speeches: Any official comments on monetary policy or inflation outlook will significantly impact USD and Gold.
Geopolitical Stability: Developments related to the Israel-Iran ceasefire can influence safe-haven demand.

XAU/USD 27 June 2025 Intraday AnalysisH4 Analysis:
-> Swing: Bullish.
-> Internal: Bullish.
Analysis and bias remains the same as analysis dated 23 April 2025
Price has now printed a bearish CHoCH according to my analysis yesterday.
Price is now trading within an established internal range.
Intraday Expectation:
Price to trade down to either discount of internal 50% EQ, or H4 demand zone before targeting weak internal high priced at 3,500.200.
Note:
The Federal Reserve’s sustained dovish stance, coupled with ongoing geopolitical uncertainties, is likely to prolong heightened volatility in the gold market. Given this elevated risk environment, traders should exercise caution and recalibrate risk management strategies to navigate potential price fluctuations effectively.
Additionally, gold pricing remains sensitive to broader macroeconomic developments, including policy decisions under President Trump. Shifts in geopolitical strategy and economic directives could further amplify uncertainty, contributing to market repricing dynamics.
H4 Chart:
M15 Analysis:
-> Swing: Bullish.
-> Internal: Bullish.
Following previous high, and printing of bearish CHoCH, price has pulled back to an M15 supply zone, where we are currently seeing a reaction. Therefore, I shall now confirm internal high.
Price is now trading within an established internal range.
The remainder of my analysis shall remain the same as analysis dated 13 June 2025, apart from target price.
As per my analysis dated 22 May 2025 whereby I mentioned price can be seen to be reacting at discount of 50% EQ on H4 timeframe, therefore, it is a viable alternative that price could potentially print a bullish iBOS on M15 timeframe despite internal structure being bearish.
Price has printed a bullish iBOS followed by a bearish CHoCH, which indicates, but does not confirm, bearish pullback phase initiation. I will however continue to monitor, with respect to depth of pullback.
Intraday Expectation:
Price to continue bearish, react at either M15 supply zone, or discount of 50% internal EQ before targeting weak internal high priced at 3,451.375.
Note:
Gold remains highly volatile amid the Federal Reserve's continued dovish stance, persistent and escalating geopolitical uncertainties. Traders should implement robust risk management strategies and remain vigilant, as price swings may become more pronounced in this elevated volatility environment.
Additionally, President Trump’s recent tariff announcements are expected to further amplify market turbulence, potentially triggering sharp price fluctuations and whipsaws.
M15 Chart:

XAU/USD GOLD 4H + 1H PREMIUM TECHNICAL OUTLOOK – JUNE 27, 20254-HOUR TIMEFRAME – HIGHER TIMEFRAME BIAS
Gold continues to trade near its all-time highs, consolidating just below a recent swing high of $3,315. Despite minor pullbacks, the macro trend remains bullish, with bullish structure still intact. Recent price action shows shallow retracements and strong rejections of key fib levels, a typical sign of underlying smart money accumulation.
Price Action & Market Structure
Gold recently printed a Break of Structure (BOS) at $3,290, followed by a retest of the broken level.
We observed a Change of Character (CHoCH) near $3,300, quickly invalidated by bullish strength – further confirming accumulation behavior.
Market remains in bullish alignment unless $3,250 is broken decisively.
Key Support & Resistance Zones
Resistance $3,315–$3,320
Demand $3,275–$3,282
Support $3,250
Targets $3,340 / $3,355
Smart Money Concepts (SMC)
Liquidity Grab beneath $3,275 likely triggered retail stop hunts
4H Bullish Order Block between $3,275–$3,282 remains unmitigated
Imbalance Zone: $3,283–$3,289 – price may wick into this before launch
Sell-side liquidity taken below $3,275 → bullish reaction
Buy-side liquidity sits above $3,315 → likely short-term magnet
ZOOMING INTO 1-HOUR CHART – INTRADAY SETUPS
The 1-hour chart aligns with the bullish higher-timeframe bias, offering two potential premium-level setups:
Setup #1: Bullish Rejection from 4H OB
Entry Zone: $3,275–$3,282
This setup targets a liquidity sweep beneath $3,275 followed by bullish mitigation of a clean order block and imbalance zone. Confluence across fibs, OB, and structure support increases probability.
Setup #2: Breakout Retest Play
Trigger: Clean breakout and retest of $3,315
Entry: On successful retest (bullish confirmation candle)
Ideal if momentum pushes through local resistance, clearing buy-side liquidity. Reclaim of structure suggests smart money continuation.
Bearish Contingency (Low Probability for Now)
If price breaks below $3,250 and confirms below structure:
Look to short on retests into $3,275
Target next demand around $3,235
Until that happens, bullish bias remains dominant.
Gold remains one of the most structured and responsive instruments to smart money technicals right now. A well-planned entry around demand, imbalance, or breakout levels provides excellent RRR potential if structure holds.

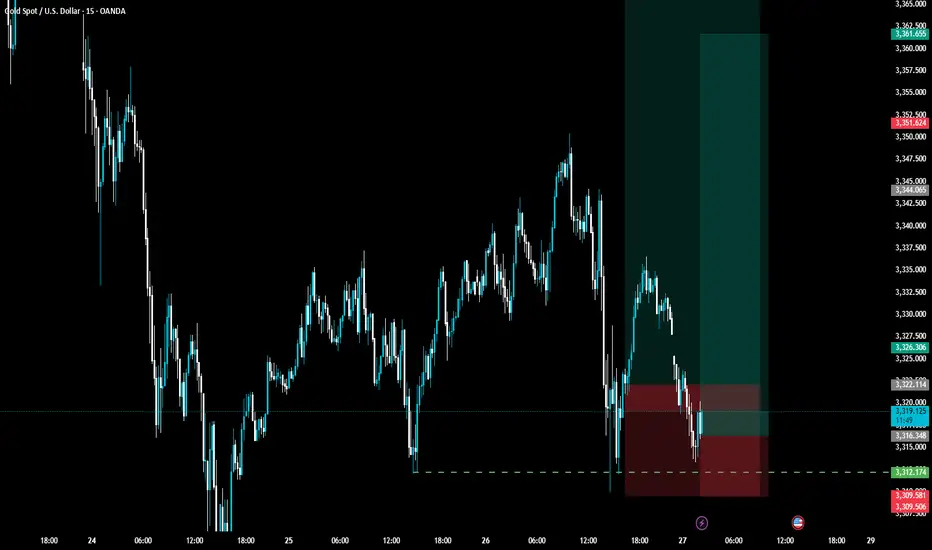
Gold prices are consolidating at a low level!International spot gold continued to fluctuate and fall. Looking back at the market performance on Thursday, gold prices maintained a narrow range of consolidation. Investors focused on the upcoming US inflation data to judge the direction of interest rate policy, while paying close attention to signs of easing geopolitical tensions in the Middle East. The current gold market is facing the influence of multiple factors: in the short term, PCE inflation data will become a key variable in determining the trend of gold prices. If the data is lower than expected, the market will strengthen the Fed's expectations of rate cuts, thereby supporting the upward trend of gold prices; on the contrary, if the inflation data exceeds expectations, it may delay the Fed's pace of rate cuts, resulting in pressure on gold prices. From a medium- and long-term perspective, the low interest rate environment, continued geopolitical risks and the potential weakening trend of the US dollar jointly provide structural support for gold prices. In addition, it is necessary to focus on the capital diversion effect that may be caused by the rising heat of the platinum and palladium markets. It is recommended to closely track the changes in capital flows in the precious metals sector.
From the analysis of the gold 4-hour level chart, today's gold price showed a downward trend at the opening, and the lowest fell to around US$3289.25 and then temporarily stabilized at US$3298. Technical indicators show that the 4-hour moving average system shows a dead cross arrangement, the MACD indicator dead cross continues, the gold price has fallen below the lower track support of the Bollinger Band, and the Bollinger Channel shows a narrowing trend, and the short-term price is in a low-level weak consolidation pattern. In view of the fact that the weekly line is about to close this week and the volatility of the end-of-month market is intensifying, it is necessary to focus on preventing the risk of a second bottoming out of the price. Comprehensively judged, the current gold trend is bearish, and the operation strategy is recommended to focus on rebound shorting.
Operation strategy:
1. It is recommended to short gold in the rebound area of 3311-3316, with a stop loss at 3324 and a target of 3300-3290
XAUUSD MARKET LAYOUTGold has shown to be bearish following the lower liquidity sweep trend channel just as shown in the analysis.
This trend channel shows a path down to the 3270's and 3260's.
Further updates would be given as the market gains momentum.

Gold breaks down. It may reach a low point.From the current market daily chart
The absolute support of gold is around 3280. Gold is basically in the process of maintaining this daily trend support line. Therefore, I personally think that around 3280 is a long-short dividing line for gold. If gold falls below 3280 on the daily line, it is very likely that the decline will just begin. On the contrary, be careful. If 3280 does not fall below, there is still a possibility of rebounding.
In the 4-hour chart, from the high point of 3450 to now, the 0.382 position is just around yesterday's high point of 3350. The 0.618 position is at 3325, and the final 100% position is around 3280. 3280 also coincides with the daily chart.
Therefore, gold must at least test around 3280 today, and it is not ruled out that there will be lower positions.

GOLD drops sharply to 3300 and found important support areaThe recent bearish momentum on GOLD has met a good support zone and at present we started to see early signs of bullish interest returning, right after we got a beautiful rejection from the zone.
Currently I’m expecting for the price to bounce to the target near 3,390 . If this bullish push continues with strong volume and momentum, I’ll be locking in that bias and planning my entry accordingly. I could get involved right here for a more aggressive entry. It’s a bit riskier, but if the structure confirms, I’m more than happy to take the shot, as sometimes the best trades come when you trust your setup.
This is not financial advice.

Analysis and layout of the latest gold trends during the day📰 Impact of news:
1. PCE and Consumer Index
📈 Market analysis:
Judging from the 4H chart, the Bollinger Bands are closing and the MACD is showing a trend of forming a death cross, indicating that the short-selling momentum is still relatively strong in the short term. However, as the overall upward structure has not been destroyed, there is still a possibility of a rebound and repair in the future. During the day, we need to pay special attention to the support strength of the MA5 and MA10 moving averages. It is recommended to adopt the idea of shorting at high levels and going long at low levels. The key support below is the 3305-3295 area, and the upper resistance is the 3340-3350 range. However, judging from the chart, in the short term, there may be a rebound near 3313. At present, it has indeed rebounded to around 3319 as expected. If it falls weakly to this week's low of 3295, you can buy if it does not break. On the whole, if it rebounds to 3335-3345, you can consider shorting, and if the support below 3305-3295 is not broken, go long. Today is Friday, and as it is near the end of the month, market liquidity is strong. Please be cautious in your operations today and be sure to set stop losses strictly.
🏅 Trading strategies:
SELL 3335-3345-3350
TP 3320-3315-3300
BUY 3305-3295
TP 3310-3320-3330
If you agree with this view, or have a better idea, please leave a message in the comment area. I look forward to hearing different voices.

Bulls and bears are anxious? Rebound continues to empty📰 Impact of news:
1. Initial unemployment claims data
📈 Market analysis:
Gold is in a sideways consolidation near 3320 in the short term. The market has no clear direction for the time being, and the long and short positions are in a tug-of-war. The hourly line rebounded to 3328 and then fell back again, suggesting that there is still room for short-term retracement. The current operation needs to focus on key points: if it rebounds to the 3320-3330 resistance area, you can consider entering short positions again. If the market continues to decline, focus on the 3300-3290 support range. If it stabilizes, long orders can be arranged. The overall idea is to maintain a volatile market. Before effectively breaking through 3350 or falling below 3290, high-altitude and low-multiple is still the main strategy.
🏅 Trading strategies:
SELL 3320-3330
TP 3310-3300-3290
BUY 3310-3300
TP 3320-3330-3340
If you agree with this view, or have a better idea, please leave a message in the comment area. I look forward to hearing different voices.
OANDA:XAUUSD FX:XAUUSD FOREXCOM:XAUUSD FXOPEN:XAUUSD TVC:GOLD

GOLD BEARISH BIAS|SHORT|
✅GOLD has printed some
Lower high and lower lows
So despite a long-term uptrend
We are locally bearish biased
Which is reinforced by the recent
Bearish breakout of both the
Rising and horizontal support lines
So we will be expecting a
Further bearish move down
With the target of retresting
The key structure below around 3,300$
SHORT🔥
✅Like and subscribe to never miss a new idea!✅
Disclosure: I am part of Trade Nation's Influencer program and receive a monthly fee for using their TradingView charts in my analysis.

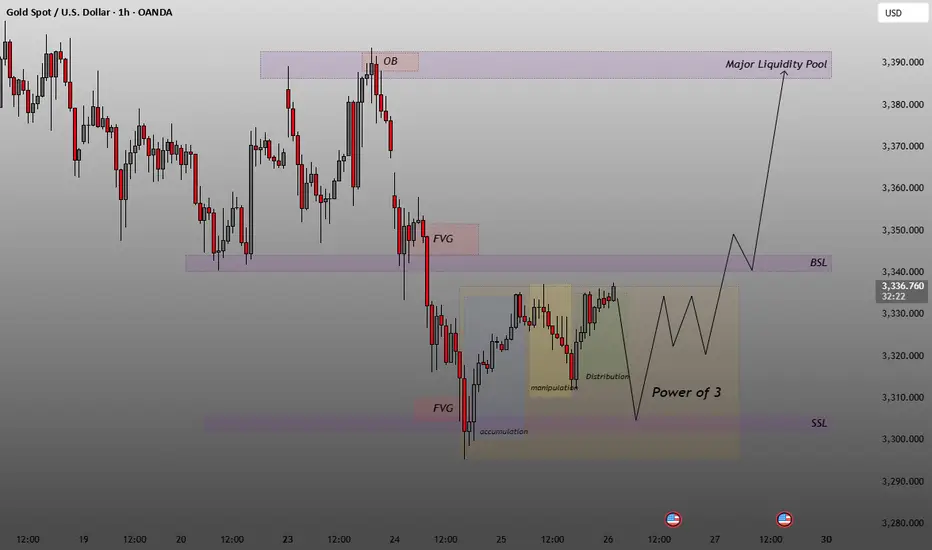
XAUUSD 1H–Power of 3, Liquidity Grab, FVG Fill & Bullish TargetThis is a classic Smart Money Concept (ICT) setup XAUUSD 1H – Power of 3, Liquidity Grab, FVG Fill & Bullish Targeting OB + Major Pool.
Accumulation at the bottom
Liquidity grab below SSL (Sell-Side Liquidity)
Expecting bullish expansion toward:
FVG fills
Break of BSL (Buy-Side Liquidity)
Tap or break of OB (Order Block)
Final target: Major Liquidity Pool ~3380–3390
🧠
Trade Plan:
Entry: After SSL sweep + bullish confirmation (FVG or MSB)
TP1: FVG fill
TP2: BSL break
TP3: OB or final pool zone
SL: Below manipulation wick.