After grabbing buy-side liquidity (BSL),Instrument: XAU/USD (Gold Spot vs US Dollar)
Timeframe: 1 hour (1h)
Current Price: Approximately $3,322.345
🔍
Marked Zones and Labels
BSL (Buy-side Liquidity): Highlighted near the top yellow zone around the $3,336 - $3,344 range.
Price previously swept above this zone and then reversed, indicating a liquidity grab.
SSL (Sell-side Liquidity): Indicated near the bottom zone, around the $3,300 level.
This suggests a potential target area for price to draw down into.
Supply Zone: The top yellow rectangle, where price was previously rejected.
Demand Zone (or Support): The bottom yellow rectangle labeled with “SSS” (possibly short for “Strong Support Structure”).
📉
Price Action & Forecast
A downward arrow projection is drawn, suggesting a bearish bias.
After grabbing buy-side liquidity (BSL), the expectation is for the market to seek sell-side liquidity (SSL).
Potential downside target near $3,300 or below.
Xauusd(w)

XAU/USD: Range Trading Awaiting BreakoutCore Logic:
1.Macro Drivers: Powell's dovish remarks continue to reverberate, with U.S. Treasury yields declining, the U.S. Dollar Index breaking below 97, and the debt ceiling extended to July 24—safe-haven demand props up gold prices.
2.Technical Outlook:
Currently trading in a $3,300–$3,350 range, with shrinking volume reflecting market caution.
Trend Projection:
- Likely to remain range-bound between $3,300–$3,350; a breakout will depend on progress in previously mentioned catalysts.
- If data misses expectations or geopolitical risks (e.g., Iran tensions) escalate, gold may rally to $3,360; otherwise, it could test $3,300 support.
Trading Strategies:
- Long positions: Enter lightly at $3,300–$3,310, stop-loss at $3,290, target $3,340.
- Short positions: Sell on rejection above $3,345, stop-loss at $3,360, target $3,320.
- Risk management: Cap single-trade exposure ≤3% to mitigate data-driven volatility.
I am committed to sharing trading signals every day. Among them, real-time signals will be flexibly pushed according to market dynamics. All the signals sent out last week accurately matched the market trends, helping numerous traders achieve substantial profits. Regardless of your previous investment performance, I believe that with the support of my professional strategies and timely signals, I will surely be able to assist you in breaking through investment bottlenecks and achieving new breakthroughs in the trading field.

Gold Short Term OutlookYesterday’s chart analysis played out well.
Price broke above the MA50 and tested the $3,346 resistance zone. However, this zone failed to hold, and gold dropped aggressively toward the $3,306 support.
Once again, price is trending below both the 50 and 200 moving averages, indicating continued bearish pressure.
For now, the $3,306 support is holding. Bulls need to break above $3,330-$3,346 for higher levels to open up.
🔑 Key Levels:
Resistance:
$3,346 • $3,361 • $3,375
Support:
$3,306 • $3,287 • $3,271 • $3,242

85% of Traders Are Wrong on GBPCAD - I'm Going Short!📊 COT Analysis
GBP:
Non-Commercials remain net long with 106,282 longs vs 63,425 shorts. However, long positions are decreasing (-4,794) while shorts are slightly increasing (+3,983), suggesting profit-taking or a potential shift in sentiment.
Commercials are strongly net short (35,707 longs vs 87,770 shorts), with a significant reduction in both longs (-24,958) and shorts (-33,457) — a clear reduction in overall exposure.
→ Non-Commercial positioning is still bullish, but momentum is fading.
CAD:
Non-Commercials remain heavily net short (28,154 longs vs 94,487 shorts), but notable changes are taking place: sharp increase in longs (+8,503) and a significant cut in shorts (-18,307), pointing to a possible reversal in sentiment.
Commercials are net long with a rise in both longs (+1,834) and shorts (+31,186), indicating potential hedging as expectations shift.
→ CAD strength is emerging in the COT data, supporting a potential bearish move on GBPCAD.
📈 Seasonality – June/July
GBP tends to perform poorly in June across all historical averages (-0.004 / -0.006). July shows slight positivity but is statistically insignificant.
CAD has a mildly negative June, but July is historically its strongest month (+0.006 / +0.007 on 20Y and 15Y averages).
→ Seasonal bias favors CAD strength in the June–July transition.
🧠 Retail Sentiment
Retail traders are 85% long on GBPCAD, a strong contrarian signal.
→ Such imbalance increases the odds of a correction or reversal to the downside.
→ Confirms short bias.
📉 Price Action & RSI
Price surged into strong resistance at 1.8779 (triple top area).
Current daily rejection + RSI in overbought territory suggest a potential swing high forming.
Natural downside target: 1.8400–1.8450 (prior structure and base of the move).
→ Ideal short setup from resistance with confirmation via bearish price action.

Gold: Resistance Validated, Short at 3340-3350 Tomorrow📈 Gold Trading Recap & Tomorrow's Strategy: Resistance Holds, Short Opportunities Persist
💎 Today's newly updated live short strategy hit the TP target successfully! As mentioned earlier, when gold failed to break the support level, we anticipated it to range around 3330—today's trades were precisely centered on this logic. The 3350 resistance was also validated firmly during the session.
💎 Expect further upside in tomorrow's Asian session—recommend continuing short positions within the 3340-3350 range 🚀
🚀 Sell@3350 - 3345
🚀 TP 3335 - 3325 - 3315
Accurate signals are updated every day 📈 If you encounter any problems during trading, these signals can serve as your reliable guide 🧭 Feel free to refer to them! I sincerely hope they'll be of great help to you 🌟 👇

A temporary drop in gold is logical for an upward moveGold is in an upward trend in higher timeframes, and to form this trend, we need to reach a position where buyers step in. At this moment, a slight pullback in the 15-minute timeframe seems logical, as we are in a small descending channel. OANDA:XAUUSD

Gold Potential UpsidesHey Traders, in today's trading session we are monitoring XAUUSD for a buying opportunity around 3,300 zone, Gold is trading in an uptrend and currently is in a correction phase in which it is approaching the trend at 3,300 support and resistance area.
Trade safe, Joe.

Still bearish!If the short-term bull lifeline 3330 is lost, the trend will be bearish again. The first pressure point above is 3350-the secondary top 3345, and then the 3332-35 area. If the price bulls regain 3335 again, then the operation should be carried out in the range of 3350-3310. It is not recommended to enter the market at the halfway point because it is easy to be washed out. If the daily K line closes below 3340, then 3332-35 is the best position at present. At present, the price is bearish below 40, and it can rely on 3332-31 to continue to be bearish. The target is 3310 and 3924.

Bullish breakout for the Gold?The price is reacting off the resistance level which is a pullback resistance that aligns with the 50% Fibonacci retracement and a breakout of this level could lead the price from this level to our take profit.
Entry: 3,343.14
Why we like it:
There is a pullback resistance level that lines up with the 50% Fibonacci retracement.
Stop loss: 3,296.15
Why we like it:
There is a pullback support level.
Take profit: 3,390.77
Why we like it:
There is a pullback resistance level that aligns with the 61.8% Fibonacci retracement.
Enjoying your TradingView experience? Review us!
Please be advised that the information presented on TradingView is provided to Vantage (‘Vantage Global Limited’, ‘we’) by a third-party provider (‘Everest Fortune Group’). Please be reminded that you are solely responsible for the trading decisions on your account. There is a very high degree of risk involved in trading. Any information and/or content is intended entirely for research, educational and informational purposes only and does not constitute investment or consultation advice or investment strategy. The information is not tailored to the investment needs of any specific person and therefore does not involve a consideration of any of the investment objectives, financial situation or needs of any viewer that may receive it. Kindly also note that past performance is not a reliable indicator of future results. Actual results may differ materially from those anticipated in forward-looking or past performance statements. We assume no liability as to the accuracy or completeness of any of the information and/or content provided herein and the Company cannot be held responsible for any omission, mistake nor for any loss or damage including without limitation to any loss of profit which may arise from reliance on any information supplied by Everest Fortune Group.

XAUUSD/GOLDThe bullish trend has opened. After the retracement is confirmed, continue to buy and wait for the market to rise and fill the gap.

Gold reaches the lower support and makes a bold attemptWith the official ceasefire in the Middle East, risk aversion has returned to normal. Russia and Ukraine are now expected to return to the negotiation table. The situation that was in full swing last week has suddenly become calm. Then the focus of market attention has shifted again to the Federal Reserve's monetary policy. Federal Reserve Powell reiterated in his testimony to the Senate Committee on the semi-annual monetary policy report that there is no rush to act. The tariffs are unprecedented and it is difficult to predict the impact on inflation. Consumers may have to bear part of the tariffs. The trade agreement may make the Federal Reserve consider cutting interest rates, continuing its previous hawkish tone and suppressing the rebound in gold prices.
Gold hourly chart;
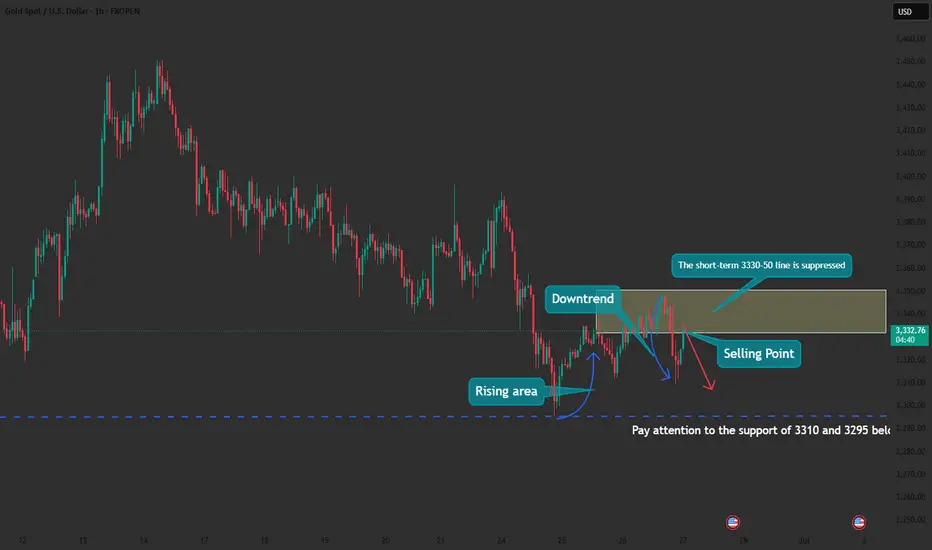
Short-term analysis of gold; The recent fluctuations of 1-200 US dollars have greatly increased the difficulty of trading for retail investors. It seems that there are many opportunities in a day, but in fact, the big market mainly appears in a few times. If you can't keep up in time, you can only watch the price jump up and down. The most feared thing is not to keep up with the market, but the price returns to the same point, but the principal is gradually reduced.
From the 4-hour analysis of gold, there are repeated resistances from the bulls before the downward break; once the downward break, the market will go further short, and pay attention to 3280 below. The upper short-term 3330-50 line is the key to suppression. Only by breaking the bulls can the rebound continue. In terms of operation, sell high and buy low, and pay attention to the breakthrough!
There are too many long orders at high levels of gold at present, and the market will not rise easily. The current international situation is so tense, and gold is still slowly declining. It is difficult to rebound sharply in this situation.
XAUUSD:Today's trading strategy
On Tuesday, the news that Trump announced a ceasefire between Iran and Israel dampened the risk aversion sentiment. Subsequently, the news that expectations of interest rate cuts had slowed down led to a further decline in gold prices. During the trading session, it once fell below the 3,300 mark. After the impact of the news weakened, it eventually rebounded to around 3,323, approaching the position where we first entered the market yesterday. Currently, there is no logic in the market. From a technical perspective, The resistance level above is at 3340-45, and the support level below is at 3305-10. We can conduct transactions around this range
Trading strategy:
SELL@3340-45
TP:3310-04
BUY@3305-10
TP:3335-40
More detailed strategies and trading will be notified here ↗↗↗
Keep updated, come to "get" ↗↗↗

GOLD ROUTE MAP UPDATEHey Everyone,
A PIPTASTIC day on the markets with our analysis playing out in true level to level fashion.
Yesterday we stated that that we had the cross and lock below 3348 opening the swing range, which was hit perfectly and gave the bounce and that we will now wait to see if the full swing is completed to 3348.
- This was played out to perfection with the full swing completed into 3348. No further lock above confirmed the rejection back into the swing range.
We will continue to buy dips using our support levels taking 20 to 40 pips. As stated before each of our level structures give 20 to 40 pip bounces, which is enough for a nice entry and exit. If you back test the levels we shared every week for the past 24 months, you can see how effectively they were used to trade with or against short/mid term swings and trends.
The swing range give bigger bounces then our weighted levels that's the difference between weighted levels and swing ranges.
BULLISH TARGET
3376 - DONE
EMA5 CROSS AND LOCK ABOVE 3376 WILL OPEN THE FOLLOWING BULLISH TARGETS
3395
EMA5 CROSS AND LOCK ABOVE 3395 WILL OPEN THE FOLLOWING BULLISH TARGET
3419
EMA5 CROSS AND LOCK ABOVE 3419 WILL OPEN THE FOLLOWING BULLISH TARGET
3440
BEARISH TARGETS
3348 - DONE
EMA5 CROSS AND LOCK BELOW 3348 WILL OPEN THE SWING RANGE
3330 - DONE
3306 - DONE
EMA5 CROSS AND LOCK BELOW 3306 WILL OPEN THE SECONDARY SWING RANGE
3288
3271
As always, we will keep you all updated with regular updates throughout the week and how we manage the active ideas and setups. Thank you all for your likes, comments and follows, we really appreciate it!
Mr Gold
GoldViewFX

Gold is sideways. Is a new trend brewing?Information summary:
On June 23, Trump announced that Iran and Israel reached a comprehensive ceasefire, but the asymmetric terms of the agreement caused the conflict to continue. Israel launched another air strike on Iran, and Israel threatened to kill Iranian senior officials. The uncertainty of geopolitical risks continues to support gold prices.
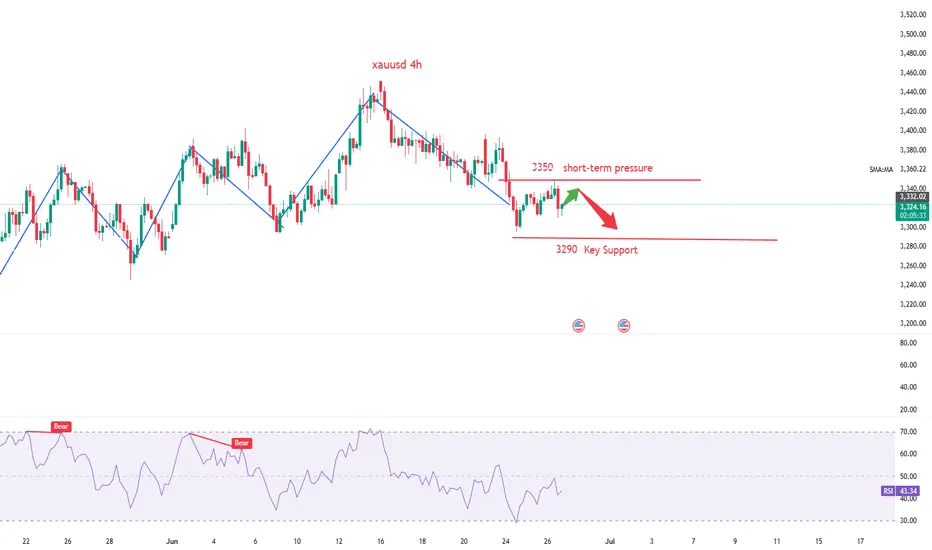
Market analysis:
From the 4-hour chart, the MA5-day and 10-day moving averages show signs of upward divergence, and the K-line stands firm on the moving average support and fluctuates upward. In the short term, pay attention to the breakthrough and decline of the 3350 pressure level. The current market's downward momentum has weakened, and the overall market remains volatile. We need to be wary of the risk of short-term adjustments after continuous surges. Be alert to the short-term adjustment risks after continuous highs.
Operation strategy:
Short near the price rebound of 3345, stop loss 3355, profit range: 3330-3320.

Gold rebounds under pressure, continue to go short.In the early morning, gold directly continued its bullish correction pattern. In the European session, it reached around 3336 at the highest, then continued to pull back in the US session, hitting around 3312 at the lowest and temporarily stopping there. It showed the intention to start a second rebound correction and closed at 3332. Opening at 3333, it rebounded and has oscillated near the highest of 3340 so far. The upper resistance to pay attention to is at 3342-48. If it fails to rebound, break through and stand firm above, the gold bears still have room for a pullback. The recent market trend is basically consistent - bottoming out and rebounding. In operation, continue to maintain the strategy of shorting when under pressure.
you are currently struggling with losses,or are unsure which of the numerous trading strategies to follow,You have the option to join our VIP program. I will assist you and provide you with accurate trading signals, enabling you to navigate the financial markets with greater confidence and potentially achieve optimal trading results.
Trading Strategy:
sell@3335-3340
TP:3300-3295
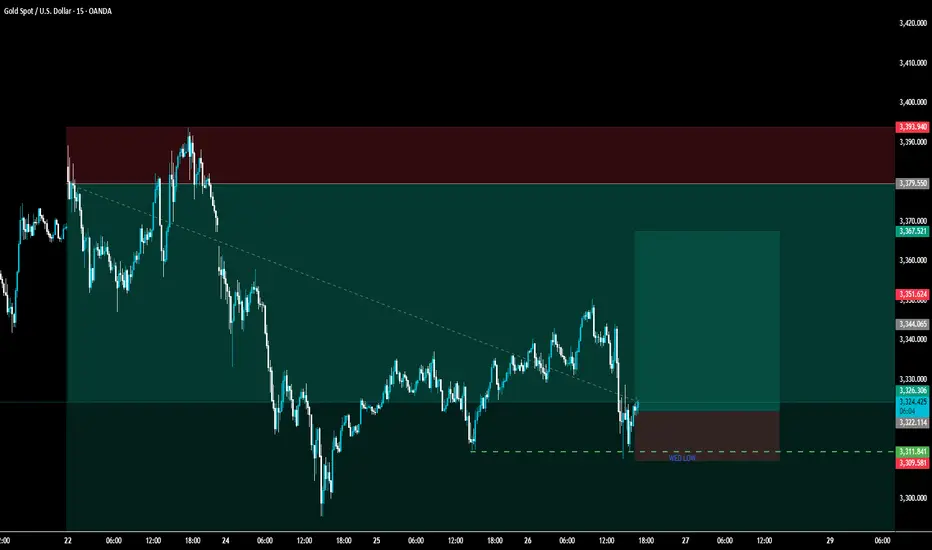
GOLD LONGSwept Wednesday low and internal liquidity. rejection on HTF targeting old highs and gap before the big drop to the downside
Gold fluctuates at high levels, intraday trading points📰 Impact of news:
1. Initial unemployment claims data
📈 Market analysis:
Gold has begun to show signs of bottoming out in the short term in the past two days. Since the daily line bottomed out and pulled up, the daily line closed positive yesterday, and the bulls began to counterattack, and the 1H low was rising. If it doesn't fall further in the short term, it will most likely bottom out and rebound. The upper pressure is at the Bollinger middle track of 3355, which is also the high point of Tuesday's decline. If gold breaks and stabilizes at this price, it will have a larger upward space, and the upper side will look at 3385. In the 4H chart, MACD temporarily forms a golden cross, which is a bullish signal; but the BOLL track pressure is still there, and gold bears still have momentum in the short term. Therefore, on the whole, in the short term, gold should pay attention to the 3350-3360 resistance above. If it encounters resistance under pressure here, it can consider shorting. Pay attention to the 3330-3320 support area below.
🏅 Trading strategies:
SELL 3350-3360
TP 3340-3330-3320
BUY 3330-3320
TP 3340-3350
If you agree with this view, or have a better idea, please leave a message in the comment area. I look forward to hearing different voices.
TVC:GOLD FXOPEN:XAUUSD FOREXCOM:XAUUSD FX:XAUUSD OANDA:XAUUSD

Gold Pullback Into Demand – Is Another Bullish Leg Coming?By analyzing the gold chart on the 4-hour timeframe, we can see that, as expected, price began to rise from the $3323 area and reached up to $3350. After this move, gold experienced a minor correction down to $3310, which aligns with a key demand zone.
Currently, gold is trading around $3322, and if price holds above $3313, we can expect another bullish move with $3333 as the first target and $3350 as the second.
This outlook will be invalidated if price closes below $3309.
Please support me with your likes and comments to motivate me to share more analysis with you and share your opinion about the possible trend of this chart with me !
Best Regards , Arman Shaban

Can we still go long if the decline of gold intensifies?
📊Comment Analysis
Looking back at today's trend, it rose to a high of 3350, and then continued to retreat. The current low is 3310. At present, due to the upward trend line broken by the hourly line, many orders can only be short. The trend is still biased to the short side, and the current market risk aversion does not facilitate the longs. But first of all, one thing can be confirmed that this round of gold decline lasted for a long time, which also enhanced the execution of gold to go long near 3310-3320 in the future.
Since gold has fluctuated greatly in the past two days, it means that the end point of emotions will not disappear so easily for the time being. In the short-term K-line pattern, continuous short-side artillery should not be constantly changed and increased. It is necessary to stop and see appropriately. The early trading is relatively difficult to grasp, but at least the current market has given some signals, so I hope that when the market is in place, your execution will be strong enough, and then you can look at gold according to the trading signals I gave. The rehearsal is definitely exciting enough, but the actual operation is not that simple!
💰Strategy Package
Gold: Pay attention to the low-long opportunities of 3310-3220 in the US market, and defend at the 3300 line. If the retracement continues, go long directly. Otherwise, the upper resistance will be around 3345!
⭐️ Note: Labaron hopes that traders can properly manage their funds
- Choose the number of lots that matches your funds

Is Gold Setting a Trap for Traders?Gold is currently retesting the FVG zone around 3,392 after breaking below a key trendline — a classic sell-trigger area if price gets rejected.
Bearish momentum is supported by:
U.S. jobless claims: 244K < 245K forecast → Stronger USD
Iran–Israel ceasefire → Reduced demand for safe-haven assets
If price fails to break above 3,392, the next downside target is the 3,299 support zone.
Trade idea: Watch for a rejection around 3,390–3,392 to consider short positions.
Bearish bias remains valid as long as price stays below 3,392.

#XAUUSD #GOLD 30Min 📉📈 #XAUUSD 30m Analysis – Dual Setup Scenario
We’re monitoring two potential trade setups depending on how price reacts at key levels:
🔴 Sell Setup:
Price is entering a Sell-Side Order Block Zone between 3350–3360, aligned with a Fair Value Gap (FVG). This premium zone is likely to act as strong resistance, with potential rejection targeting downside liquidity near 3310 — an ideal area for short positions.
🟢 Buy Setup:
If price sweeps below and taps into the Liquidity Zone / Demand Area around 3305–3311, we’ll watch for a bullish reversal from this discount zone. This area offers a favorable setup for long entries, aligning with institutional buying levels.
📌 Be sure to mark these key zones on your chart for enhanced clarity and execution.
💬 What’s your outlook on Gold? Share your thoughts below 👇

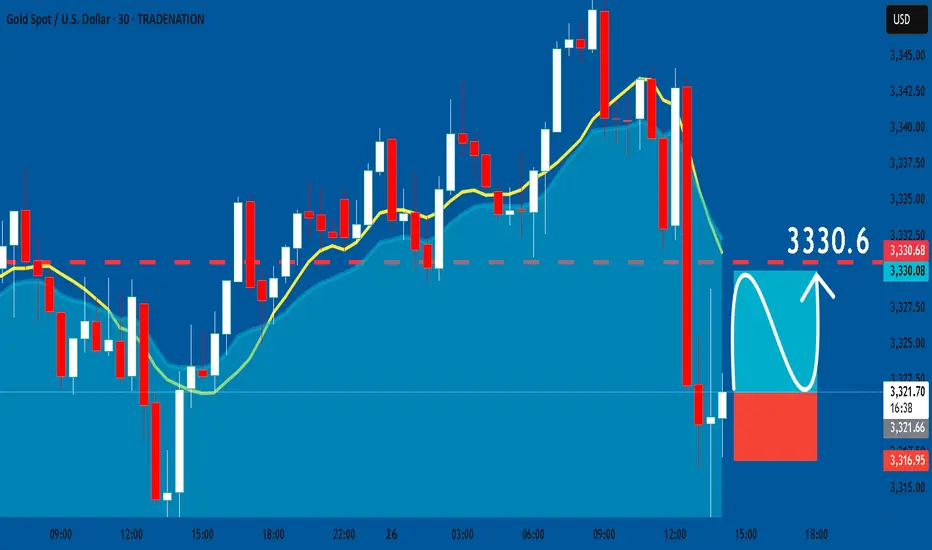
GOLD: Long Trade with Entry/SL/TP
GOLD
- Classic bullish setup
- Our team expects bullish continuation
SUGGESTED TRADE:
Swing Trade
Long GOLD
Entry Point - 3321.6
Stop Loss - 3316.9
Take Profit - 3330.6
Our Risk - 1%
Start protection of your profits from lower levels
Disclosure: I am part of Trade Nation's Influencer program and receive a monthly fee for using their TradingView charts in my analysis.
❤️ Please, support our work with like & comment! ❤️
XAUUSD:Short sell at 3340-45
Today's trading needs to narrow down the range. There are signs that the center of gravity below is gradually moving upward. During the Asian session, the highest point reached around 3343. Friends who have already bought short positions here can wait for 3320-25 to take profits and exit. Those who haven't bought can wait for 3340-45 to short, with the target also being 3320-25
Trading strategy:
SELL@3340-45
TP:3320-25
It can be considered to go long when it reaches around 3320-25
More detailed strategies and trading will be notified here ↗↗↗
Keep updated, come to "get" ↗↗↗
