Escalating U.S. Debt Crisis Coupled with Weaker U.S. DollarPowell Unleashes Rare Dovish Signal, Gold Rebounds to $3,330
In yesterday's speech, Powell remarkably signaled policy easing, explicitly stating the Fed "will take appropriate actions to sustain economic expansion," driving gold's short-term rebound to the $3,330 threshold. Technically, gold is now locked in a strong consolidation range of $3,300–$3,350, with the Bollinger Bands midline at $3,325 emerging as the focal point of long-short battles.
The U.S. Dollar Index hit a new low today, while the U.S. debt crisis is set to raise the borrowing ceiling again—both tailwinds for gold's upward momentum.
Trading Strategy Recommendations:
- Short at Resistance: Enter light short positions between $3,345–$3,350, set stop-loss at $3,360, and target a pullback to $3,320.
- Long at Support: Initiate staggered long positions in the $3,310–$3,300 support zone, set stop-loss at $3,290, and target a rally to $3,340–$3,345.
- Volatility Trading: Exploit range-bound movements around the $3,330 midline, aiming for 8–12 dollar profits per trade.
Market Note: With the dollar weakening and debt ceiling tensions resurfacing, gold's safe-haven appeal is reinforced. Maintain position sizes below 5% and strictly enforce $15 stop-loss orders to navigate news-driven volatility.
I am committed to sharing trading signals every day. Among them, real-time signals will be flexibly pushed according to market dynamics. All the signals sent out last week accurately matched the market trends, helping numerous traders achieve substantial profits. Regardless of your previous investment performance, I believe that with the support of my professional strategies and timely signals, I will surely be able to assist you in breaking through investment bottlenecks and achieving new breakthroughs in the trading field.
Xauusd(w)

XAU/USD – Smart Money Building Toward $3360? |26 June 2025Gold (XAU/USD) is pushing into fresh highs around $3337, and we may be approaching a key inflection point. But beneath the surface of candles and wicks lies the real story — one written by liquidity, displacement, and smart money positioning.
This outlook breaks down gold’s price action using Smart Money Concepts (SMC), price structure, and Fibonacci confluence, to help identify the most probable high-value trade zones for both swing and intraday traders.
4H Outlook – Institutional Flow & Structure
Market Structure
Gold recently broke above the $3310–$3320 resistance, confirming a bullish Break of Structure (BOS). This keeps the market in a sequence of higher highs and higher lows, validating continued bullish pressure.
Smart Money Insights
BOS: Clean break above $3320 signals strength.
CHoCH: None yet — trend remains bullish.
Liquidity Sweep: Sell stops below $3295 have already been taken.
Buy-Side Liquidity: Sits above $3350 — price may gravitate there next.
FVG: Unfilled Fair Value Gap between $3314–$3322 — possible retracement zone.
Bullish OB: Identified between $3300–$3310, aligned with FVG and BOS level.
Equilibrium: Using $3275 (swing low) and $3342 (swing high), the midpoint sits near $3308, acting as fair re-entry value.
Key Zones
Buy Zone (Demand): $3295–$3310 — OB + FVG + Fib confluence.
Sell Zone (Supply): $3350–$3360 — next likely liquidity target.
Bias Summary
As long as price remains above $3295, the bullish structure stays valid. Watch for a retracement into $3308–$3316 for potential continuation toward $3350–$3360. Price may briefly dip below $3310 to trigger liquidity before moving higher.
1H View – Precision Entries
Structure
Following the high at $3342, price has pulled back slightly and is forming what appears to be a bullish flag — often a continuation pattern.
Smart Money Zones (1H)
FVG: $3315–$3322 — potential short-term reaction zone.
Order Block: $3305–$3312 — 1H bullish OB aligned with 4H bias.
Sell-side Liquidity: Swept at $3295 earlier this week — supports continuation.
Trade Setups
Long Setup #1 – Optimal Entry
Entry: $3308–$3315
Stop: Below $3295
TP: $3342 (partial), $3350–$3360 (full)
Why: Strong zone combining FVG, OB, and Fib support.
Long Setup #2 – Aggressive Entry
Entry: $3316–$3320
Stop: $3300
TP: $3340–$3350
Why: Quicker entry inside the imbalance — riskier but valid.
Short Setup – Countertrend (Low Conviction)
Only valid on a clear break below $3310 + CHoCH
Entry: Below $3310 (confirmed)
Target: $3295
Note: Lower confidence unless 1H structure turns bearish.
Final Notes
The bias remains bullish above $3301–$3308. This is a high-probability area to look for long setups on retracement. Avoid shorts unless we see a confirmed structural shift with a CHoCH and OB breakdown.
Expect the market to potentially hunt stops below $3310, then aim for liquidity sitting above $3350–$3360.

Elliott Wave Analysis – XAUUSD Plan for June 26, 2025
🌀 Wave Structure
On the H1 chart, our previous plan anticipated price movement within green wave 3. However, the current price action lacks the sharp, impulsive characteristics typically seen in wave 3. Instead, the overlapping structure of minor waves suggests that we may not be in wave 3. This leads us to consider two primary scenarios:
🔹 Scenario 1 – abc Correction (black):
Price may be forming wave c (black). However, due to the overlapping nature of recent price moves, it is likely that wave c is developing as an ending diagonal (wedge).
➡️ Confirmation signal: A sharp, steep decline that breaks below the 3297 level would signal that wave c has completed.
🎯 Target zone for wave c: 3352 – 3356
🔹 Scenario 2 – Leading Diagonal in Wave 1:
The overlapping price structure could also be forming a leading diagonal (3-3-3-3-3) as wave 1. In this case, price is currently in wave 3 or 4 of this formation.
➡️ Once wave 1 completes, we expect a retracement to the 0.618 Fibonacci level of the entire wave 1 – forming wave 2.
🎯 Target zone for the end of wave 1: 3352 – 3356
📉 Momentum Analysis
Momentum plays a crucial role in determining which wave structure is unfolding.
D1 Timeframe: Momentum is turning upward from the oversold zone – indicating that the downtrend may be ending. This supports the scenario of a leading diagonal wave 1 and suggests we may see a sustained bullish move over the next 5 days.
H4 Timeframe: Momentum is preparing to reverse downward from the overbought zone. This is a key signal to monitor today, especially during tonight’s news events.
If price continues to move sideways within a wedge, it would support the leading diagonal scenario.
If price breaks down sharply, it would favor the abc correction scenario.
🧭 Trade Plan
🔻 Sell Zone: 3352 – 3355
⛔️ Stop Loss: 3362
🎯 Take Profit 1: 3333
🎯 Take Profit 2: 3323
📌 The market’s behavior during the U.S. session tonight will be critical in confirming the wave structure. Stay alert and ready to adjust the trade plan accordingly.

GOLD recovers from around $3,300 area, short-term targetsOANDA:XAUUSD has recovered slightly and is currently trading around $3,332/oz, supported by a decline in the US dollar and US bond yields. The market is closely watching the fragile ceasefire between Israel and Iran.
The US Dollar Index TVC:DXY is near a one-week low, making dollar-priced gold more attractive to holders of other currencies. The benchmark 10-year US Treasury yield is holding near its lowest in more than a month.
As the conflict between Israel and Iran ends, geopolitical risk levels have disappeared, safe-haven funds have flowed back and thus gold is under pressure.
From a more macro perspective, gold remains in an uptrend and real yields are expected to fall further amid continued Fed easing. In the short term, if the market reprices rate cut expectations to become hawkish, this could trigger a technical correction in gold.
Economic data in the coming months will be particularly important for the gold market. If inflation data remains weak or the labor market deteriorates further, Fed officials could cut rates sooner or more significantly than expected.
A ceasefire between Iran and Israel brokered by U.S. President Donald Trump appeared to have taken effect on Wednesday, a day after both countries signaled a temporary end to their conflicting air strikes.
WASHINGTON (Reuters) - U.S. consumer confidence unexpectedly fell in June, reflecting growing concerns among households about job prospects and another sign of a weakening labor market amid uncertainty over Trump’s tariffs.
Federal Reserve Chairman Jerome Powell told Congress on Tuesday that higher tariffs could start to push up inflation this summer, a key period when the Fed considers whether to cut interest rates.
Traders of federal funds futures are currently pricing in a cumulative 60 basis points of rate cuts through 2025, with the first cut likely to come in September.
Technical Outlook Analysis OANDA:XAUUSD
Gold has recovered slightly after testing the important support area noted by readers in yesterday's edition, around the raw price point of $3,300. However, the temporary recovery is being limited by the EMA21 moving average, followed by the 0.236% Fibonacci retracement level, which can also be considered as upside targets for the time being.
In terms of overall structure, gold is still in an uptrend with the price channel as the main trend. On the other hand, RSI is also hovering around 50, indicating that the market sentiment is still hesitant and does not have enough momentum for a complete trend.
Intraday, gold still has a bullish technical outlook, but a sell-off that takes gold below the 0.382% Fibonacci retracement level would be a bearish signal in the near term. Therefore, long positions should be opened near the $3,300 area, with protective levels behind the 0.382% Fibonacci retracement.
Notable positions will also be listed as follows.
Support: $3,320 – $3,300 – $3,292
Resistance: $3,350 – $3,371
SELL XAUUSD PRICE 3367 - 3365⚡️
↠↠ Stop Loss 3371
→Take Profit 1 3359
↨
→Take Profit 2 3353
BUY XAUUSD PRICE 3301 - 3303⚡️
↠↠ Stop Loss 3297
→Take Profit 1 3309
↨
→Take Profit 2 3315
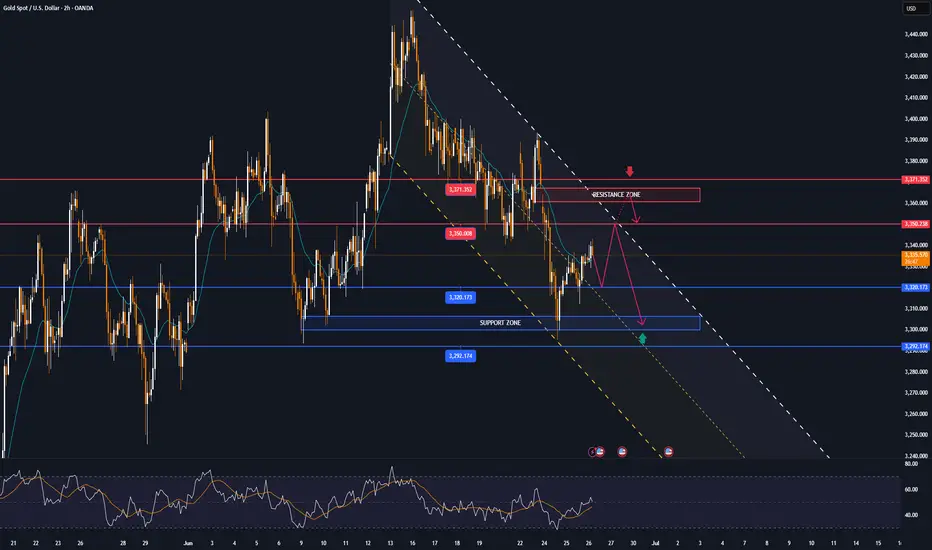
Trading Strategy (XAUUSD) – June 25, 2025 After a sharp decline in the previous session, XAUUSD has shown a mild recovery and is currently trading around 3,332 USD. However, price action suggests this could merely be a pullback within a broader downtrend, as gold has yet to break above the key resistance zone.
Technical Analysis
Price Action
Gold has bounced from the support zone between 3,291 – 3,317 USD, which has historically acted as a strong demand area. This zone also aligns with the Fibonacci 0.382 retracement from the previous bullish leg.
However, XAUUSD remains below the key resistance zone at 3,373 – 3,392 USD, which is a confluence of:
- The Fibonacci 0.618 retracement from the most recent downtrend
- A historical supply zone that has been rejected multiple times
- The upper boundary of the sideways range formed since May
- If price fails to break through this zone in the coming sessions, the risk of continued downside remains high.
RSI Indicator
- The RSI (14) is currently hovering around the neutral zone (49–54), indicating that the rebound lacks the strength needed to confirm a trend reversal.
- The RSI has not crossed above the 55 threshold, suggesting the dominant trend is still bearish.
Key Technical Levels to Watch
Resistance:
- 3,373 – 3,392 USD: Confluent resistance zone (Fibonacci 0.618 + prior supply zone)
- 3,435 – 3,452 USD: Major swing high, a key medium-term reference level
Support:
- 3,291 – 3,317 USD: Immediate support zone, still holding strong
- 3,250 – 3,224 USD: Potential downside target if the bearish momentum resumes
Suggested Trade Setups
Scenario 1 – Buy if price holds above 3,291 and shows confirmation signals
Entry: 3,295 – 3,300 USD
Stop-loss: Below 3,289 USD
Take-profit: 3,340 – 3,355 – 3,370 USD
Conditions: Must show clear bullish reversal patterns (Pin Bar, Bullish Engulfing) on H1 or H4 timeframe
Scenario 2 – Sell if price rejects from resistance zone with confirmation candle
Entry: 3,370 – 3,375 USD
Stop-loss: Above 3,392 USD
Take-profit: 3,330 – 3,310 – 3,290 USD
Conditions: Clear bearish rejection candle + declining volume
Note: XAUUSD is currently in a technical rebound phase after a strong drop but lacks solid reversal confirmation. Traders should closely monitor the price reaction near the 3,373 – 3,392 USD resistance zone over the next sessions. This area will determine whether the downtrend will resume or a reversal begins.
Stay tuned for more daily trading strategies, and make sure to save this analysis if you find it helpful for your trading plan.
Strategy analysis by @Henrybillion

XAU/USD - Channel Breakout (26.06.2025)The XAU/USD pair on the M30 timeframe presents a Potential Buying Opportunity due to a recent Formation of a Channel Breakout Pattern. This suggests a shift in momentum towards the upside and a higher likelihood of further advances in the coming hours.
Possible Long Trade:
Entry: Consider Entering A Long Position around Trendline Of The Pattern.
Target Levels:
1st Resistance – 3385
2nd Resistance – 3410
🎁 Please hit the like button and
🎁 Leave a comment to support for My Post !
Your likes and comments are incredibly motivating and will encourage me to share more analysis with you.
Best Regards, KABHI_TA_TRADING
Thank you.
Disclosure: I am part of Trade Nation's Influencer program and receive a monthly fee for using their TradingView charts in my analysis.

Gold Peaked, Deep Analysis: MACD & RSI, Targets: $3,131 & $2,904Gold (XAUUSD) already peaked. The 22 Apr session was a clear top signal. A very strong one at that. The chart is showing a lower (red arrows) and overall distribution channel. Trading volume continues to drop. Bearish volume is predominant.
Gold produced a strong rally, it lasted 159 days. Total growth amounts to +39% from bottom to top, starting November 2024, end April 2025.
It's been 64 days since the all-time high. No new highs, no bullish momentum. Geopolitical factors that would push Gold to new all-time highs, a war, did show up recently, a surprise event and yet Gold's price failed to move higher. This is a warning signal.
The RSI is weak now. Gold is trading very high, a very strong price but with a risk RSI. This is another warning signal, a strong one. Bullish would be the contrary, low price with a strong RSI. A weak RSI at this point can be interpreted as the bullish force being exhausted.
The daily MACD is pretty bad. Trending fully down with no possibility of anything bullish. Here is the chart.
This is a friendly reminder. Switch to Crypto.
You've been warned.
Namaste.

Gold Short Term OutlookYesterday, we noted that gold needed to close and hold above the $3,330 resistance to open the path toward $3,346 and potentially $3,375.
Since then, price rejected the intraday support and is now trending above the $3,330 level.
Currently, the 50MA is acting as dynamic resistance. A clean break above it could trigger a move toward $3,346 and possibly higher resistance zones.
However, if bullish momentum fades, price may drop back toward the key support area, where buyers could look to step in again.
🔑 Key Levels:
Resistance:
$3,330 • $3,346 • $3,361 • $3,375
Support:
$3,306 • $3,287 • $3,271 • $3,242

XAUUSD – Sniper Entry Plan June 26, 2025👋 Hello traders,
Gold is currently consolidating after recent downside liquidity sweeps, and Thursday brings high-impact USD catalysts. Let’s break it down and build a precise plan for sniper entries around these volatile zones. We’re trading structure, not noise — eyes on the prize. 🎯
🔸 HTF Outlook (D1 → H4 → H1)
🌐 Macro & Geopolitical Context
Markets are bracing for:
USD Unemployment Claims (Forecast: 244K, previous: 245K)
Final GDP q/q and Durable Goods Orders
Fed speakers (Barkin, Barr, Harker)
Stronger-than-expected data could reinforce USD bullish sentiment, sending gold down. Weaker reports + dovish Fed = bullish pressure on gold.
🗺️ Daily Bias: Neutral to Bullish
Price is ranging above a key CHoCH low + Daily OB (3272–3288)
Strong bullish continuation only confirmed with a break above 3370–3384
FIBO: 50% retracement of the last swing is near 3310, giving structure to Buy Zone 1
Bias: Bullish as long as 3272 holds — PA supports HL structure above imbalance
🕓 H4 Bias: Bearish Pullback
CHoCH at 3384 → clean Lower High + price failed to close above premium FVG
Pullback testing EMA 50/100 + FVG at 3345
FIBO extension zone at 161.8% aligns near 3288 = reactive downside target
Bias: Reactive bearish under 3352. If 3370 breaks cleanly → short invalid.
🕐 H1 Bias: Bullish Short-Term
CHoCH → HL printed at 3310 → higher lows forming toward supply
EMA 21/50 crossed to the upside, RSI mid-range (50–60)
PA structure showing ascending triangle under resistance
Bias: Bullish continuation valid toward 3352–3370, unless breakdown under 3308
🔸 LTF Precision (M30 → M15)
🔹 Sell Zone 1 – 3352–3345
H1 OB + M15 FVG + upper range sweep
RSI expected to peak near 70 → potential divergence
FIBO: 78.6% retracement of previous bearish leg
PA: Watch for M15 liquidity sweep + bearish engulfing
🔸 Entry: Wait for break/retest → confirmation on M5–M15 BOS
🔹 Sell Zone 2 – 3370–3384
HTF premium imbalance zone + weak high above
RSI likely in exhaustion zone
FIBO extension 1.272–1.618 completes inside this supply
PA: Only enter after stop hunt wick + clear CHoCH (M5)
🔸 Entry: Reactive fade after liquidity trap
🔸 Buy Zone 1 – 3308–3313
H1 CHoCH + OB + EQ zone
RSI bounce zone (30–40)
FIBO 50–61.8% retracement of bullish swing
PA: Watch for M15 bullish engulfing or double bottom formation
🔸 Entry: Only on structure break + retest confirmation
🔸 Buy Zone 2 – 3288–3272
Daily OB + HTF FVG + massive imbalance
RSI expected to overshoot under 30
FIBO: 1.618 extension from previous M15 bullish leg
PA: High-RR reversal zone if flushed by NY open
🔸 Entry: Enter only after M5 CHoCH or strong engulfing near the OB
⚖️ Decision Zone – 3333–3336
Previous supply turned EQ zone
PA shows indecision — do not enter here
Useful for monitoring if price holds support or rejects
🔸 Trade Scenarios
🟢 Bullish Scenario
If USD data is weak:
Flush to 3308 or 3288
Confirm HL formation → sniper buy from OB → aim 3345+, possibly 3370 sweep
🔴 Bearish Scenario
If USD prints strong:
Price spikes into 3352 or 3370 zones → rejection + BOS
Sniper short entry → targets 3310 → 3288
🔸 Final Plan & Action Points
✅ Patience is key during news. Let structure confirm.
✅ Track price behavior near 14:30 CEST, avoid instant spikes.
✅ Best sniper RR zones:
🔹 Sell from 3352 or 3370
🔸 Buy from 3308 or 3288
📊 Precision matters. Structure wins.
👍 Like this if it helped you map the move, and 🔔 follow for tomorrow’s sniper entry.
— GoldFxMinds
Disclosure: I am part of TradeNation's Influencer program and receive a monthly fee for using their TradingView charts in my analyses and educational articles.

USD under pressure ahead of PCE—gold holds $3,300The euro has reached its highest level since October 2021, driven in part by commitments from European leaders to increase NATO defence spending.
The swing factor for the euro dollar in the shorter term is the possibility of US rate cuts. Critical for this will be US inflation data, starting with tomorrow's PCE report. If tariffs fail to significantly lift inflation, the case for a July rate cut strengthens—adding further pressure on the dollar.
That weakness is also supporting gold. XAUUSD is above $3,300. Recent price action has formed a potential symmetrical triangle on the daily chart—a structure that can precede a breakout. A move above $3,400 could signal renewed bullish momentum.

BULLS HOLDING KEY PIVOT 〉ATH AROUND THE CORNER As illustrated, Im trying to visualize what a potential bull run could look like starting from what seems to be a "bullish signature" move by gold: a diagonal double bottom.
Don't believe me; go back in time and study how gold makes bottoms and how new bull runs start. The fact that it was NY that manipulated BOTH times and got the best price, is a strong footprint that MIGHT just indicate a potential bottom (at least of this current bearish correction.
I won't say "this is it" and ATH are next FROM this potential rebound; HOWEVER, it could indicate at least the next 10 to 24 hours of potential bullish impulse to retest a degree of the bearish drop since Sunday's weekly open.
Hammer candle from Tuesday's NY session low + today's 4H bullish engulfing, are also powerful components that show bullish strength indicating 3300 to be a major support area.
I'm expecting (BUT NOT ADVISING) Asia to break aggressively to the upside confirming that this could have been this current correction's bottom, and/or at least this week's low.
Should Thursday close above Tuesday's high or consolidating near it, also shows signs of bullish strength and opens the door for Friday to make a second bullish impulse move.
This would reflect on the Weekly candle leaving a long rejection wick and closing (potentially) back above 3350 - 3360.
Should this be the case, the following week would have the road paved to lift off price to retest previous 4H highs of 3440 - 3450 range.
...
July is a bullish month historically. Don't believe me; search "seasonality tool, gold" and see it for yourself.
It is a matter of weeks for Gold to breakout of this wide accumulation phase it has been since end of April, and start a fresh and brand new bull run that could/should last until the end of the year.
-
GOOD LUCK
Persa

BTC continues to short at high levels during the day📰 Impact of news:
1. Geopolitical impact
📈 Market analysis:
BTC has reached an intraday high of 108,125, just one step away from the all-time high of 112,000. With the increase in trading volume and institutional sentiment turning bullish, the momentum seems to be in the bulls' favor. In addition to institutional buying, the ceasefire agreement in the Iran-Israel war is also an important factor in Bitcoin's sharp rebound. Trump's announcement of the end of the war almost immediately triggered a surge in the cryptocurrency market. However, the overall pattern has not changed, and the range resistance has not been broken, so we still keep the idea of shorting at high levels.
🏅 Trading strategies:
SELL 108000-107500
TP 104500-103500
If you agree with this view, or have a better idea, please leave a message in the comment area. I look forward to hearing different voices.

XAUUSD: Trend changed to bearish. Significant downside potentialGold turned neutral again on its 1D technical outlook (RSI = 49.253, MACD = 18.142, ADX = 16.679) as it crossed below both the 4H MA200 and 1D MA50. The two form a Bearish Cross. Technically a Channel Down has emerged, no different than those that emerged after rejections on the R1 Zone (like now). As long as the 4H MA50 acts as a Resistance and holds, we will be bearish, aiming at the S1 level (TP = 3,245).
## If you like our free content follow our profile to get more daily ideas. ##
## Comments and likes are greatly appreciated. ##

Continue to short gold!Gold prices rose modestly on Wednesday, mainly benefiting from the US dollar index hovering at a one-week low and the low US bond yields, which boosted the purchasing power of non-dollar investors. The market is closely watching the situation in the Middle East, and the fragile ceasefire between Israel and Iran is still uncertain. However, as the conflict between the two sides has temporarily eased, the geopolitical risk premium that had previously pushed up gold has gradually dissipated, and safe-haven funds have continued to flow out of the gold market, limiting the room for gold prices to rebound.
Technically, gold closed with a big negative line on the daily line, recording the seventh consecutive week of decline, which significantly undermined the recent bullish pattern. The current market sentiment is clearly bearish. After the sharp drop last night, there may be a technical adjustment today, but the 3347-level high point above has become a key resistance. If it cannot be broken, the short-term pressure situation will remain unchanged. The downward support focuses on the 3300-level area. If it is lost, it may further test the previous low of 3290, or even fall to the important turning point of 3274. Overall, the decline of the US dollar brings short-term respite, but the technical selling pressure and the fading of risk aversion continue to suppress the rebound momentum of gold. It is expected to maintain a weak and volatile trend in the short term.

XAU/USD: Long-Short Battle at $3,300 ThresholdAccurate Verification of Middle East Situation Analysis
Yesterday's morning strategy focused on analyzing the authenticity of the Middle East ceasefire agreement. By deconstructing the policy logic and strategic intent behind Trump's statement, we accurately predicted that the "Israel-Iran ceasefire" had not reached an official consensus. Although logical analysis confirmed doubts about the news, gold prices still broke below the psychological integer threshold of $3,300 driven by market sentiment, highlighting the irrational feature of "emotion dominating facts" in the current market.
Escalating Trade War Risks Intensify Market Volatility
While the Middle East conflict remains unresolved, the EU issued an official statement last night, clearly stating it will launch retaliatory tariffs to force the U.S. to reach more favorable trade agreements. This move marks a further escalation of transatlantic trade friction, and market concerns about global economic growth may resurface.
Three Key Events to Monitor Closely
Gold prices are currently in a long-short stalemate at the $3,300 threshold, with the following events set to determine the short-term trend:
1.Signals of Fed Policy Pivot
Focus on the degree of rate cut expectations released in Powell's speech. A dovish signal will strengthen gold's safe-haven appeal.
2.Progress of EU-U.S. Tariff Game
Whether the EU substantially initiates counter-tariffs directly affects market assessments of global trade system stability.
3.The Legislative Process of the One Big Beautiful Bill
If the act passes smoothly this week, it may reconstruct North American trade rules—be vigilant against sudden policy shocks.
Short-Term Market Outlook
Before the above events materialize, gold is likely to oscillate within the range of $3,280-$3,350. Traders are advised to adopt a "buy low, sell high" range strategy:
- Light short positions can be taken at the upper resistance of $3,350 with a stop-loss at $3,370.
- Long positions can be initiated at the lower support of $3,280, targeting $3,320.
Note: The current market is significantly driven by news. All operations must strictly set stop-loss orders, with position sizes controlled within 15%.
I am committed to sharing trading signals every day. Among them, real-time signals will be flexibly pushed according to market dynamics. All the signals sent out last week accurately matched the market trends, helping numerous traders achieve substantial profits. Regardless of your previous investment performance, I believe that with the support of my professional strategies and timely signals, I will surely be able to assist you in breaking through investment bottlenecks and achieving new breakthroughs in the trading field.

Nasdaq All-Time Highs, S&P Close, Blast Off or Breakdown?What an incredible melt-up since April 7 lows in the US markets.
Trump vs Musk - ignored
Iran vs Israel - ignored
High Valuations - ignored
FED Pausing - ignored
The US economy is resilient and it's a good thing because the world is performing really well (EX-US). Europe/China/India/Emerging Markets are outperforming the US by 15-16% YTD
The USD is having one its worst years ever in 2025
Gold, Silver, Bitcoin are great diversifiers in my opinion for 2025
Oil prices are incredibly volatile and energy stocks and commodities in turn are showing
volatility and big swings
As we near end of month and end of Q2, I have to believe the market is due for a small pause or pullback sooner rather than later - but we'll see
Thanks for watching!!!

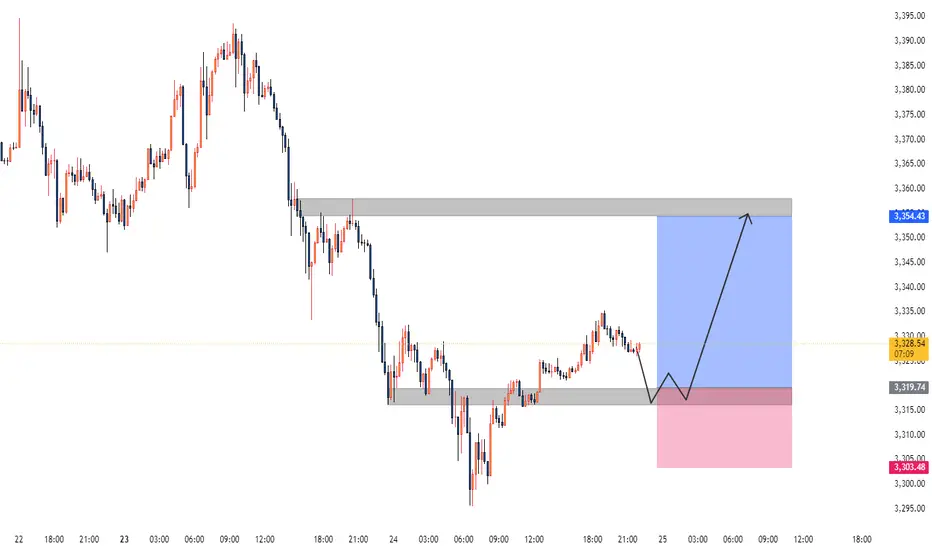
Gold XAUUSD Analysis 25.06.2025The Gold shows with a recent upward trend following a period of consolidation and a dip. Key observations:
The price previously fluctuated between a support level around 3,310-3,319 and a resistance near 3,354.
The current price is consolidating near the recent high, suggesting potential for further upward movement or a pullback.
Signal:
Buy signal is present in the range of 3,316-3,319, aligning with the support level, offering a good entry point for a potential upward move.
GOLD ROUTE MAP UPDATEHey Everyone,
Another smashing day on the charts with our levels being respected perfectly inline with our plans to buy dips.
After completing our bearish 3348 and bullish 3376 target we had the cross and lock above 3376 leaving a gap to 3395, which fell short just by few pips.
We then had the cross and lock below 3348 opening the swing range, which was also hit perfectly. We got the perfect bounce, just like we analysed allowing us to buy dips and now seeing the swing range carry out the move. We will see if this is completed for the full swing range 3348.
We will keep the above in mind when taking buys from dips. Our updated levels and weighted levels will allow us to track the movement down and then catch bounces up.
We will continue to buy dips using our support levels taking 20 to 40 pips. As stated before each of our level structures give 20 to 40 pip bounces, which is enough for a nice entry and exit. If you back test the levels we shared every week for the past 24 months, you can see how effectively they were used to trade with or against short/mid term swings and trends.
The swing range give bigger bounces then our weighted levels that's the difference between weighted levels and swing ranges.
BULLISH TARGET
3376 - DONE
EMA5 CROSS AND LOCK ABOVE 3376 WILL OPEN THE FOLLOWING BULLISH TARGETS
3395
EMA5 CROSS AND LOCK ABOVE 3395 WILL OPEN THE FOLLOWING BULLISH TARGET
3419
EMA5 CROSS AND LOCK ABOVE 3419 WILL OPEN THE FOLLOWING BULLISH TARGET
3440
BEARISH TARGETS
3348 - DONE
EMA5 CROSS AND LOCK BELOW 3348 WILL OPEN THE SWING RANGE
3330 - DONE
3306 - DONE
EMA5 CROSS AND LOCK BELOW 3306 WILL OPEN THE SECONDARY SWING RANGE
3288
3271
As always, we will keep you all updated with regular updates throughout the week and how we manage the active ideas and setups. Thank you all for your likes, comments and follows, we really appreciate it!
Mr Gold
GoldViewFX

Elliott Wave Analysis – XAUUSD Plan for June 25, 2025🌀 Elliott Wave Structure
Looking at the H1 chart, we can see a 5-wave black triangle structure has formed within wave Y. This suggests two possible scenarios:
Scenario 1: Wave Y has completed → the current upward move is wave 1 of a new 5-wave green structure. The ongoing pullback would then be wave 2 of this sequence.
Scenario 2: Wave A of wave Y has completed as a 5-wave move → we are now in wave B of wave Y, which typically forms a 3-wave pattern. In this case, wave a (black) has formed and wave b (black) is currently developing.
✅ In both scenarios, the ongoing decline is a shared element — representing a buying opportunity.
🎯 Key Target Zones
Target 1: 3313 – 3310
Target 2: 3301
⚠️ If price breaks below 3297, the current wave count is invalidated, and we must prepare for a deeper correction. Updates will follow if that happens.
🔁 Momentum Outlook
D1 Timeframe:
Momentum is about to reverse upward. We expect at least 5–6 days of bullish movement for D1 momentum to reach overbought territory ⇒ This supports a potential short-term uptrend and favors both bullish wave counts.
H4 Timeframe:
Momentum is about to reverse downward from the overbought zone → A further decline to our buy zones is likely.
H1 Timeframe:
Momentum is currently declining → The ongoing pullback is expected to continue.
📌 What to wait for: A bullish reversal in H1 momentum aligned with H4 in the oversold region will confirm the bottom is in.
✅ Trade Plan
🔹 BUY ZONE 1: 3313 – 3310
• SL: 3306
• TP1: 3335 | TP2: 3350 | TP3: 3376
🔹 BUY ZONE 2: 3303 – 3301
• SL: 3296
• TP1: 3335 | TP2: 3363 | TP3: 3376

Gold fluctuates upward. Trend change?Yesterday, the gold daily line closed with a middle-yin candlestick with a lower shadow. The closing price has lost the middle and lower rail positions one after another, and the short-term downward pressure adjustment will continue.
The hourly level shows a bottoming out and rebound, and it rose in the early Asian session, breaking through the pressure resistance of 3328-3332 in the European and US sessions yesterday, but it did not continue the rebound and fell into a narrow range. At present, there is still great resistance above 3340, and it has failed to break through after many attempts, but the hourly line track has not been completely lost.
Pay attention to the 3315 support for long positions, and pay attention to the 3340-3355 short position range for upward movement. For the period of shock, strong support or resistance will inevitably produce inertial puncture behavior, and some errors are normal. We need to pay attention to the market trend at all times and change strategies in time.
Today we need to focus on the response strategies for resistance and support levels, which will determine whether we can achieve profits within the fluctuation range.
Good luck to everyone.

Expected reversal/resistance zone price may react here with sellChart Overview:
Instrument: Gold Spot / U.S. Dollar (XAU/USD)
Timeframe: 4-hour
Price at time of screenshot: 3,321.910 USD
🔍
Key Zones & Labels:
🟡
Supply Zone
(Top - Yellow Area):
Around 3,440 – 3,460
Expected reversal/resistance zone; price may react here with selling pressure.
🟩
Strong Support
(Green Area):
Near 3,390 – 3,400
Former support zone that may act as resistance on retracement (support-turned-resistance).
🟧
Demand Zone
(Bottom - Pink Area):
Around 3,280 – 3,310
Strong buying interest shown; price likely to reverse or consolidate in this zone.
🧠
Annotated Insights:
BOS (Break of Structure):
Indicates a bearish structure shift before price tapped into the demand zone.
Liquidity Sweep:
The note says:
“They sweep the Liquidity right now it’s going to bullish”
Suggests stop-losses below demand were taken out (liquidity grab), hinting at a potential bullish reversal.
Projection (Gray Arrows):
Shows two possible price paths:
Rejection at strong support and continuation to supply zone.
Direct move from demand to supply zone.
📌
Purpose of Chart:
This chart is likely used for Smart Money Concept (SMC) or Institutional Order Flow analysis, showing:
Liquidity zones
Structure breaks
Probable bullish reversal

Suppression remains unchanged, the latest layout of gold📰 Impact of news:
1. Powell's testimony
2. Geopolitical impact
📈 Market analysis:
The short-term rebound of gold is the release of energy for the accumulated bulls. From the current market trend, 3340 above is the key point of the short-term watershed between bulls and bears. The short-term resistance above is around 3342-3348, and the short-term support below is around 33220-3315. If it falls below this, it will continue to look towards yesterday's low of 3290-3280. The daily level is under pressure and continues to see a decline and adjustment. If it touches 3340-3350 above, you can try to short. After it retreats to 3320-3315 and obtains effective support, you can consider going long.
🏅 Trading strategies:
SELL 3340-3350
TP 3330-3320-3315
BUY 3320-3315
TP 3330-3340-3350
If you agree with this view, or have a better idea, please leave a message in the comment area. I look forward to hearing different voices.
OANDA:XAUUSD FX:XAUUSD FOREXCOM:XAUUSD FXOPEN:XAUUSD TVC:GOLD

XAUUSD I Forecast Ahead of USD Unemployment ClaimsWelcome back! Let me know your thoughts in the comments!
** XAUUSD Analysis - Listen to video!
We recommend that you keep this pair on your watchlist and enter when the entry criteria of your strategy is met.
Please support this idea with a LIKE and COMMENT if you find it useful and Click "Follow" on our profile if you'd like these trade ideas delivered straight to your email in the future.
Thanks for your continued support!Welcome back! Let me know your thoughts in the comments!
