Bulls have made profits, gold layout in the evening📰 Impact of news:
1. Powell's testimony
2. Geopolitical impact
📈 Market analysis:
I have completed the long trade according to the previous trading strategy, and the long order has generated profit. In the short term, the overall trend of gold is still bearish. Only if it breaks through and stabilizes above 3350 can the bulls continue. If it rebounds to the 3330-3335 line and encounters resistance under pressure, you can consider shorting. If it rebounds to 3340-3350 but fails to stabilize, you can increase your short position. Pay attention to the support of 3320-3300 below. If it falls below 3300, it is expected to reach 3280
🏅 Trading strategies:
SELL 3330-3335-3340-3350
TP 3320-3310-3300-3280
If you agree with this view, or have a better idea, please leave a message in the comment area. I look forward to hearing different voices.
OANDA:XAUUSD FX:XAUUSD FOREXCOM:XAUUSD FXOPEN:XAUUSD TVC:GOLD
Xauusd(w)

GOLD - SHORT TO $2,800 (VIDEO ANALYSIS)Confluences👇
⭕️Wave 3 Peaked at Psychological Number of $2,500 (LQ Point).
⭕️Minor Wave 1 & 2 of Major Wave 4 Complete. But Wave 3 Pending.
⭕️Thin Liquidity In The Markets.
⭕️Gold Overbought/DXY Oversold.
✅HUGE 4,700 PIPS (14% ROI) POTENTIAL PROFIT✅

Trading balanceTrading balance The price of the asset has rebounded from the balance zone. With the prospect of growth into the resistance zone.

GOLD My Opinion! BUY!
My dear followers,
I analysed this chart on GOLD and concluded the following:
The market is trading on 3313.7 pivot level.
Bias - Bullish
Technical Indicators: Both Super Trend & Pivot HL indicate a highly probable Bullish continuation.
Target - 3321.8
Safe Stop Loss - 3309.7
About Used Indicators:
A super-trend indicator is plotted on either above or below the closing price to signal a buy or sell. The indicator changes color, based on whether or not you should be buying. If the super-trend indicator moves below the closing price, the indicator turns green, and it signals an entry point or points to buy.
Disclosure: I am part of Trade Nation's Influencer program and receive a monthly fee for using their TradingView charts in my analysis.
———————————
WISH YOU ALL LUCK

Eyes on Powell testimony H4 Timeframe Analysis
Gold is currently holding the falling wedge pattern on H1 & H4 now market is range of 3290-3335 structural support.
What's possible scanarios we have?
As we have seen market rejected multiple times today at 3335 and still on downside.
if H4 remains belo6 3330-3335 then keep your eyes at 3305 then 3290 milestone.
On the otherhand if The H4 candle closes above 3335 buyying will be rapture and market will tap the Volume Gap at 3365 then 3380.
Additional TIP:
Above 3335 keep buy
Below 3325 keep sell
#XAUUSD

The downward trend is strong.The easing of the situation in the Middle East weakens the demand for safe havens
The direct trigger for the decline in gold prices was the news that Israel and Iran announced a ceasefire. This news quickly cooled the market's risk aversion, and the attractiveness of gold as a traditional safe-haven asset weakened. In the past few weeks, the military confrontation between Israel and Iran once pushed up the safe-haven buying of gold, but with the conclusion of the ceasefire agreement, the market quickly turned to risk preference mode, global stock markets rose, and the US dollar fell. This change in market sentiment directly led to the decline in gold prices.
This decline will still intensify, pay attention to your trading orders, I will continue to update this article, I wish you a smooth trading.

GOLD Made H&S Reversal Pattern , Chance To Sell To Get 200 PipsHere is My 15 Mins Chart On Gold and we have a very good reversal Pattern , Head & Shoulders , we have a 15 mins closure below neckline 3322.00 we can enter a sell trade and targeting at least 100 pips as scalping , we can enter after waiting the price to retest neckline and then enter . and the price can reach 3300.00 to 3296.00 again .

GOLD/XAUUSD SellGold price is still bearish in the short term. The US dollar is currently being boosted. There are also geopolitical talks and indirect ceasefires. Therefore, the short-term risk aversion sentiment has declined. The gold price is now quoted at: 3323. We can focus on the lower target of 3300-3290.

Gold fluctuates, 3300 may fall below.Gold fell to 3333 on Tuesday and then rose to around 3358, then began to fall slowly due to resistance, continued to fall in the European session, and fell to around 3295 in the US session, and rebounded in the late trading, rebounding to around 3325, and the daily line closed with a negative line with a lower shadow.
In addition, Israel and Iran both accused each other of violating the agreement, which brought uncertainty to the gold market.
After the sharp drop in gold last week, except for the correction of the cross positive line on Tuesday last week, the daily level has closed five consecutive negative lines since last Wednesday until now, fully demonstrating that the gold price has shown a weak feature of fluctuating downward in recent transactions.
From the technical indicators, the 5-day moving average and the 10-day moving average cross downward, which indicates an important signal that the market trend is weakening in the short term. The current gold price continues to run below the moving average, further verifying the current market situation where shorts dominate.
In terms of resistance, the 5-day moving average is currently around 3350, and the 10-day moving average is around 3370. These two price levels constitute the key resistance range in the upward process of gold prices. As long as the gold price fails to effectively break through this resistance band, it is likely to continue to be weak in the short term. At the support level, pay attention to the 60-day moving average around 3290.
Operation strategy:
Short gold rebounds around 3350, stop loss 3360, profit range 3320-3310.
Go long gold falls back to around 3295, stop loss 3285, profit range 3330-3340.
The market conditions are often not what we ideally want. This is the market, and it is also a form of trading practice.

SPY/QQQ Plan Your Trade for 6-25 : Breakaway PatternToday's Breakaway pattern suggests the SPY/QQQ may attempt to move into another breakaway price move - very similar to yesterday's price move.
I will add that I believe the SPY cycle patterns have already moved through a breakaway phase with the ceasefire news early this week. I believe the gap and breakaway move yesterday may be the breakaway trend we are expecting today.
That would suggest the markets could pause and pullback a bit over the next few days.
Gold and Silver are trying to find a bottom after the brief selling that took place over the past few days. I really do believe Gold and Silver are poised to make a big move higher.
Bitcoin is on a terror to the upside. But be cautious of the downward cycle channel that may prompt a rollover in BTCUSD near the $107,500 level.
I spend a little time near the end of this video highlighting my work on the Tesla 3-6-9 price theory and going over a few examples for my new book on trading.
Enjoy the quick look at some of the more advanced techniques I'm working to unlock for all of you.
Get some.
#trading #research #investing #tradingalgos #tradingsignals #cycles #fibonacci #elliotwave #modelingsystems #stocks #bitcoin #btcusd #cryptos #spy #gold #nq #investing #trading #spytrading #spymarket #tradingmarket #stockmarket #silver

GOLD Made Double Top Reversal Pattern , Ready For Sell ?Here is My 15 Mins Chart On Gold and we have a very good reversal Pattern , double Top , if we have a 15 mins closure below neckline 3326.00 we can enter a sell trade and targeting at least 100 pips as scalping , we can enter direct if you are aggressive trader or if you not you can wait the price to retest neckline and then enter .

Gold bullish or bearish?From the technical aspect of gold, yesterday, gold gradually fell to 3295 as low as possible. The three tracks of the Bollinger Bands on the daily chart are shrinking, which means that the range is compressed to 3290-3420. The middle and lower tracks in the daily chart are currently 3290-3355. The short-term moving average is currently entangled near the middle track, which also shows the price fluctuation. However, the MACD indicator crosses and increases in volume, which means that the price fluctuates at a low level. Therefore, the strength of the intraday rebound is relatively small, so 3355 and yesterday's high of 3370 are today's resistance levels.
From the 4-hour chart, three consecutive positives are formed in the low-level rebound, the Bollinger Bands close, the current MACD crosses and shrinks in volume, and the dynamic indicator STO quickly repairs upward, which means that the price is fluctuating and rushing up. At present, the price rebounds and breaks through the 3332-33 line, so today it will continue to rebound and test the 3342-48 and 3355 lines, so there is still room above. At the same time, due to the rebound in the morning, the 4-hour and hourly lines are currently bullish. Therefore, we can only buy in advance near 3324-25, and look at the 3340-3348 line. And the short position is below 3354.
Gold operation strategy: It is recommended to buy once when it falls back to 3322-3324, stop loss at 3316, target 3340-3350; it is recommended to sell once when it touches 3348-3352, stop loss at 3359, target 3330-3320;

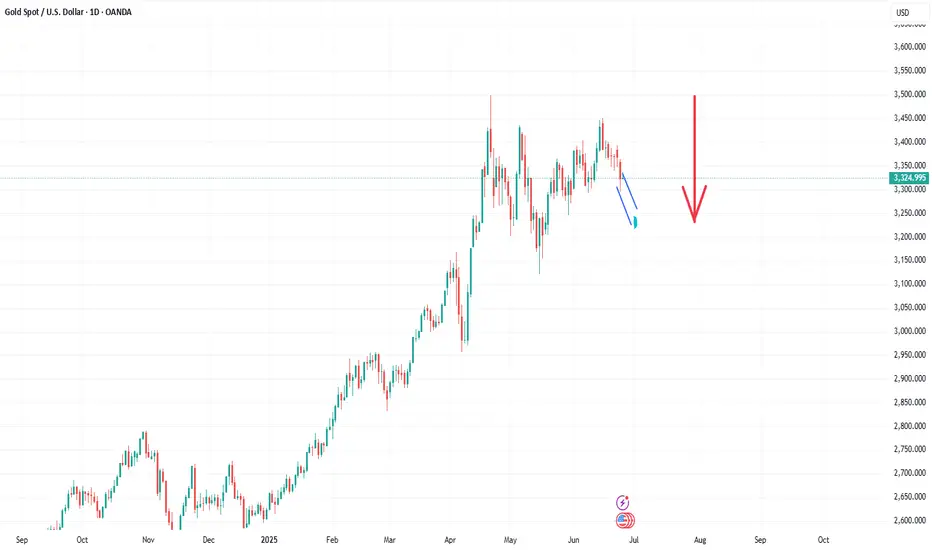
Gold (XAUUSD) – Preparing for a Sharp Pullback🟡 Market Outlook – Late June 2025
📉 Geopolitical Shift
Recent diplomatic progress has eased tensions between Iran, Israel, and the U.S. A ceasefire is now in place, reportedly supported by U.S. mediation efforts. Iran is also signaling openness to resuming nuclear discussions — a major shift that reduces geopolitical risk in the region.
📈 Risk-On Mood in Markets
Traditional markets have responded strongly:
Nasdaq-100 reached all-time highs
S&P 500 up ~1.1%
Dow Jones gained over 500 points
These are clear signs that investor sentiment is shifting away from fear and toward risk assets.
🛢️ Oil Prices Cooling
Crude oil has dropped significantly:
Brent and WTI are both down 6–7%
This drop reflects reduced concerns about a supply shock and confirms that energy markets are not pricing in a wider conflict.
🥇 Gold Losing Momentum
Gold failed to sustain above $3,445 and is now facing strong selling pressure. The easing geopolitical risk, dropping oil, and rising equities are all bearish signals for gold.
🎯 My short-term target: $3,218
As the safe-haven demand continues to fade, I expect XAUUSD to test the $3,218 level in the coming days.
🪙 Meanwhile in Crypto
Bitcoin and other crypto assets are rallying, benefiting from capital rotation and the renewed risk appetite. BTC could be eyeing new all-time highs as gold pulls back.
⚠️ Not financial advice – always do your own research.
gold on short bullish#XAUUSD on bullish reverse till 3340 for sell.
Buy on 2 times breakout above 3330, target 3340, SL 3325 short.
Above 3340 sell, target 3305, SL 3349
Below 3320 have bearish range, we watch the price closely to sell till 3315-3305.

Xauusd market update This chart shows a Gold Spot (XAU/USD) analysis on the 1-hour timeframe. Here's a breakdown of the setup:
---
Key Levels:
Current Price: $3,326.695
Support Zone (Blue Area): ~$3,280 – $3,310
Resistance Zone (Purple Area): ~$3,375 – $3,400
---
Chart Insights:
The price appears to be consolidating in a range (highlighted by the blue support/resistance bands).
There's a dotted projected path showing a possible:
1. Short dip into the lower support zone around $3,280
2. Reversal and sharp move up toward the $3,375–$3,400 resistance zone
---
Interpretation:
This is a bullish setup suggesting a buy opportunity if price dips to the lower blue zone and shows a reversal.
The target lies near the upper purple zone ($3,400).
Traders might watch for:
Bullish candlestick confirmation near the support zone
Breakout from the current consolidation
Volume confirmation on the move upward
---
Would you like a risk-reward analysis or entry/stop/target levels based on this setup?

Powell's Softer Tone Hints at Gold's LiftoffXAUUSD: Powell's Softer Tone Hints at Gold's Liftoff – Ready for a July Rally?
Hey everyone!
Let's dive into XAUUSD today! We've got some sweet news from Fed Chair Jerome Powell that could be a game-changer for Gold.
🌍 Macro Edge: Gold Breathes Easier as Rate Pressures May Ease!
Gold's recent climb is largely thanks to Powell's "soft-spoken" remarks. He's openly admitted that tariff-driven inflation is lower than expected, even subtly hinting at earlier rate cuts – perhaps as soon as July!
Despite his "no need to rush" stance, the market's getting a clear message: if inflation keeps cooling down, the Fed will have room to loosen policy sooner. This is music to Gold's ears! Lower rates mean a reduced opportunity cost for holding Gold (which doesn't yield), making it far more attractive to investors.
🌐 Capital Flows: Gold vs. USD – Who's the Next Safe-Haven King?
Market liquidity always dances to the tune of interest rates and risks. Gold and the USD typically share the safe-haven crown during volatile times.
However, if Powell's "dovish tilt" holds, and the Fed cuts rates soon, prepare for a significant capital shift:
USD might cool off: Lower US yields reduce the USD's appeal.
Gold takes the spotlight: With lower holding costs and persistent global geopolitical uncertainties, Gold could see a surge in demand.
The market's re-pricing of Fed policy is already bolstering Gold, signaling a potential upside move on the horizon!
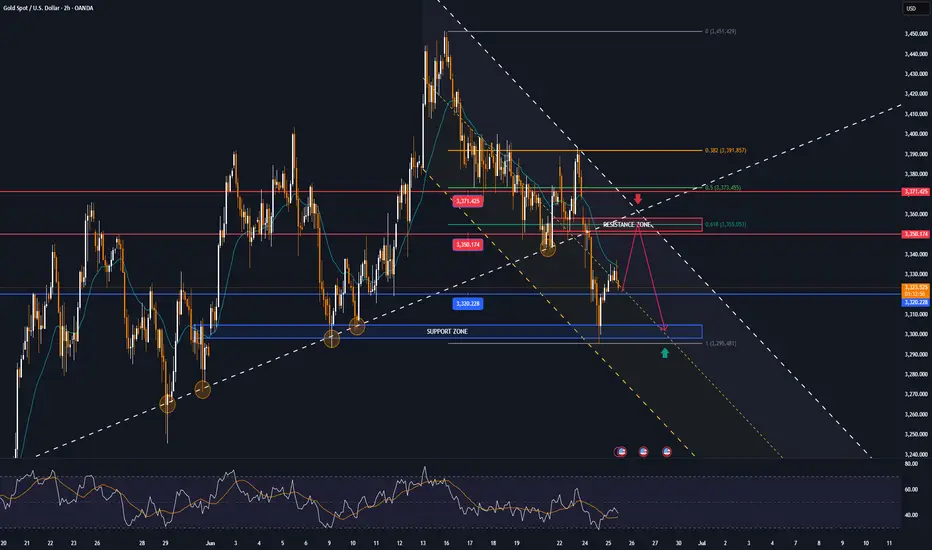
📊 Technical Insight (H4/M30 Chart): Gold Breaking Free, Targeting Higher Peaks!
Looking at our XAUUSD chart (H4/M30, based on your image):
Channel Breakout: Gold has clearly broken out of its prior descending channel! This is a positive sign, indicating weakening selling pressure and a potential trend reversal. Price is consolidating, possibly forming a new accumulation pattern or a minor ascending channel.
Key Levels to Watch:
Potential SELL Zone (Resistance): Around 3352.383 - 3371.205. This is a major historical resistance cluster where Gold has previously met strong selling pressure. Watch for rejection here.
Higher Resistance: 3391.750 - 3395.000. A decisive break above this level would signal a more robust long-term bullish trend.
Current BUY Zone (Support): Around 3302.939 - 3311.214. This is a critical demand zone where strong buying interest is likely to emerge, aligning with recent lows.
Next Key Support: 3286.257. This is the next line of defense if the current BUY zone breaks.
🎯 Trade Plan & Key Zones:
BUY ZONE: 3286 - 3284
SL: 3280
TP: 3290 - 3294 - 3298 - 3302 - 3306 - 3310 - 3315 - 3320
BUY SCALP: 3302 - 3300
SL: 3295
TP: 3306 - 3310 - 3314 - 3318 - 3322 - 3326 - 3330
SELL ZONE: 3353 - 3355
SL: 3360
TP: 3350 - 3346 - 3340 - 3335 - 3330 - 3320
SELL ZONE: 3372 - 3374
SL: 3378
TP: 3370 - 3366 - 3362 - 3358 - 3354 - 3350
⚠️ What Else to Watch For:
More Fed Official Speeches: Any new comments on inflation or policy will keep the market buzzing.
Geopolitical Developments: Ongoing global tensions can always boost Gold's safe-haven appeal.
Let's trade smart and stay sharp! Wishing everyone a successful trading day!

GOLD recovers from 2-week low, short-term neutral biasOANDA:XAUUSD hit a two-week low in yesterday's trading session before recovering, currently trading around $3,330/oz, up slightly by about 0.14% on the day.
The main reason was the ceasefire between Iran and Israel, which curbed demand for safe-haven gold. In addition, Federal Reserve Chairman Powell made hawkish comments, which also affected the gold price trend.
Israel and Iran reach ceasefire agreement
A ceasefire came into effect on Tuesday under pressure from US President Donald Trump, raising optimism that the biggest military conflict between the two arch-rivals in the Middle East may be coming to an end.
The easing of tensions in the Middle East has been a major factor in the pressure on gold. Risk sentiment has weakened and the market has entered risk-on mode.
US President Trump announced on Monday evening that Israel and Iran had reached an agreement on a “complete and total ceasefire”. Iran’s state TV officially announced on Tuesday that Iran had ceased fire with Israel.
Israeli Defense Minister Israel Katz announced earlier Tuesday that the Israeli military would launch a new wave of strikes on targets in Tehran in retaliation for Iran's missile launch and "blatant violation" of the ceasefire.
The Israeli government said that Israel would hold off on further strikes on Iran after Prime Minister Benjamin Netanyahu spoke with US President Trump.
Powell sends important signal
Federal Reserve Chairman Powell will testify before the House Financial Services Committee on Tuesday and deliver a report on the Fed’s monetary policy. Powell will also testify before the Senate Banking Committee today (Wednesday).
In congressional testimony on Tuesday, Powell said the Fed needs more time to see whether tariffs are causing inflation to rise further before considering cutting interest rates.
In congressional testimony, Powell said he and most Fed officials expect inflation to rise soon and that the Fed is in no rush to cut rates before then.
“We are now in a very good position to wait and see what the likely path of the economy is before considering whether to adjust the policy stance,” Powell said.
Markets generally believe that the July 29-30 meeting is unlikely to result in a rate cut, with the first rate cut expected in September.
Technical Outlook Analysis OANDA:XAUUSD
With the current technical position, gold has not yet had a complete short-term trend as the price action is still around the EMA21 moving average, and the RSI is operating around the 50 level.
With the current price action showing that the market is still hesitant, gold may enter a sideways accumulation phase.
However, in terms of the long-term trend, gold is still in a long-term uptrend channel with the case for a complete downtrend to occur is the condition that the price action is taken below the raw price point of 3,300 USD. Then the downside target is the 0.50% Fibonacci retracement level in the short term.
During the day, the trend of gold is neutral with the expected operating range between 3,350 – 3,300 USD.
Notable positions will also be listed as follows.
Support: 3,320 – 3,300 USD
Resistance: 3,350 – 3,371 USD
SELL XAUUSD PRICE 3349 - 3347⚡️
↠↠ Stop Loss 3353
→Take Profit 1 3341
↨
→Take Profit 2 3335
BUY XAUUSD PRICE 3301 - 3303⚡️
↠↠ Stop Loss 3297
→Take Profit 1 3309
↨
→Take Profit 2 3315
Gold Slips as Ceasefire Eases SafeHaven Demand Bearish Below3339Gold Drops on Israel-Iran Ceasefire
Gold prices declined as safe-haven demand eased following President Trump’s announcement of a ceasefire between Israel and Iran. Despite the pullback, gold remains up nearly 23% year-to-date, supported by ongoing geopolitical tensions, economic uncertainty driven by Trump’s tariffs, and robust central bank purchases.
Market Focus:
All eyes are now on U.S. Federal Reserve Chair Jerome Powell’s testimony, which may offer fresh insights into potential near-term interest rate cuts.
Technical Outlook:
Gold remains under bearish pressure as long as it trades below the 3329–3339 pivot zone.
A confirmed 4H candle close below 3329, or especially 3309, would further validate downside momentum toward the support range.
Support Levels: 3302, 3281, 3256
Resistance Levels: 3364, 3393
A clear break below 3302–3281 would open the path toward deeper bearish continuation.

Pullback Before Bullish ContinuationGold is currently facing resistance near the mid-Keltner Channel zone. Based on current structure and momentum, we anticipate a two-phase move:
🔻 Phase 1 – Short-Term Pullback:
Price is likely to reject the current resistance and move lower into the demand zone around 3310–3315. This retracement aligns with a healthy correction within a larger structure.
🟢 Phase 2 – Bullish Reversal:
After the pullback, we expect a strong bullish continuation toward the 3370–3373 area. This level represents the next significant resistance and profit target for long positions.
📌 Key Zones to Watch:
Demand Support: 3310–3315
Bullish Target: 3370–3373
Stop-Loss for Longs: Below 3308

XAUUSD – Short-Term Decline, Long-Term Bullish AccumulationAfter a sharp drop of over 1,250 pips yesterday, gold reacted at the key demand zone around 3,300, where initial buying pressure has emerged. The chart still shows a valid short-term downtrend, but this area also aligns with the lower boundary of a long-term channel—previously a launch point for significant upward moves.
Currently, XAUUSD is consolidating below multiple unfilled Fair Value Gaps, awaiting a confirmed breakout toward the 3,361.500 region to potentially reverse the trend.
In terms of news, tensions in the Middle East escalated as the U.S. launched airstrikes on Iran’s nuclear facilities, triggering strong volatility in gold. Upcoming key U.S. economic data—including quarterly GDP and the Fed’s preferred inflation gauge, Core PCE—will play a crucial role in determining whether gold has the momentum to break out or remains in consolidation.
For now, the short-term bias remains bearish, but buyers are quietly accumulating strength for a potential long-term rally.

XAUUSD Analysis todayHello traders, this is a complete multiple timeframe analysis of this pair. We see could find significant trading opportunities as per analysis upon price action confirmation we may take this trade. Smash the like button if you find value in this analysis and drop a comment if you have any questions or let me know which pair to cover in my next analysis.

XAU/USD 25 June 2025 Intraday AnalysisH4 Analysis:
-> Swing: Bullish.
-> Internal: Bullish.
Analysis and bias remains the same as analysis dated 23 April 2025
Price has now printed a bearish CHoCH according to my analysis yesterday.
Price is now trading within an established internal range.
Intraday Expectation:
Price to trade down to either discount of internal 50% EQ, or H4 demand zone before targeting weak internal high priced at 3,500.200.
Note:
The Federal Reserve’s sustained dovish stance, coupled with ongoing geopolitical uncertainties, is likely to prolong heightened volatility in the gold market. Given this elevated risk environment, traders should exercise caution and recalibrate risk management strategies to navigate potential price fluctuations effectively.
Additionally, gold pricing remains sensitive to broader macroeconomic developments, including policy decisions under President Trump. Shifts in geopolitical strategy and economic directives could further amplify uncertainty, contributing to market repricing dynamics.
H4 Chart:
M15 Analysis:
-> Swing: Bullish.
-> Internal: Bullish.
Following previous high, and printing of bearish CHoCH, price has pulled back to an M15 supply zone, where we are currently seeing a reaction. Therefore, I shall now confirm internal high.
Price is now trading within an established internal range.
The remainder of my analysis shall remain the same as analysis dated 13 June 2025, apart from target price.
As per my analysis dated 22 May 2025 whereby I mentioned price can be seen to be reacting at discount of 50% EQ on H4 timeframe, therefore, it is a viable alternative that price could potentially print a bullish iBOS on M15 timeframe despite internal structure being bearish.
Price has printed a bullish iBOS followed by a bearish CHoCH, which indicates, but does not confirm, bearish pullback phase initiation. I will however continue to monitor, with respect to depth of pullback.
Intraday Expectation:
Price to continue bearish, react at either M15 supply zone, or discount of 50% internal EQ before targeting weak internal high priced at 3,451.375.
Note:
Gold remains highly volatile amid the Federal Reserve's continued dovish stance, persistent and escalating geopolitical uncertainties. Traders should implement robust risk management strategies and remain vigilant, as price swings may become more pronounced in this elevated volatility environment.
Additionally, President Trump’s recent tariff announcements are expected to further amplify market turbulence, potentially triggering sharp price fluctuations and whipsaws.
M15 Chart:

Gold H4 | Pullback resistance at 50% Fibonacci retracementGold (XAU/USD) is rising towards a pullback resistance and could potentially reverse off this level to drop lower.
Sell entry is at 3,344.72 which is a pullback resistance that aligns with the 50% Fibonacci retracement.
Stop loss is at 3,400.00 which is a level that sits above the 61.8% Fibonacci retracement and a swing-high resistance.
Take profit is at 3,276.41 which is a swing-low support.
High Risk Investment Warning
Trading Forex/CFDs on margin carries a high level of risk and may not be suitable for all investors. Leverage can work against you.
Stratos Markets Limited (tradu.com ):
CFDs are complex instruments and come with a high risk of losing money rapidly due to leverage. 63% of retail investor accounts lose money when trading CFDs with this provider. You should consider whether you understand how CFDs work and whether you can afford to take the high risk of losing your money.
Stratos Europe Ltd (tradu.com ):
CFDs are complex instruments and come with a high risk of losing money rapidly due to leverage. 63% of retail investor accounts lose money when trading CFDs with this provider. You should consider whether you understand how CFDs work and whether you can afford to take the high risk of losing your money.
Stratos Global LLC (tradu.com ):
Losses can exceed deposits.
Please be advised that the information presented on TradingView is provided to Tradu (‘Company’, ‘we’) by a third-party provider (‘TFA Global Pte Ltd’). Please be reminded that you are solely responsible for the trading decisions on your account. There is a very high degree of risk involved in trading. Any information and/or content is intended entirely for research, educational and informational purposes only and does not constitute investment or consultation advice or investment strategy. The information is not tailored to the investment needs of any specific person and therefore does not involve a consideration of any of the investment objectives, financial situation or needs of any viewer that may receive it. Kindly also note that past performance is not a reliable indicator of future results. Actual results may differ materially from those anticipated in forward-looking or past performance statements. We assume no liability as to the accuracy or completeness of any of the information and/or content provided herein and the Company cannot be held responsible for any omission, mistake nor for any loss or damage including without limitation to any loss of profit which may arise from reliance on any information supplied by TFA Global Pte Ltd.
The speaker(s) is neither an employee, agent nor representative of Tradu and is therefore acting independently. The opinions given are their own, constitute general market commentary, and do not constitute the opinion or advice of Tradu or any form of personal or investment advice. Tradu neither endorses nor guarantees offerings of third-party speakers, nor is Tradu responsible for the content, veracity or opinions of third-party speakers, presenters or participants.
