XAUUSDHello traders.
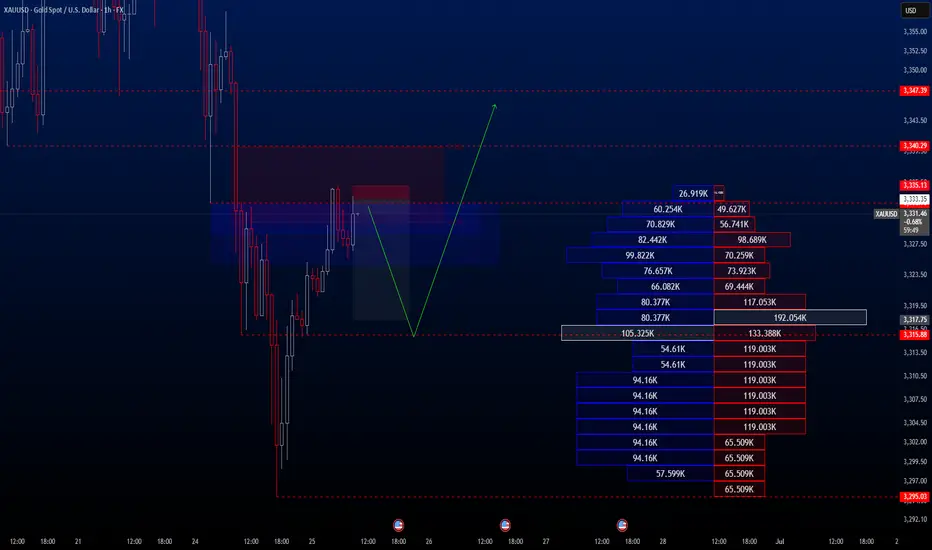
I’ve spotted an exceptional sell opportunity on the XAUUSD pair—one of those setups that come around once in a hundred years! The trade offers a Risk-to-Reward ratio of over 1:8, so I thought it would be valuable to share it with you.
Please adjust your risk parameters accordingly before entering the trade.
🔍 Trade Details
✔️ Timeframe: H1
✔️ Risk-to-Reward Ratio: 1:8.70
✔️ Trade Direction: Sell
✔️ Entry Price: 3333.35
✔️ Take Profit: 3317.75
✔️ Stop Loss: 3335.13
🕒 If momentum fades or the price consolidates in a tight range, I will keep this trade open only until 23:00 (UTC+4). After that, I’ll close it manually—whether in profit or loss—depending on how price action evolves.
🔔 Disclaimer: This is not financial advice. I’m simply sharing a trade I’ve taken based on my personal trading system, strictly for educational and illustrative purposes.
📌 Interested in a systematic, data-driven trading approach?
💡 Follow the page and turn on notifications to stay updated on future trade setups and advanced market insights.
Xauusd(w)
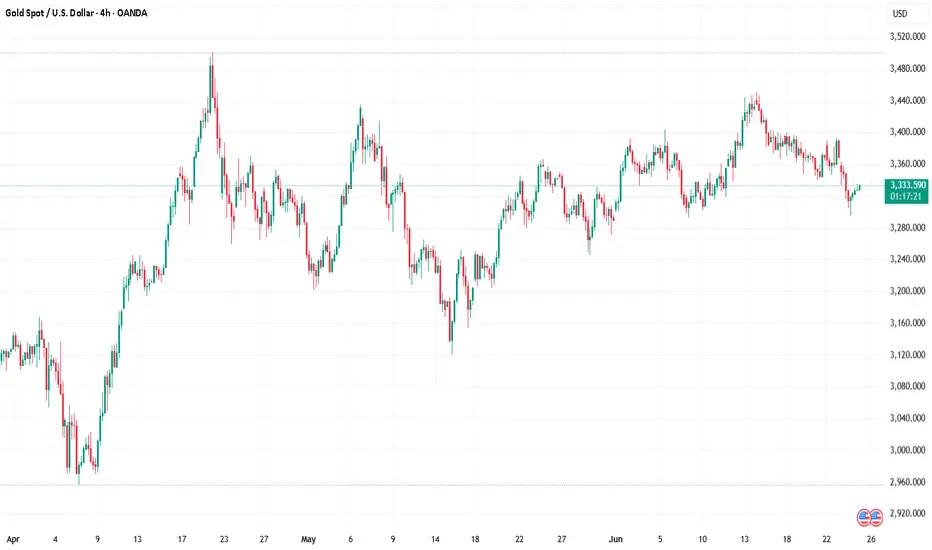
4‑Hour Analysis – Supply & Demand Overview 25 June 20251. Market Structure
XAU/USD currently trades at 3333 and shows clear higher highs and higher lows on the 4‑hour timeframe—reflecting a bullish structure backed by recent swing lows above 3300 and highs nearing 3365
2. Key Demand Zones
DZ1: 3320–3330 – Consolidation region with multiple wicks and price rejections; confirmed buying volume (aligned with ML and 50‑EMA confluence)
DZ2: 3300–3310 – A deeper base with strong reversal history; aligns with psychological round number and 0.382 Fib of recent up-swing
3. Key Supply Zones
SZ1: 3350–3360 – Upper resistance cluster formed by repeated spikes and quick rejections; overlapping 0.5–0.618 Fib from the last retracement
SZ2: 3380–3400 – Broader distribution area with past failed breakouts; significant liquidity shelf noted
4. Why These Zones Matter
Demand zones act as value entry areas where institutional and retail buyers absorb selling pressure, usually followed by swift reversals.
Supply zones represent distribution pockets where buy orders face strong pushback, often leading to corrective moves.
5. Bias
✅ Overall Bias – Bullish (4‑hour) thanks to structural trend (HH/HL), price above key previews like 50‑EMA & 20‑EMA, and consistent demand responses. Only a break below 3320 invalidates bullish tilt.
⚡ 1‑Hour Intraday Setups (Aligned with Bullish 4H Bias)
Buy the Dip (Main Entry)
Zone: 3320–3325
Context: Retest of DZ1, tagging the 4H structure and 1H ascending trendline.
Confirmation: Bullish pin bar or long tail candle + volume surge.
Channel Retest Quick‑Entry
Zone: 3330–3335
Context: Price remediates after a clean breakout above the 1‑hour descending channel.
Confirmation: Trendline bounce or bullish engulfing on the first test.
Supply‑Fade (Aggressive)
Zone: 3350–3355
Context: Approach to SZ1—plays the bearish reaction in a bull market context.
Confirmation: Bearish pin bar, upper wick exhaustion, and slim 1H RSI divergence.
📈 Chart Snapshot & Confluences
DZ1 (3320–3330) aligns with the 0.382 Fib and ascending 1‑hour trendline.
Quick-entry zone (3330–3335) sits close to the 1‑hour 50‑EMA, offering dynamic multi‑timeframe confluence.
SZ1 aligns with higher-term fib and previous supply peaks.
📝 Ready Summary
XAU/USD – 4H Structure: Bullish – higher highs & higher lows.
Major Demand Zones: 3320–3330 (primary), 3300–3310 (secondary).
Major Supply Zones: 3350–3360 (hot zone), 3380–3400 (upper resistance).
Bias: Bullish as long as price holds above 3320.
Intraday Trade Zones:
Buy the Dip: 3320–3325 – look for pin‑bar/volume bounce.
Quick Re‑Entry: 3330–3335 – trendline or 50‑EMA test confirmation.
Supply Fade (Aggressive): 3350–3355 – bearish rejection setup.
Pro Tip: Focus on clean price action signals (wicks, engulfings, volume) within entry zones and confirm with multi‑timeframe confluences (Fib, EMA, trendlines).
DeGRAM | GOLD dipped below the supply zone📊 Technical Analysis
● Price has broken the inner rising-trend support and is sliding inside a fresh descending channel; the current pull-back is stalling in the 3 350-3 365 supply zone, where the old trend-line and a June distribution block overlap, printing consecutive lower highs.
● The channel’s width and the purple flag just completed project to 3 295 support (May pivot + mid-channel); a close beneath it exposes the outer rail / March swing low around 3 245.
💡 Fundamental Analysis
● Hawkish Fed comments have pushed 2-yr yields back above 4.8 % and lifted the DXY, while CFTC figures show a third straight week of long liquidation, curbing bullion bids.
✨ Summary
Fade 3 345-3 360; sustained trade under 3 320 targets 3 295 ➜ 3 245. Short bias void on an H1 close above 3 365.
-------------------
Share your opinion in the comments and support the idea with a like. Thanks for your support!

XAUUSD Bullish ReversalXAUUSD till mid-June 2025 is on the up trend channel
- Based on 1 hourly chart
- A rising wedge pattern, Buying Climax and a Secondary Test marks the start of Bearish Trend.
- A Bearish Trend Channel saw a falling wedge below Previous Week Low that hints to a Bullish Trend
- The bullish reversal is likely to draw on buyside liquidity and opening gaps where the confluence of the Bearish Trend Channel

Bearish drop?The Gold (XAU/USD) is rising towards the pivot, which has been identified as an overlap resistance, and could drop to the 1st support, acting as a pullback support.
Pivot: 3,339.40
1st Support: 3,297.74
1st Resistance: 3,389.16
Risk Warning:
Trading Forex and CFDs carries a high level of risk to your capital and you should only trade with money you can afford to lose. Trading Forex and CFDs may not be suitable for all investors, so please ensure that you fully understand the risks involved and seek independent advice if necessary.
Disclaimer:
The above opinions given constitute general market commentary, and do not constitute the opinion or advice of IC Markets or any form of personal or investment advice.
Any opinions, news, research, analyses, prices, other information, or links to third-party sites contained on this website are provided on an "as-is" basis, are intended only to be informative, is not an advice nor a recommendation, nor research, or a record of our trading prices, or an offer of, or solicitation for a transaction in any financial instrument and thus should not be treated as such. The information provided does not involve any specific investment objectives, financial situation and needs of any specific person who may receive it. Please be aware, that past performance is not a reliable indicator of future performance and/or results. Past Performance or Forward-looking scenarios based upon the reasonable beliefs of the third-party provider are not a guarantee of future performance. Actual results may differ materially from those anticipated in forward-looking or past performance statements. IC Markets makes no representation or warranty and assumes no liability as to the accuracy or completeness of the information provided, nor any loss arising from any investment based on a recommendation, forecast or any information supplied by any third-party.

XAUUSD 1H | Harmonic AB=CD | Sentiment Reversal in PlayGold has formed a clean Harmonic AB=CD Pattern, with price currently sitting at the PRZ (Potential Reversal Zone). This aligns with technical expectations for a possible bullish shift.
🗓️ The recent sharp sell-off in Gold was heavily influenced by the ongoing Iran-Israel conflict, triggering fear, panic, and speculative selling. Despite Gold's fundamentally bullish bias as a safe-haven asset, market sentiment overpowered fundamentals in the short term.
🔍 On the 30min LTF, we have a crystal-clear Bullish Divergence on RSI, adding further confluence that downside momentum is weakening, and a corrective reversal may unfold from this area.
Bias:
✅ Harmonic AB=CD complete — PRZ active
✅ LTF Bullish Divergence (30m) confirmed
✅ Price action showing exhaustion at key support
✅ Expecting potential bullish reaction and relief rally
⚠️ As always, waiting for confirmation with proper risk management. Market remains sensitive to geopolitical headlines.
💡 DYOR — Do Your Own Research before executing trades.

Gold is under pressure. Will the trend change?Information summary:
The easing of tensions in the Middle East is the main reason for the suppression of gold. Risk aversion has weakened, and the market has entered a risk-taking mode. Gold prices are well supported near $3,300.
Powell released an important signal: The market expected Powell to strongly refute the possibility of a rate cut, but he remained on the sidelines. The market still generally believes that the July 29-30 meeting is unlikely to initiate a rate cut, and the first rate cut is expected to be in September.
Market analysis:
Gold has fallen for seven consecutive weeks, which has changed the current bull structure in stages, so there is no doubt that gold is expected to fall back as a whole. The early decline was near 3355, which is the current long-short watershed of gold. As long as the adjustment does not break through the 3355 position, the overall short-term adjustment pattern of gold will not change.
The early Asian market did not continue to retreat, but the short-term rebound had a long buying force accumulation, but as long as it did not break through 3355, the market trend was still weak, and it was adjusted by low-level shock correction. Today, there is a high probability of movement around the falling range. The short-term support below is around 3290. If this position is lost, it may touch the turning point around 3275.
Operation strategy:
Go long when the price falls back to around 3315, stop loss at 3305, and profit range 3345-3350.

GOLD. Daily Timeframe overview with Initiative AnalysisHey traders and investors!
Daily Timeframe
Market phase : sideways. Seller's initiative.
Boundaries marked with black lines.
Gold followed an alternative scenario from the previous review toward 3435. The buyer played out the 8-9 vector of the range on the daily timeframe, and now the initiative has shifted to the seller. The seller's targets are 3245 and 3201 — areas to watch for potential buy patterns aiming for a new ATH. The price might get stuck in the 3293–3271 zone. If a strong buyer reaction occurs, a reversal may happen in this range.
The ideal area to look for buy patterns is around 3201.
Selling is risky.
This analysis is based on the Initiative Analysis concept (IA).
Wishing you profitable trades!

Gold today high-altitude low-multiple operation
📌 Gold news
On Tuesday, the spot gold price plummeted, hitting a two-week low. The main reason was that Iran and Israel announced a ceasefire, which suppressed the demand for safe-haven gold. In addition, Fed Chairman Powell made hawkish remarks, which also hit the gold price trend. Short-term long-short game will focus on the PCE inflation data to be released by the United States. If the economic data performs poorly or inflation continues to fall, it may still provide a medium-term rebound opportunity for gold.
📊Comment analysis
Yesterday, gold was weak overall, and the decline and rebound were limited. It fell directly from around 3357 to 3295, and then rebounded according to the news. It ran around 3326 in the morning. From a technical point of view, the daily low trend line support is around 3290, the 4-hour long lower shadow line bottomed out, and three consecutive positive rebounds, the daily line supports the lower track of the Bollinger band, and the Bollinger band tends to be parallel. There is no sign of opening downward, so the short-term decline of gold prices is limited. Consider paying attention to the support of 3294 during the day, and mainly use this position for defense and low long. Pay attention to the important suppression of the middle track 3363 above, and mainly short.
💰Strategy Package
Focus on the support near 3316-3317 in the short term, rely on this position to go long, stop loss 3307, take profit near 3345, and break 3363. If it falls strongly below 3294, then don't consider going long during the day.
Gold operation strategy: long near 3316, stop loss 3307. Take profit 3345
⭐️ Note: Labaron is not 100% correct here, only a steady operation idea, large warehouse for trend, small warehouse for wave, control the proportion by yourself, there is no unprofitable investment, only unsuccessful orders, whether to make money depends on the timing of buying up and buying down, making money depends on opportunities, investment depends on wisdom, and financial management depends on professionalism.

Will gold prices continue to decline?On Tuesday, spot gold once fell below the $3,310 level and finally closed down 1.67% at $3,322.82 per ounce, as the Israel-Iran ceasefire dented safe-haven sentiment and Fed Chair Powell stated that more time is needed before considering interest rate cuts. Spot silver closed down 0.46% at $35.90 per ounce. The benchmark 10-year U.S. Treasury yield closed at 4.2960%, and the 2-year yield at 3.8310%. Powell indicated that current policy is in a favorable position to wait and see before considering rate adjustments, adding that "colleagues privately say I'm doing the right thing". The vast majority of officials believe rate cuts later this year would be appropriate, while noting it's "too early to declare the U.S. dollar is falling".
Technically, gold's daily chart formed a large bearish candle with a lower shadow, breaking below previous support levels amid consolidation. This suggests the bearish trend may persist.
you are currently struggling with losses,or are unsure which of the numerous trading strategies to follow,You have the option to join our VIP program. I will assist you and provide you with accurate trading signals, enabling you to navigate the financial markets with greater confidence and potentially achieve optimal trading results.
Trading Strategy:
sell@3330-3335
TP:3300-3295

GOLD Risky Short! Sell!
Hello,Traders!
GOLD made a bullish
Rebound but will soon
Hit a wide horizontal
Resistance of around 3,345$
And as we are locally bearish
Biased after the recent rising
Support breakout we will be
Expecting a bearish pullback
And a local move down
Sell!
Comment and subscribe to help us grow!
Check out other forecasts below too!
Disclosure: I am part of Trade Nation's Influencer program and receive a monthly fee for using their TradingView charts in my analysis.

GOLD MARKET ANALYSIS AND COMMENTARY - [Jun 23 - Jun 27]This week, after opening at $3,369/oz, OANDA:XAUUSD prices fluctuated within a fairly narrow range, from only $3,340-$3,374/oz, and closed at $3,368/oz. The fact that gold prices closed this week close to the opening price shows that investors are hesitant in the current context.
The reason why gold prices are still fluctuating within a narrow range this week is because US President Donald Trump gave Iran a 2-week deadline to consider negotiating an end to the conflict with Israel, even though the Israel-Iran conflict is still raging.
In addition, on June 12, the Fed kept interest rates unchanged at 4.25% - 4.5%, while adjusting its forecast for US GDP growth lower and raising its estimate for near-term inflation. Fed Chairman Jerome Powell acknowledged that tariffs would push up prices and weigh on economic activity. Although two rate cuts are expected before the end of the year, Powell said the Fed may wait for more clarity before cutting rates.
Next week, the Fed Chairman will hold two semiannual monetary policy hearings before the US House and Senate committees on Tuesday and Wednesday. If Fed Chairman Powell hints at a rate cut in September 2025, the USD could fall against other major currencies, causing gold prices to rise next week. Conversely, if the Fed Chairman emphasizes that they will continue to prioritize controlling inflation and is in no hurry to cut interest rates, the USD will rise, thereby pushing gold prices down next week.
📌Technically, the gold price on the H4 and D1 charts is stuck between the range of 3295-3450, which is an important support level around 3295, and the resistance level at 3450.
The current price is moving sideways and accumulating in smaller time frames, and the trend has not been clearly defined when it has not broken through the above two resistance levels.
There are two scenarios for gold.
In the long-term framework, if it breaks through the 3450 zone and breaks the trend at the same time, it is expected that the gold price will set a new high.
In the case that the gold price trades below the 3300 round resistance, and at the same time the 3295 support zone is broken, it is easy to form a head and shoulders pattern on the H4 chart.
Notable technical levels are listed below.
Support: 3,350 – 3,320 – 3,300USD
Resistance: 3,371 – 3,400 – 3,435 – 3,500USD
SELL XAUUSD PRICE 3412 - 3410⚡️
↠↠ Stop Loss 3416
BUY XAUUSD PRICE 3294 - 3296⚡️
↠↠ Stop Loss 3290

XAUUSD Ready bounce back?XAUUSD 3295.00 is an important weekly and daily key level price has just bounced back from the key level with double bottom formation. It is possible for the price to continue to bounce back to daily resistance level?
While was in down trend price has left significant imbalance in the market showing possible uptrend with the filling of FVG.
A buy trade with strong liquidity grab is high probable.

Geopolitical Spike Fades Fast – Gold Eyes 3300As highlighted in Friday’s analysis, the daily and short-term charts remain messy, but the weekly chart is leaning clearly bearish – with a potential Dark Cloud Cover candlestick formation now confirmed.
🌍 Geopolitical Gap Up... and Quick Rejection
Monday’s Asian open brought a gap up, triggered by renewed tensions in the Middle East. But price failed to break above 3400 and quickly reversed – a textbook sign of weakness, not strength.
🧭 Technical View:
- The weekly candle closed as a Dark Cloud Cover, a strong bearish reversal signal
- The lack of follow-through after the gap up further confirms sellers are still in control
- Price remains below the key 3400 level, showing no bullish momentum behind recent spikes
📌 Trading Plan:
I continue to sell rallies, with an initial target near 3300. If bearish momentum builds, lower levels are in play.
Let the chart lead – don’t get distracted by the noise.
Disclosure: I am part of TradeNation's Influencer program and receive a monthly fee for using their TradingView charts in my analyses and educational articles.

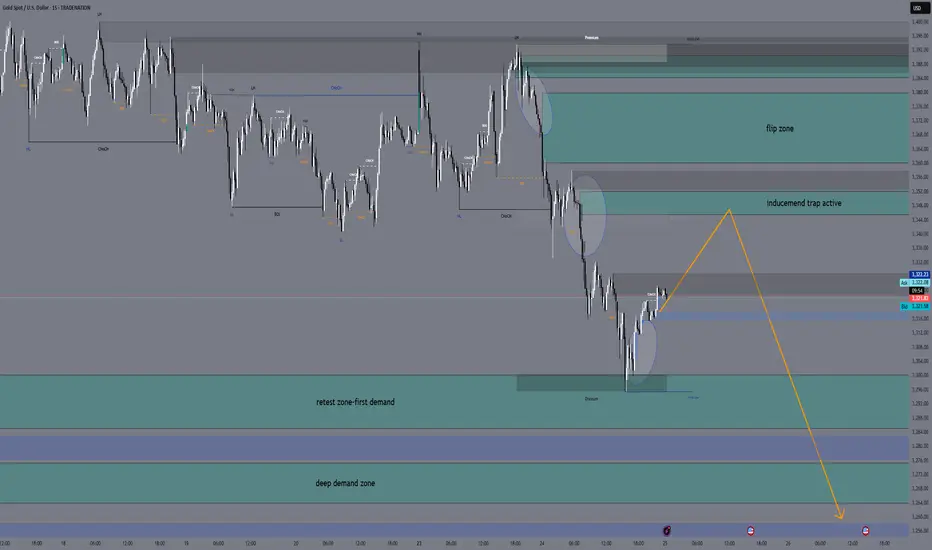
XAUUSD Daily Sniper Plan – June 25, 2025👋👋 Hello traders!
Gold is still moving down strongly. Today’s plan is made for traders who want clear and precise levels. Let’s look at the structure, important zones, and where to watch for trades.
1. Higher Timeframe Overview (Daily, H4, H1)
Daily: Price is falling near the 200 EMA around 3323. RSI shows less buying strength. We wait for a clear move.
H4: The trend is down with lower highs at 3418 and lower lows at 3311. RSI is low, showing weak buying. Price is near the 200 EMA.
H1: Small bounce up to 3328–3332 resistance. RSI is weak, so price must break this zone to move higher.
2. Lower Timeframe Details (M30, M15)
M30: EMA5 crossed above EMA21 but price is near resistance at 3328–3332. RSI is neutral.
M15: Price broke a small wedge up but is limited by EMA21 and EMA50. RSI near 58 shows price could be overbought.
3. Key Zones and How to Trade Them
🔻 Sell Zone: 3345 – 3352
Look for signs that price rejects this zone (wicks, bearish candles) before selling.
🟡 Flip / Decision Zone: 3360 – 3380
Do not trade here. This zone will show if trend changes. Wait for clear confirmation.
🟢 Buy Zone: 3300 – 3285
Look for price rejection and strong buying signs before buying here.
🟢 Deep Buy Zone: 3265 – 3272
Only buy here if price goes below 3280 and shows strength.
4. What to Do
Current price is about 3323.
If price goes above 3332, watch the sell zone 3345–3352 for a short trade.
If price drops below 3332, expect a move down to the buy zone 3300–3285.
Do not buy above 3360 without a clear trend change.
Be patient and wait for good signals.
5. Important Levels
Zone Price Range Notes
Sell Zone 3345 – 3352 Best short zone
Flip Zone 3360 – 3380 Wait and watch, no trades
Buy Zone 3300 – 3285 Good buy zone
Deep Buy Zone 3265 – 3272 Last buy chance
📣 If you like clear and simple plans, please like, comment, and follow
I’m part of Trade Nation’s Influencer Program and get paid to use their charts.
Gold Short Term OutlookGold dipped into the Support Zone but failed to sustain the breakdown below it. After briefly breaking below the zone, price has rebounded and is now attempting a short-term recovery.
However, structure remains bearish, with price trading below both the 50MA and 200MA, signalling continued downside pressure unless momentum shifts.
For bullish momentum to continue, we need to see a clean break and hold above $3,330, which may open the path toward $3,346, then $3,361.
If the move up doesn’t hold, the next reaction is expected near key support.
🔑 Key Levels:
Resistance:
$3,330 • $3,346 • $3,361 • $3,375
Support:
$3,306 • $3,287 • $3,271 • $3,242
📌 Stay patient and wait for confirmation before committing to a direction.

SPY/QQQ Plan Your Trade For 6-24 : Post Market UpdateThis post-market update highlights the weakening volume while my primary proprietary modeling system continues to stay BULLISH.
The markets are really quite interesting right now. Weakening volume in this Gapping uptrend, today, suggests traders are not buying into the ceasefire between Iran and Israel.
Additionally, the move in metals suggests a PANIC phase has setup in the US markets.
This type of panic phase typically leads to selling of assets and moving capital into CASH.
I suggest traders continue to prepare for a moderate melt upward trend over the next few days - but be prepared for any potential breakdown (possibly trying to FILL THE GAP).
This market appears to be running on fumes.
While I believe Trump's policies will lead to a stronger bullish price trend over the next few years, these disruptions and the potential for consumers to pull away from spending/economic activity over the second half of 2025 is still very real.
Buckle up.
At this point, hedge your trades, move some capital into CASH and prepare for bigger price volatility as we move into July 2025.
Get some.
#trading #research #investing #tradingalgos #tradingsignals #cycles #fibonacci #elliotwave #modelingsystems #stocks #bitcoin #btcusd #cryptos #spy #gold #nq #investing #trading #spytrading #spymarket #tradingmarket #stockmarket #silver

Gold Holding Strong – Eyes on $3400 and Beyond! (READ)By analyzing the gold chart on the 4-hour timeframe, we can see that after our last analysis, the price corrected down to $3341, then rallied back up to $3399. Currently, gold is trading around $3373, and if it manages to hold above $3355, we can expect further upside movement.
Potential bullish targets are $3400, $3417, $3450, and $3468.

Gold Trading Analysis and Strategies for Sideways Decline MarketAfter Trump announced a comprehensive ceasefire agreement between Israel and Iran, market risk aversion significantly cooled, and gold prices plunged by more than $30 in early trading. Although the stability of the ceasefire agreement remains doubtful, the rebound in risk appetite has dominated market trends, with stock markets rebounding, oil prices falling, and demand for safe-haven assets declining.
From a technical perspective, the moving average system on the daily chart of gold shows an intertwined state, indicating a relative balance between bulls and bears. The current key resistance above is near 3350, which is an important psychological threshold. If effectively broken, it may open up upward space; the lower support is focused on the 3285-3290 range, which is the lower edge of the May consolidation platform. A break below this level may intensify correction pressure. The loss of the midline in the 4-hour chart further confirms the short-term weak structure, providing technical support for the downward trend.
XAUUSD
sell@3330-3340
tp:3320-3310
buy@3285-3290
tp:3310-3320
Investment itself is not the source of risk; it is only when investment behavior escapes rational control that risks lie in wait. In the trading process, always bear in mind that restraining impulsiveness is the primary criterion for success. I share trading signals daily, and all signals have been accurate without error for a full month. Regardless of your past profits or losses, with my assistance, you have the hope to achieve a breakthrough in your investment.

Elliott Wave Analysis – XAUUSD June 24, 2025
🌀 Wave Structure
Looking at the H1 chart during the Asian session today:
+ Price broke below the previous low at 3341, invalidating the idea that Friday’s rally marked the beginning of a new uptrend.
+ Instead, the rally appears to be forming a wave X in a larger WXY corrective structure.
+ Given the current complex corrective pattern, it’s challenging to precisely define the exact wave shape and targets.
🔻 Wave Y Structure:
+ The price action suggests the formation of a 5-wave decline, with the market currently in wave 4.
+ Wave 4 target zone: 3357 – 3363 → Sell zone.
+ After completing wave 4, we expect a continuation of the downtrend via wave 5, with a target around 3327 – 3324 → Buy zone.
+ Once wave 5 completes, we anticipate at least a corrective upward retracement, with targets at 3363 – 3376 (these are the TP levels for the buy trade).
⚡️ Momentum Analysis
+ D1 timeframe: Momentum is turning bullish, suggesting a potential rally lasting around 5–8 D1 candles after wave 5 finishes.
+ H4 timeframe: Momentum is declining and may enter oversold territory within 1–2 candles, supporting the completion of wave 5.
+ H1 timeframe: Momentum is rising and approaching overbought levels, indicating a likely end of wave 4 within 1–2 H1 candles.
📌 Trade Plan
🔹 SELL ZONE: 3363 – 3365
+ SL: 3373
+ TP1: 3342
+ TP2: 3330
🔹 BUY ZONE: 3327 – 3324
+ SL: 3317
+ TP1: 3342
+ TP2: 3363
+ TP3: 3376
+ Important Note:❗️
- If price reaches these zones with a Mazuboru candle (long-bodied candle with no wick) and fast volatility, do not enter immediately.
- Wait for the candle to close. If the zone breaks, keep an eye on the next support area around 3313 for potential reactions.

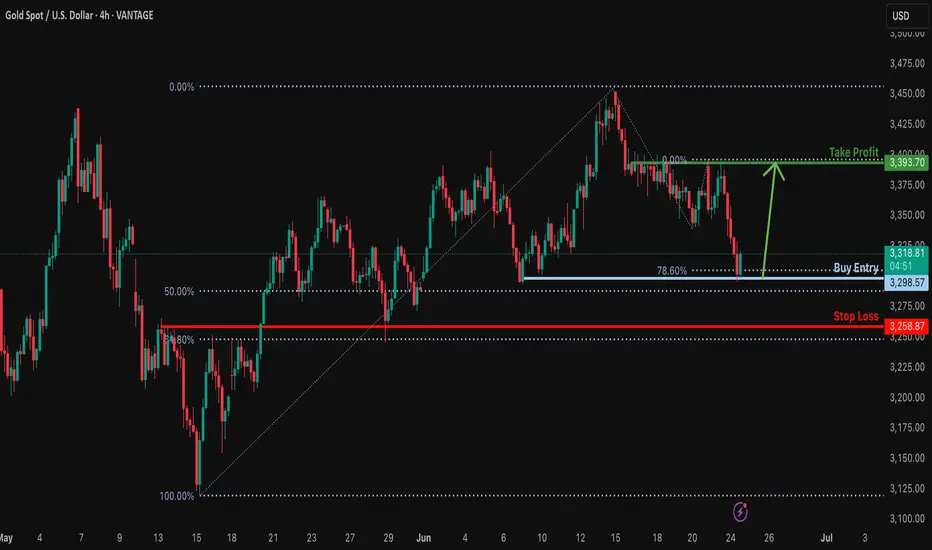
Bullish bounce off pullback support?XAU/USD is reacting off the support level which aligns with the 78.6% Fibonacci projection and the 50% Fibonacci retracement and could rise from this level to our take profit.
Entry: 3,298.57
Why we like it:
There is a pullback support level that lines up with the 78.6% Fibonacci projection and the 50% Fibonacci retracement.
Stop loss: 3,258.87
Why we like it:
There is an overlap support level that lines up with the 61.8% Fibonacci retracement.
Take profit: 3,393.70
Why we like it:
There is a pullback resistance level.
Enjoying your TradingView experience? Review us!
Please be advised that the information presented on TradingView is provided to Vantage (‘Vantage Global Limited’, ‘we’) by a third-party provider (‘Everest Fortune Group’). Please be reminded that you are solely responsible for the trading decisions on your account. There is a very high degree of risk involved in trading. Any information and/or content is intended entirely for research, educational and informational purposes only and does not constitute investment or consultation advice or investment strategy. The information is not tailored to the investment needs of any specific person and therefore does not involve a consideration of any of the investment objectives, financial situation or needs of any viewer that may receive it. Kindly also note that past performance is not a reliable indicator of future results. Actual results may differ materially from those anticipated in forward-looking or past performance statements. We assume no liability as to the accuracy or completeness of any of the information and/or content provided herein and the Company cannot be held responsible for any omission, mistake nor for any loss or damage including without limitation to any loss of profit which may arise from reliance on any information supplied by Everest Fortune Group.
Wave 2 Corrective Phase Over!Now that Wave 2 correction is over or very close to completion, I am now waiting for an impulse move up by buyers.
Following this impulse move, I will look for a ‘Minor Wave 2 Correction’, where I will start looking for entry points to buy Gold.
What’s your bias on Gold & what do you think the next major move is?

GOLD 4H CHART ROUTE MAP UPDATEHey Everyone,
Great day on the markets once again. This is an update on our 4H chart idea from Sunday, also playing out perfectly.
We started with our bullish target hit at 3375 with no cross and lock confirming the rejection into completing our bearish target at 3306. We will now need to see ema5 cross and lock on either weighted level to determine the next range.
We will keep the above in mind when taking buys from dips. Our updated levels and weighted levels will allow us to track the movement down and then catch bounces up.
We will continue to buy dips using our support levels taking 20 to 40 pips. As stated before each of our level structures give 20 to 40 pip bounces, which is enough for a nice entry and exit. If you back test the levels we shared every week for the past 24 months, you can see how effectively they were used to trade with or against short/mid term swings and trends.
The swing range give bigger bounces then our weighted levels that's the difference between weighted levels and swing ranges.
BULLISH TARGET
3375 - DONE
EMA5 CROSS AND LOCK ABOVE 3375 WILL OPEN THE FOLLOWING BULLISH TARGETS
3439
EMA5 CROSS AND LOCK ABOVE 3439 WILL OPEN THE FOLLOWING BULLISH TARGET
3499
EMA5 CROSS AND LOCK ABOVE 3499 WILL OPEN THE FOLLOWING BULLISH TARGET
3561
BEARISH TARGETS
3306 - DONE
EMA5 CROSS AND LOCK BELOW 3306 WILL OPEN THE SWING RANGE
3236
3171
EMA5 CROSS AND LOCK BELOW 3171 WILL OPEN THE SECONDARY SWING RANGE
3089
2995
As always, we will keep you all updated with regular updates throughout the week and how we manage the active ideas and setups. Thank you all for your likes, comments and follows, we really appreciate it!
Mr Gold
GoldViewFX
