XAUUSD – Selling Pressure Intensifies, the 3,300 USD 1. Overall Technical Context
The XAUUSD daily chart shows that gold is under bearish pressure after failing to break the key confluence resistance at 3,385–3,399 USD, which includes:
- Fibonacci retracement levels 0.5 – 0.618
- A strong supply zone that has been repeatedly rejected
- A minor swing high formed near 3,451 USD
2. Recent Price Behavior
Price has broken below the short-term support at 3,331 USD and is now retesting the Key Lever zone around 3,300 USD, which is a confluence of:
- Previous June swing low
- Fibonacci 0.618 retracement of the latest upward move from 3,221 to 3,451
- A key previous support zone, potentially forming the right shoulder of a head and shoulders structure
If this zone breaks decisively, XAUUSD may continue falling toward the 3,270 – 3,250 USD area, where strong liquidity was previously found.
Key Technical Zones
Resistance:
3,385 – 3,399: Fibo 0.5–0.618 zone and recent swing high
3,435 – 3,451: Major swing high and starting point of the latest correction
Support:
3,300 – 3,320 (Key Lever): Major support currently being tested
3,271 – 3,250: Next support if the current zone fails
Suggested Trading Scenarios
Scenario 1 – Buy on Confirmation at Key Lever
Entry: 3,300 – 3,297 (Key Lever zone)
Stop-loss: Below 3,292
Take-profit: 3,310 – 3,315 – 3,320
Condition: Wait for a clear reversal candlestick pattern or signs of selling absorption on H4/H1
Scenario 2 – Sell if Price Breaks Below Key Lever
Entry: Below 3,290 (after clear break of Key Lever)
Stop-loss: Above 3,298
Take-profit: 3,280 – 3,270
P.S. XAUUSD is currently sitting at a decisive support area around 3,300 USD. The medium-term trend will depend on whether this zone holds. Traders are advised to closely watch price action on the H1–H4 timeframes before executing entries.
Follow for more daily trading strategies and don’t forget to save this analysis if you find it helpful for your trading plan.
Analyst: @Henrybillion
Xauusd(w)

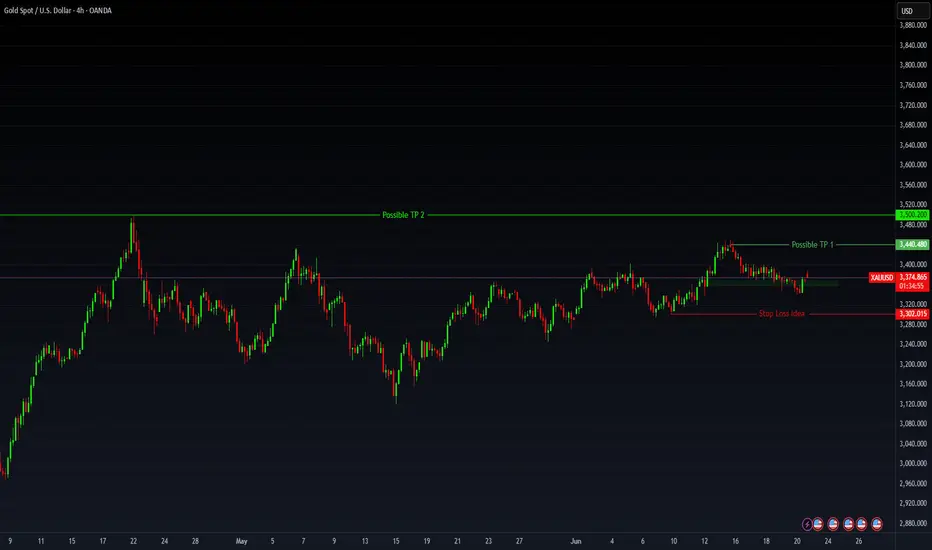
GOLD - WAVE 5 BULLISH TO $3,734 (UPDATE)Here’s an updated analysis, as ‘Minor Wave 2’ is still forming & pulling back deeper into the $3,285 zone.
We’ll be keeping an eye around this zone for a slow down in bearish momentum & if we get it, we’ll enter a buy trade. If momentum doesn’t slow down, we will let it go towards $3,245 & invalidate bullish structure. That way we know to look for sell’s📉
TP1: $3,374
TP2: $4,300

Analysis and layout of the latest gold trend in the evening📰 Impact of news:
1. The ceasefire agreement reached earlier did not take effect, and Trump believed that both sides violated the agreement
2. Federal Reserve Chairman Powell delivered a speech 3 hours later
📈 Market analysis:
After falling below the 3300 mark, gold hit the 3295 line and then rebounded. However, there are too many long orders at the current high level of gold, and the market will not rise easily. The current international situation is so tense, and gold is still slowly declining. It is difficult to rebound sharply in this situation. In the short term, focus on 3290-3280 below. If effective support is obtained, you can go long and look towards 3300-3310. If it falls below the support line of 3290-3280, the downward channel of gold will be opened and it is expected to reach 3265. At the same time, pay attention to the 3328-3338 resistance range on the upside. If the first rebound in the evening encounters pressure and resistance here, you may consider shorting.
🏅 Trading strategies:
SELL 3328-3338-3400
TP 3310-3300-3295
BUY 3290-3280
TP 3300-3310
If you agree with this view, or have a better idea, please leave a message in the comment area. I look forward to hearing different voices.
TVC:GOLD FXOPEN:XAUUSD FOREXCOM:XAUUSD FX:XAUUSD OANDA:XAUUSD

GOLD - Price can rise in channel to $3495 resistance lineHi guys, this is my overview for XAUUSD, feel free to check it and write your feedback in comments👊
After price started to trades inside triangle, it made an impulse up, breaking two levels, after which turned around.
Price dropped to $3195 level, breaking resistance level, and made a first gap, after which rose to resistance line.
Then Gold in a short time declined to support line, making a two gaps again and then bounced up from support line.
Gold exited from triangle and continued to move up inside rising channel, where it first made a correction.
In channel, price grew higher than $3400 level, but recently turned around and fell to support line.
Now, I expect that Gold can bounce from this line and rise to $3495 resistance line, breaking resistance level.
If this post is useful to you, you can support me with like/boost and advice in comments❤️
Disclaimer: As part of ThinkMarkets’ Influencer Program, I am sponsored to share and publish their charts in my analysis.

Gold’s Geopolitical Launchpad: Eyes on $3,500+🟡 GOLD - Macro Fuel Meets Technical Momentum Trade Levels Inside
Gold continues to flex its haven status as geopolitical tensions flare once again—this time triggered by reports of a U.S. airstrike on Iranian nuclear facilities. That headline risk has lit the fuse under precious metals, and the reaction in futures markets has been swift.
Friday’s intraday washout—largely driven by hopes that President Trump would opt for diplomacy—was short-lived. The strong recovery into New York close left a long lower shadow, signaling buyers are already pricing in weekend escalation risk.
💡 Macro View:
- Analysts project a move toward $3,500–$3,700, driven by a twin-engine of geopolitical instability and sticky inflation.
- Central banks are staying long; ETF inflows are ticking up—this isn’t just speculative hype.
- Goldman’s base case: $3,700 EOY, $4,000 by mid-2026. Recession/volatility scenarios stretch targets up to $4,500.
🔧 Technical Setup:
- Bias across all time frames remains bullish. Open float pressure is stacking with long-side conviction.
- Key long trigger zone sits between $3,369–$3,375—I’m watching for confirmation here.
- Profit targets:
- First resistance: $3,440.48
- Second target: $3,500 zone
- Stretch: $3,520+ if volatility expands
HelenP. I Gold may continue to decline to support levelHi folks today I'm prepared for you Gold analytics. After dropping from the support zone, the price of Gold found temporary support near the trend line and started to rise again. The upward movement was sharp and even created a gap while breaking through the previous support level, which then acted as resistance. For some time, the price hovered around this resistance area but failed to gain enough strength to break higher. Eventually, Gold pulled back to the trend line and began consolidating within a triangle pattern. Inside this structure, it managed to break above the resistance zone again, but this breakout turned out to be false. The price quickly reversed and dropped, breaking through the resistance level and exiting the triangle to the downside. This breakdown also shows that the bullish momentum has weakened significantly. Now, Gold is trading near the trend line again, showing hesitation and a lack of strong bullish continuation. Given this technical behavior, I expect a small rise toward the trend line, followed by a continued drop toward the support level at 3320. That’s the area I’m watching as my current goal. If you like my analytics you may support me with your like/comment ❤️
Disclaimer: As part of ThinkMarkets’ Influencer Program, I am sponsored to share and publish their charts in my analysis.

XAUUSD - Prop firm or your own account? - Trading Psychology"$100K Funded? Or $1K account you own?? Welcome to the Inside Battle of Every Trader"
You want capital, freedom and win big.
But the question is: do you do it with your own money, or someone else’s?
You’ve got the $100K funded dream on one side. Big leverage, strict rules, payout drama.
And on the other side? Your own $1K account. Zero limits, zero support, and a whole lot of emotional damage.
This is a breakdown of what really happens behind both paths — the adrenaline, the self-sabotage, the mind games, and the payouts that sometimes never come.
The Prop Firm Path: Pass, Survive, Then Pray
Phase 1: You trade with hunger.
You’ve got the goal in sight, and every move is calculated. You’re alert, focused, mechanical. The structure helps. The rules feel like a challenge. Everything feels possible.
Phase 2: You trade with fear.
Now you’re tiptoeing. The target’s smaller, but the pressure is suffocating. Hesitation.Overthink. You play defense — and that’s when you lose. You stop executing your edge and start trading to avoid failure.
Funded: The real test begins.
You go live, you trade well, you hit payout… and suddenly the firm has a problem. A new rule is “suddenly” enforced. A clause is reinterpreted. A delay happens. You’re told to wait. Or worse — your account is shut with no warning.
That’s the part no one prepares you for: the waiting, the silence, the mental snap.
Passing isn’t the end. It’s barely the middle.
✅ So, Should You Go Prop? Here's What You Need to Know
Yes — if you’re ready to treat this like a hostile contract.
If you’re trading a prop account, you are trading their rules, their terms, their timing. You are not a partner — you are a performer. And they are very comfortable pulling the plug.
If you do it:
• Be colder than the system.
• Read every rule twice.
• Trade Phase 2 like a surgeon — no ego, no rush.
• And never treat a payout like it's guaranteed — treat it like a fight you have to win more than once.
You don’t just pass. You survive.
And if you’re not ready to survive, stay out.
🚨 Do not forget — It’s Simulated Capital. And That’s the Game.
Let’s not pretend it’s hidden:
You’re NOT TRADING REAL MONEY. You’re executing on a simulated account that mirrors real conditions — nothing more.
When you get paid, it’s not because you “grew” capital. It’s because you performed better than the masses who failed their challenges and fed the payout pool.
This isn’t shady. It’s the model — and it works because most traders lose.
So don’t delude yourself into thinking you’re managing funds.
You’re monetizing discipline inside a challenge-based system.
And if you know how to work that system? You get paid.
If you don’t? You become someone else’s payout.
🔓 Trading Your Own Money: Real Freedom or Emotional Damage?
With your own capital, there’s no one watching — and no one helping.
You set the rules. You decide how aggressive, how cautious, how chaotic.
But the second you click “Buy,” your psychology comes for you like a debt collector.
Because real trading isn’t what’s on the screen — it’s what’s happening between your ears.
You lose your money, you lose your confidence.
You win big, and suddenly you think you’ve figured out the market — until the market slaps you for it.
There’s no one to blame, and that makes it ten times harder.
But here’s the part no one can take away from you: every lesson is yours.
Every win is clean. Every loss hits deep. And if you make it — you really made it.
💡 How to Make Self-Funded Work for You
✅ Start with small capital — but also invest in your trading education.
Join a group that teaches you how to trade, not signal groups that just give you orders when to buy or sell, without explaining why.
✅ Join a real trading community.
Surround yourself with people who post actual breakdowns — who teach, not flex.
Avoid ego chats. Avoid circus chats. Find people who show the why, not just the entry.
(If you’re reading this, you already found the right space.)
✅ Focus on fixing mistakes — not faking wins.
Nobody cares how many pips you caught if you blew 5 trades getting there. Get real about your risk management and lot size.
✅ Learn to stop after a win.
Don’t feed your dopamine. Protect your equity. Walk away while you’re still in control.
✅ Respect your losses. Don’t chase them.
Red days don’t destroy traders. Revenge trading does. Stop. Reset. Come back sharper.
✅ If you’re not paying yourself yet, don’t panic.
Some seasons are for building, not cashing out. Don’t force results just to feel good — let the system earn before it pays.
🔄 The Hybrid Advantage: Rent the rules. Own the skill.
Some traders don’t pick a side.
They use prop firms like a hired weapon — fast, effective, disposable and
Personal accounts like a vault — protected, scalable, sacred.
They switch between them based on market conditions, mental load, and long-term goals.
You don’t need to be loyal to a style just be loyal to your results.
🧠 Final Word:
Trading becomes real, sustainable, and successful only when your mind is at peace with the path you chose.
If you wake up anxious about your account — if you feel pressure before you even open the chart — that’s not discipline, that’s misalignment.
This doesn’t mean trading should feel easy. But it should feel right.
You should wake up curious to read price, not terrified to take a trade.
Whether you trade $100K or $1K, the real account is always in your head.
You should feel like this work belongs to you — not like you’re trying to survive someone else’s idea of success.
Whether you trade with a prop firm or your own account, or both, the goal is the same:
Mental clarity. Emotional control. Strategic confidence. You’ll know you’re on the right path the moment the stress fades — and the obsession becomes patience, structure and joy with success.
If this lesson helped you today and brought you more clarity:
Drop a 🚀 and follow us✅ for more published ideas.
Gold prices rebounded weakly after a sharp plunge!After Trump announced that Israel and Iran had reached a comprehensive ceasefire agreement, market risk aversion significantly cooled, and gold prices plunged by more than $30 in early trading. From a technical perspective, the moving average system of gold's daily chart shows an intertwined state, with relatively balanced bullish and bearish forces. Currently, the key resistance above is near 3350, which is an important psychological threshold. If effectively broken through, it may open up an upward space; the support level below focuses on the 3285-3290 range, which is the lower edge of the May platform (shock platform). If broken, it may exacerbate pullback pressure. The loss of the middle 轨 (middle track) in the 4-hour chart further confirms the short-term weak structure, providing technical support for the downward trend. It is recommended to go long near 3285-3290 during the pullback in the evening, but currently, gold continues to decline following the trend.
you are currently struggling with losses,or are unsure which of the numerous trading strategies to follow,You have the option to join our VIP program. I will assist you and provide you with accurate trading signals, enabling you to navigate the financial markets with greater confidence and potentially achieve optimal trading results.
Trading Strategy:
buy@3290-3295
TP:3335-3340

Will the 3300 support hold today?Due to the sudden ceasefire agreement between Iran and Israel today, the gold market quickly flipped from bullish to bearish — when gold tested the 3300 support level just now, it rebounded near 3315 📈.
It may challenge the 3290-3300 support range again later: if it effectively breaks below, the next target is the strong support at 3265, and it may eventually dip to 3200 before starting a rebound 🔄.
If the breakout fails, it may consolidate near 3330, waiting for further market guidance 📊
⚡️⚡️⚡️ XAUUSD ⚡️⚡️⚡️
🚀 Sell@3330 - 3320
🚀 TP 3310 - 3305

GOLD - WAVE 5 BULLISH TO $3,734 (VIDEO UPDATE)Here’s an updated video analysis, as ‘Minor Wave 2’ is still forming & pulling back deeper into the $3,285 zone which I mentioned for you all last week.
We’ll be keeping an eye around this zone for a slow down in bearish momentum & if we get it, we’ll enter a buy trade. If momentum doesn’t slow down, we will let it go towards $3,245 & invalidate bullish structure. That way we know to look for sell’s 📉
TP1: $3,374
TP2: $4,300

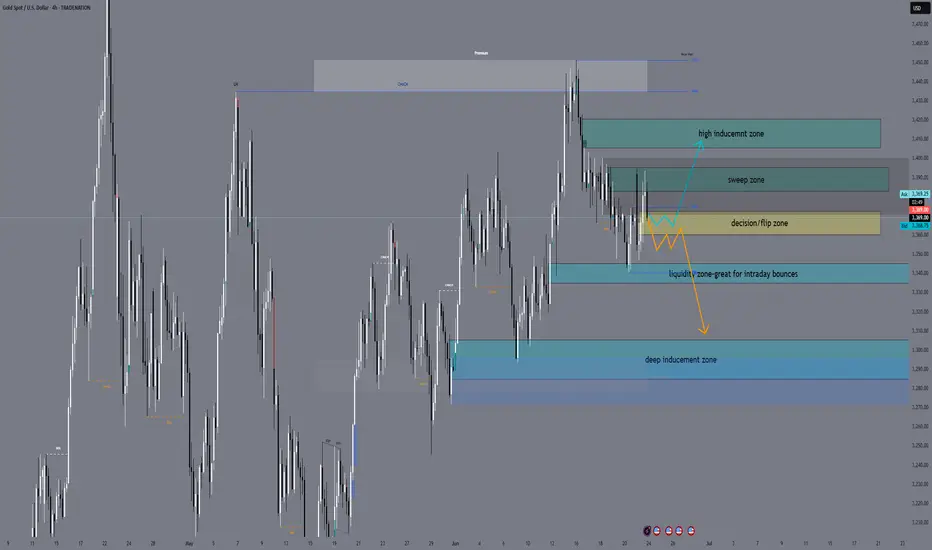
XAUUSD Daily Sniper Plan – June 24, 2025“Snipers wait. Structure tells the story.”
Hello traders! The market is stuck between the FOMC high at 3452 and the confirmed low at 3340. Price is compressing under H1 supply and above a key liquidity pocket. Here's your full plan with all sniper zones — now including a decision zone for intraday confirmation.
📰 Macro + Fundamental Context
Powell Testimony + multiple FOMC speeches today → high potential for dollar-driven volatility.
Inflation concerns and hawkish tone expected → short-term gold bearish pressure unless structure reclaims 3415+.
Smart money likely hunting liquidity both below 3340 and above 3400.
🔸 HTF Structure Summary (D1 → H4 → H1)
D1: Consolidation between 3452 and 3340. No new BOS.
H4: LL formed at 3340. LH not confirmed. Market is compressing under resistance.
H1: CHoCH + BOS confirmed. Current price sits in mid-range.
🔍 Sniper Entry Zones
🟥 Sell Zone 1: 3382–3395
H1 supply zone with previous rejection.
Includes order block + FVG.
Valid for new short entries if price returns and rejects.
🟥 Sell Zone 2: 3406–3420
High-risk spike zone from FOMC.
Only valid during fast, news-driven price movement.
Not a default entry unless confirmed rejection.
🟨 Decision Zone (Flip Area): 3360–3372
This is the key intraday flip level.
If price stays below, sell zones remain valid.
If price closes above, short bias is invalid and market may aim higher.
Use this zone to confirm bias before entering from either side.
🟩 Buy Zone 1: 3335–3345
Strong demand under equal lows.
OB + small imbalance on M15.
Valid for intraday long setups if confirmed with bullish price action.
🟦 Buy Zone 2: 3305–3285
H4 demand zone with major liquidity below.
Deep reversal area — only valid if price breaks 3340.
Smart money may be waiting here.
📌 Key Levels Summary
Zone Type Price Range Explanation
🔺 Premium OB 3450–3480 Daily supply zone
🟥 Sell Zone 1 3382–3395 Active H1 supply
🟥 Sell Zone 2 3406–3420 FOMC wick inducement
🟨 Flip Zone 3360–3372 Decision area — confirm bias
🟩 Buy Zone 1 3335–3345 Demand under equal lows
🟦 Buy Zone 2 3305–3285 H4 demand + deep liquidity
📣 Final Notes
📌 The market is at a critical moment. The flip zone (3360–3372) will decide tomorrow’s control: bear continuation or deeper retracement.
Watch price at the zone. Let the structure speak. Trade only where the logic is clean.
👁 Good luck in the market tomorrow, traders!
— GoldFxMinds
🟨 Disclosure: I am part of TradeNation’s Influencer Program and receive a monthly fee for using their TradingView charts in educational work.
GOLD: Long Signal Explained
GOLD
- Classic bullish formation
- Our team expects pullback
SUGGESTED TRADE:
Swing Trade
Long GOLD
Entry - 3306.4
Sl - 3294.6
Tp - 3332.6
Our Risk - 1%
Start protection of your profits from lower levels
Disclosure: I am part of Trade Nation's Influencer program and receive a monthly fee for using their TradingView charts in my analysis.
❤️ Please, support our work with like & comment! ❤️

XAUUSD: Market strategy and analysis on June 24Gold technical analysis
Daily chart resistance 3400, support 3286
4-hour chart resistance 3345, support 3304
1-hour chart resistance 3335, support 3315
B2 bombing was carried out over the weekend, the scale of the war expanded, and the ceasefire was directly stopped on Monday. The news is changing at any time. Now the market risk aversion has subsided, and the gold price has fallen rapidly!
The 3400 mark has been under pressure for many times and failed to break through. With the news of the ceasefire agreement, the short-term correction pressure has increased.
Today, gold directly fell below the 3340 support. The loss here means that the shorts will further develop momentum downward. Next, gold will focus on the second highest point of the 1-hour line rebound 3357 as a defense point. If it continues to fall and test the 3300 integer mark, you can try to buy.
SELL:3340near
BUY:3300near

Gold prices rebound weakly after sharp fallFrom a technical perspective, the gold daily moving average system is intertwined, and the long and short forces are relatively balanced. The current key resistance above is near 3350, which is an important psychological barrier. If an effective breakthrough is achieved, it may open up the upward space; the support below focuses on the 3285-3290 line, which is the lower edge of the May oscillation platform. If it falls below, it may increase the pressure of the correction. The loss of the middle track in the 4-hour chart further confirms the short-term weak structure and provides technical support for the downward trend. It is recommended to go long near the 3285-3290 level. At present, gold continues to fall in line with the trend.
Operation strategy:
1. It is recommended to go long in the 3287-3292 area of gold, with a stop loss at 3280 and a target of 3320-3340.

Gold Challenges 2025 Trendline – Are We Breaking Lower?Following renewed Middle East ceasefire hopes and signs of exhausted buying momentum on the gold chart, the yellow metal has pulled back toward a key trendline—connecting higher lows since December 2024—currently near the 3,300 level.
If gold holds above 3,300 and continues to respect this broader trend support, the bullish trajectory may re-align, with potential upside targets at 3,400, 3,450, and 3,500.
However, a decisive close below 3,300 could signal a deeper corrective move. In that case, further downside may unfold toward 3,150, 3,050, 2,950, and 2,800, in line with the 1.272 and 1.618 Fibonacci extension levels derived from the April 2025 high, May 2025 low, and June 2025 high.
- Razan Hilal, CMT

Trade Idea: XAUUSD Short (SELL LIMIT) 1. Trend Alignment: H1 shows a clear down-trend — lower highs at 3446 → 3397 → 3347. SMAs on H1/M15 have turned down.
2. High-Probability Pullback: Price has broken the 3340 support twice and pulled back. Resistance here is offering a tight stop and plenty of room to TP.
3. Structural SL: Stop sits just above the prior swing high (~3350–3352)
Entry
Sell Limit @ 3340.37
Prior day low (now resistance) on H1 & M15
Stop Loss
3352.00
Just above the swing high around 3350–3351
Take Profit
3293.07
Invalidation
15 min candle close < 3310
Time Expiry
8:30 AM PST
Cancel if not triggered by then
FUSIONMARKETS:XAUUSD

XAUUSD Beginning of a Trend Reversal? Bearish Move IncomingGold is showing signs of potential downside pressure on the 4-hour chart. After a rejection from the upper volatility band and a failure to sustain bullish momentum above the dynamic EMA cloud, price has rolled over and is now trading below the midline support area.
🔻 Bearish Structure Developing:
Price rejected strongly from the upper gray zone (Resistance band).
A new lower high has formed, aligning with bearish market structure.
Candles are trading under the red-to-blue transition EMA ribbon, indicating increasing bearish sentiment.
🎯 Trade Setup:
Entry: Near 3,365
SL: Above the recent high near 3,406
TP: Targeting the lower band support around 3,300 – 3,323

GOLD falls after Trump's statement, but skepticism remainsOn Tuesday (June 24) in the Asian market, spot OANDA:XAUUSD continued to decline. The current price of gold is around 3,340 USD/ounce, down sharply by about 30 USD. Gold traders are awaiting congressional testimony from Fed Chairman Jerome Powell as the ceasefire between Iran and Israel takes place.
On Monday evening local time, US President Trump announced that Israel and Iran have reached a complete agreement to achieve a comprehensive ceasefire. After Trump announced the news, spot gold prices fell sharply by more than 30 USD in the early morning trading session in Asia on Tuesday, which lasted until the time of writing.
Federal Reserve Chairman Jerome Powell will deliver his semiannual monetary policy report before the House Financial Services Committee on Tuesday.
Looking ahead, all eyes will be on Federal Reserve Chairman Jerome Powell’s two-day congressional testimony starting on Tuesday for fresh clues on the timing of the next rate cut.
The market is now pricing in a 21% chance of a Fed rate cut next month, up from a 14.5% chance on Friday, according to CME Group’s FedWatch tool.
Additionally, markets will continue to closely monitor the Iran-Israel conflict to see if the ceasefire can hold. The Israeli military continues to report that Iran has launched ballistic missiles into Israel.
Technical Outlook Analysis OANDA:XAUUSD
Gold is down and operating around the EMA21 moving average and technically, gold is currently in the best support area. Specifically, gold is operating at the EMA21, the technical indicator is noted as an important support for the short-term uptrend, followed by the horizontal support of 3,320 USD. Combined with the price action position, the Relative Strength Index (RSI) is above 50, and 50 is now acting as a support in terms of momentum for the possibility of price increase.
However, if gold sells below the 0.382% Fibonacci retracement level, it could be bearish, with the next target being the 0.50% Fibonacci retracement level at $3,228. Therefore, the area of the $3,300 base point is a very important support area for the long-term uptrend.
Intraday, with the current position, gold can still increase in price with the short-term target at $3,371 followed by the $3,400 base point.
Notable positions will also be listed as follows.
Support: $3,300 – $3,292
Resistance: $3,350 – $3,371
SELL XAUUSD PRICE 3407 - 3405⚡️
↠↠ Stop Loss 3411
→Take Profit 1 3399
↨
→Take Profit 2 3393
BUY XAUUSD PRICE 3304 - 3306⚡️
↠↠ Stop Loss 3300
→Take Profit 1 3312
↨
→Take Profit 2 3318

GOLD 2 Best Places For Sell Very Clear , Don`t Miss 300 Pips !Here is my opinion on Gold at the moment after the price moved very hard to downside as i mentioned in the last update , now we have a very good 2 places to sell it again , the first one @ 3326.00 , it`s a very good place to sell it cuz it was a very good support and the price break it and now it will play as a good res so we can sell from it , and if the price go higher we can sell from area between 3350 : 3345.00 , it will be a great place to sell it also , and if the highest place who force the price to downside we can add another sell entry from 3326.00 if we have a daily closure below it .

High Probability BUY Zone at The Edge📍 XAUUSD – High Probability BUY Zone at The Edge
Gold is currently reacting at a high probability BUY area, supported by multiple technical confluences:
✅ $3,300 Round Number: Psychological level and historical reaction zone
✅ Completion of 2nd Bearish Leg: A classic two-leg correction often signals exhaustion
✅ Retest of Uptrend Boundary: Long-term ascending trendline that has supported price since March
📌 Entry: Current price zone
🎯 TP1: Local highs ($3,353)
🎯 TP2: Mid-channel or upper resistance zone ($3,398)
❌ SL: 3263
This is a textbook trend continuation setup — the structure remains bullish unless proven otherwise.
Wait for confirmation or manage your risk accordingly.
—
#XAUUSD #Gold #ForexTrading #MJTrading #TechnicalAnalysis #BuyZone #SwingTrade #SupportZone #TrendlineSupport #SmartMoney #PriceAction #ForexSignals #CommodityTrading #MarketStructure #RiskReward #ChartSetup #ForexCommunity

GOLD BUY BIAS • Demand Zone (Grey Box):
Price tapped into a clear demand/support zone around 3300–3310, showing rejection wicks and slowing bearish momentum.
• Reversal Expectation:
Bullish projection drawn on the chart suggests a potential rally if price holds above this zone.
• Upside Targets:
• First target: ~3390 (previous structure high)
• Next: ~3410–3440 (liquidity sweep area)

Everybody loves Gold Part 5Keeping it steady and reasonable
Part 5 weekly path is as shown.
Here's a breakdown of trading dynamics:
1. Expecting price to break past green line, level of significance (LOS) for continuation down
2. Price might bounce back for which; will be looking for a continuation from +50/+100 or +150pips to the downside
3. Will be looking for double tops/bottom along the way: Last week saw classic double top formed around level of significance (LOS)
As always price action determines trades
