GoldKey Data Points:
Current Price: 3,309.065 USD
Open: 3,358.435 USD
High: 3,363.900 USD
Low: 3,307.295 USD
Change: +1.77% (+59,760 points)
Volume: Not explicitly stated but implied by "1B" (likely 1 billion units).
Price Action & Technical Observations:
Trend:
The price is currently below the open (3,309.065 vs. 3,358.435), suggesting a pullback after an intraday high of 3,363.900.
The +1.77% daily gain indicates overall bullish momentum, but the candle shows rejection near highs (wick formation).
Support/Resistance Levels:
Resistance:
Immediate: 3,362–3,375 USD (previous highs/profit targets).
Strong: 3,406–3,425 USD (key profit levels).
Support:
Immediate: 3,288–3,265 USD (labeled "Entity" and "Profit" zones).
Strong: 3,250 USD (psychological level).
Profit Targets:
The chart marks three profit-taking levels:
3,323 USD (minor), 3,362 USD (mid), 3,406 USD (major).
This suggests traders are eyeing these levels for potential reversals or take-profit actions.
Volume & Momentum:
The "+59,760" change with "1B" volume implies strong buying interest, but the long upper wick hints at selling pressure near highs.
Potential Scenarios:
Bullish Continuation:
If price holds above 3,288–3,265 USD, a retest of 3,362–3,406 USD is likely.
Bearish Reversal:
A break below 3,265 USD could trigger a drop toward 3,250–3,225 USD.
Xauusd(w)


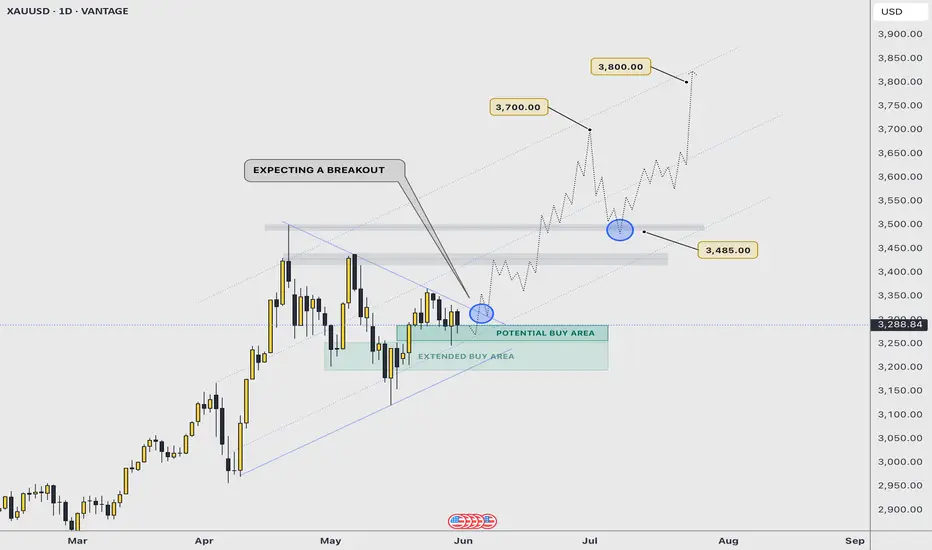
BREAKOUT SOON | $3700 - $3800 As illustrated, I’m visualising the next potential bullish continuation impulse that would take gold near the $4000 projected price.
In this idea, the path projected is based on the breakout of a rising symmetrical triangle that price formed; a strong bullish pattern that tends to be very effective when price successfully breaks out with strength.
On a fundamental aspect, things continue to hold the yellow metal on a positive route to maintain its bullish momentum and direction. Fed rates decision is getting close, and that is just the tip of the iceberg that’s going to move gold to record highs within weeks.
A key and major pivot area is near the $3200 - $3250 price range; so it’s possible we have one more attempt to break $3200.
—
GOOD LUCK
persaxu
Gold Falls to Two-Week Lows Gold fell to around $3,350 per ounce on Tuesday, its lowest level in two weeks, as the ceasefire reduced geopolitical stress. The truce announcement, set to begin with Iran immediately and Israel 12 hours later, cooled safe-haven demand. The metal’s recent run paused despite lingering tensions in the region.
Resistance is seen at $3,355, while support holds at $3,285.

gold on sell#XAUUSD price needs to fall below 3315 on M30 closure below there will target 3300-3290.
Entry on sell 3315, target 3300-3315, stop loss 3330.
Bullish needs to form a new zone to keep buying, breakout above 3334 on H1 cloud will continue buying.

Gold is about to break through 3400! On June 21, 2025 local time, U.S. President Trump announced that the U.S. had launched strikes against three Iranian nuclear facilities—Fordo, Natanz, and Isfahan—using six B-2 stealth bombers 😲. This move marked the formal intervention of the U.S. in the Middle East conflict, prompting the UN Security Council to convene an emergency meeting immediately. This underlies the core logic of our sustained "long gold" strategy last week: the geopolitical situation in the Middle East harbors the risk of escalating at any moment 🤯. If the Security Council fails to roll out direct solutions, gold, as a safe-haven asset, may continue its upward trajectory driven by market panic 📈.
The UN Security Council meeting on June 23, 2025 failed to break the deadlock, and the Middle East situation remains highly fluid. Given that the U.S. is highly unlikely to implement any solutions proposed by the Security Council, the regional crisis may deteriorate further 🚨
Gold is about to break through 3,400! 🌟
Accurate signals are updated every day 📈 If you encounter any problems during trading, these signals can serve as your reliable guide 🧭 Feel free to refer to them! I sincerely hope they'll be of great help to you 🌟 👇

XAUUSD: Post-Crash Buy Zone and Bullish SetupHere's a structured breakdown of today's #XAUUSD (Gold) trading idea, including key levels, wave structure, and risk/reward zones for both short-term and swing traders.
---
🔹 Key Technical Zones (H1 & H4 Charts)
Support Levels
- 3,303 USD – Key support on H4; potential false breakout area
- 3,324–3,327 USD – Wave 5 completion zone and high-probability buy area
- 3,337–3,343 USD – Entry zone for early bullish setups
- 3,340–3,345 USD – Clean long entry; targeting up to 3,450 USD
Resistance Levels
- 3,363–3,365 USD – Sell zone tied to wave 4/5 overlap
- 3,375–3,383 USD – Mid-range resistance; key for short-term profits
- 3,405–3,500 USD – Long-term bullish targets; includes ATH region
---
🔹 Wave Count (H1 Structure)
- Wave X – Recent sell-off ended a potential uptrend; suggests ongoing correction (WXY)
- Wave Y – 5-wave drop toward 3,363–3,365 USD; acting as a short-term sell zone
- Wave Z – Expected final leg down toward 3,324–3,327 USD (ideal buy zone)
- Retracement Setup – Anticipated bullish retrace post-wave 5, with targets back at 3,363–3,376 USD
---
🔹 Order Blocks & FVGs
Buy Zones
- 3,343–3,330 USD – FVG within an order block; strong bullish entry area
- 3,319–3,317 USD – Deep support with short-term target at 3,349 USD
Sell Zone
- 3,363–3,365 USD – Key area for short setups, with targets at 3,342–3,330 USD
---
🔹 Strategy & Key Takeaways
1. Bullish Structure Still Intact
- Rising channel remains valid on H4
- Holding 3,303 USD is critical for confirming bullish continuation
2. Trade Setup
- Long entries near 3,340–3,345 USD
- Target range: 3,450 USD and above
- Tight stops around 3,325 USD recommended for low-risk exposure
3. Wave Completion Zones in Play
- Monitor 3,324–3,327 USD (buy zone) and 3,363–3,365 USD (sell zone) for end-of-wave activity
4. Risk Management Is Key
- Scale into positions
- Respect intraday volatility and breakout traps

War breaks out again? The latest analysis and layout of gold📰 Impact of news:
1. The ceasefire agreement reached earlier did not take effect, and Trump believed that both sides violated the agreement
2. Federal Reserve Chairman Powell delivered a speech 3 hours later
📈 Market analysis:
At the 4H level: the Bollinger Band opening is enlarged, the MACD indicator double-line death cross is downward, the short-selling force is strengthened, but the RSI indicator rebounds after being oversold. Overall, there are obvious signs of a rebound in gold prices. At the hourly level: the gold price is in a downward channel, the Bollinger Bands are expanding, the MACD indicator is dead cross and the red bars are converging, and the short momentum has weakened. The RSI indicator rebounds from oversold, and the demand for spot gold rebounds is obvious. Therefore, we still hold long orders near 3320 in the short term. Short-term operation suggestion: go long when it stabilizes at 3325-3315, pay attention to the resistance range of 3370-3380 on the upside, and consider shorting when encountering resistance and pressure.
🏅 Trading strategies:
BUY 3325-3315
TP 3335-3345-3365
SELL 3370-3380
TP 3340-3330
If you agree with this view, or have a better idea, please leave a message in the comment area. I look forward to hearing different voices.
OANDA:XAUUSD FX:XAUUSD FOREXCOM:XAUUSD FXOPEN:XAUUSD TVC:GOLD

Gold continues to decline, can it still change the trend?Information summary:
Will the Fed cut interest rates in July? The latest statements of Fed officials have released a heavy signal. Fed Governor Michelle Bowman said that as long as inflationary pressures remain moderate, she will support a rate cut at the next policy meeting in July. At the same time, Trump has continued to put pressure on the Fed.
Next, investors need to pay attention to the testimony of Fed Chairman Powell on the semi-annual monetary policy report to the House Financial Services Committee today.
Market analysis:
Gold fell sharply today, directly breaking the key support level of 3350. From a 4-hour perspective, the MA moving average shows a short trend arrangement, and the MA5\10 moving average crosses the MA20/30 long-term moving average downward, which indicates that the short force is dominant. In addition, the RSI indicator also fell rapidly and entered the oversold area, but this may also suggest that prices have a rebound trend in the short term.
I think the current market price decline trend is more obvious, unless there is significant positive data, the gold price may continue to decline.

Gold intraday Short opportunityGold is currently moving with steady bearish momentum to the downside. at the opening of the week we saw downside momentum which is supported by price trading below the 50 SMA and trading with bearish momentum on the RSI below 45.
Potential retracement towards the $3344 price levels before continuation to the downside support at $3300. Looking to capitalize on this short opportunity for the day before price reacts to the major support at $330

Gold updateAfter the previous level was broken and structure shifted, we’re now entering a new phase of analysis.
In this fresh setup, we’re looking for buy opportunities — but not blindly!
As always, waiting for a clean pullback to the new zone and a solid entry signal.
Experience teaches us: real profits come from patience and planning.
Here’s my new gold analysis — high probability, low risk.
For detailed entry points, trade management, and high-probability setups, follow the channel:
ForexCSP

Weakness continues, continue to short the bear market📰 Impact of news:
1. Pay attention to Powell's speech in New York
2. Pay attention to geopolitical influence
📈 Market analysis:
Gold opened lower and showed a weak situation. The 1H moving average was arranged downward. In the short term, bears still occupied the main trend. From the 4-hour analysis of gold, the bulls still had repeated resistance before breaking down. Once it breaks down, the market will go further bearish. Pay attention to 3330 below. 3400 is still the key above in the short term. Only by breaking through the bulls can the rebound continue. In terms of operation, high-altitude and low-long are temporarily maintained. Pay attention to the short-term resistance of 3355-3365 above, and the support of 3340-3330 below. Pay attention to the breakthrough! Pay attention to Powell's speech in the New York session.
🏅 Trading strategies:
SELL 3370-3365-3355
TP 3340-3330
BUY 3340-3335-3320
TP 3345-3355-3365
If you agree with this view, or have a better idea, please leave a message in the comment area. I look forward to hearing different voices.
TVC:GOLD FXOPEN:XAUUSD FOREXCOM:XAUUSD FX:XAUUSD OANDA:XAUUSD

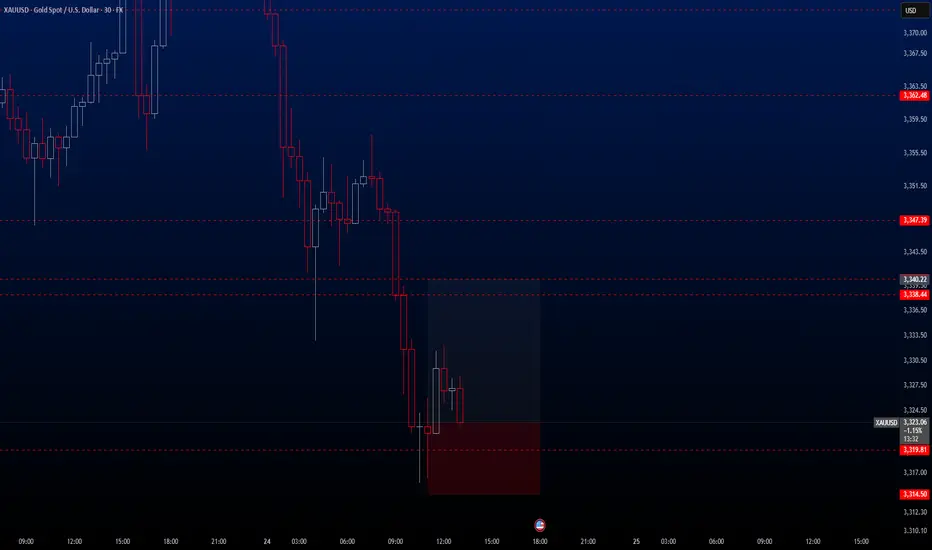
XAUUSD Hello traders. Today's second and also final trade opportunity comes from the XAUUSD pair. I consider this setup to be somewhat risky, so I recommend keeping your risk exposure at a minimum.
Earlier today, I shared a trade on GBPJPY, which has since experienced a strong upward move. As a result, I’ve updated the TP level for that trade. You can find the updated information noted under that specific post.
🔍 Trade Details
✔️ Timeframe: 30-Minute
✔️ Risk-to-Reward Ratio: 1:2
✔️ Trade Direction: Buy
✔️ Entry Price: 3323.09
✔️ Take Profit: 3340.22
✔️ Stop Loss: 3314.50
🕒 If momentum fades or the price consolidates in a tight range, I will keep this trade open only until 23:00 (UTC+4). After that, I’ll close it manually—whether in profit or loss—depending on how price action evolves.
🔔 Disclaimer: This is not financial advice. I’m simply sharing a trade I’ve taken based on my personal trading system, strictly for educational and illustrative purposes.
📌 Interested in a systematic, data-driven trading approach?
💡 Follow the page and turn on notifications to stay updated on future trade setups and advanced market insights.
XAUUSD: Key Reversal Zone or Deeper Correction Ahead?XAUUSD: Key Reversal Zone or Deeper Correction Ahead?
Gold enters the new trading week balancing on a technical and macroeconomic knife’s edge. After a steep decline, prices are testing critical liquidity zones — just as geopolitical tensions and US economic uncertainty intensify.
🌍 Macro & Fundamental Outlook
📰 Middle East Tensions Rising Again: Israel has signaled potential strikes on Tehran after Iran allegedly violated a ceasefire agreement. Such developments usually support gold as a safe-haven asset.
📊 US Economic Signals Are Mixed: Last week’s PMI and housing data point toward an economic slowdown. If this week’s Core PCE data softens, expectations for a Fed rate cut in September will grow — likely weakening the USD and lifting gold.
🏦 Global Demand for Gold Still Strong: Central banks, particularly from China and India, are continuing their gold accumulation, reinforcing long-term bullish fundamentals.
📉 Technical Analysis (H1–H4)
Gold is still trading within a downward channel but is now approaching a strong demand zone around 3276, a level that has triggered rebounds in the past.
EMA 34 – 89 – 200 indicate bearish momentum, but RSI is showing bullish divergence — hinting at a possible reversal or short-term bounce.
Price action around key support and resistance levels will be crucial this week.
✅ XAUUSD Trade Setup
BUY ZONE: 3278 - 3276 | SL: 3270 | TP: 3282 - 3286 - 3290 - 3294 - 3298 - 3302 - 3305 - 3310
SELL ZONE: 3367 - 3369 | SL: 3375 | TP: 3364 - 3360 - 3356 - 3352 - 3348 - 3344 - 3340 - 3330 - 3320
📌 The Buy Zone lies within a historical liquidity pocket — ideal for a potential rebound if geopolitical risks rise or USD weakens.
📌 The Sell Zone is near a key Fair Value Gap (FVG) and local resistance — strong confluence for short opportunities on a bounce.
🧭 Final Thoughts
XAUUSD is facing a pivotal moment. With both geopolitical events and major US economic data on the horizon, traders should prepare for volatility. Patience, technical discipline, and proper SL/TP management will be key to navigating this environment successfully.

XAU/USD: The truth may be late, but it will never be absent.Trump tweeted late at night that a ceasefire had been reached between Israel and Iran, causing gold and crude oil prices to crash straight away.
So far, neither side has officially announced the ceasefire, and new explosions continue to be reported, with the situation likely to reverse at any moment. Market sentiment runs faster than the truth, but the truth will catch up sooner or later.
Key Focus Points:
1.Monitor the authenticity of the ceasefire
2.Track Fed dynamics: If the Fed hints at rate cuts under pressure, the bullish logic for gold will remain intact.
XAUUSD
sell@3365-3375
tp:3340-3330
buy@3330-3340
tp:3360-3370
I am committed to sharing trading signals every day. Among them, real-time signals will be flexibly pushed according to market dynamics. All the signals sent out last week accurately matched the market trends, helping numerous traders achieve substantial profits. Regardless of your previous investment performance, I believe that with the support of my professional strategies and timely signals, I will surely be able to assist you in breaking through investment bottlenecks and achieving new breakthroughs in the trading field.

GOLD Bearish Breakout!
HI,Traders !
#GOLD is trading in a
UPtrend and Broke our of the bearish
Wedge pattern then made
A retest and is going down
Now so we are bearish
Biased and we will be
Expecting a further move down !
Comment and subscribe to help us grow !

XAUUSDGold has shown a strong historical pattern of impulsive rallies followed by significant corrections. After the recent explosive move from the $2,067 breakout zone to new all-time highs around $3,500, representing a +67% rally, the metal appears overextended and due for a healthy pullback.
Past cycles suggest that after such parabolic moves, price tends to retrace back to key demand zones or previous accumulation levels. In this case, the medium-term correction target aligns with the $2,800–$2,750 region — a strong structural support and confluence with the 2024 breakout base.
While the long-term trend remains bullish, this setup hints at a potential mean reversion or consolidation phase. Traders should remain cautious at current highs and watch for signs of distribution and lower highs forming in the coming weeks

XAUUSD:Go long
The uncertainties in multiple dimensions such as geopolitics, US monetary policy and tariffs have significantly increased, which will bring more volatility to the gold price.
Today's market trend is still mainly volatile. During the Asian session, there has been a deep pullback. 3316 is the short-term support. It is expected that there will be a rebound in the future.
Trading strategy:
BUY@3325-30
TP:3345-50
More detailed strategies and trading will be notified here ↗↗↗
Keep updated, come to "get" ↗↗↗

Gold: Breakout and Potential retraceHey Traders, in today's trading session we are monitoring XAUUSD for a selling opportunity around 3,340 zone, Gold was trading in an uptrend and successfully managed to break it out. Currently is in a correction phase in which it is approaching the retrace area at 3,340 support and resistance area.
Trade safe, Joe.

XAUUSD Technical Analysis – June 24, 2025On June 24, 2025, XAUUSD (spot gold) continues to face significant bearish pressure after failing to hold above the key resistance zone around 3,383 – 3,400 USD/oz. This area marks a confluence of the 0.5–0.618 Fibonacci retracement levels and a high-volume distribution zone, signaling strong supply dominance in the short term.
Technical Structure and Fibonacci Analysis
- The recent swing high was established at 3,451 USD, completing a bullish wave from the low of 3,223 USD.
- Price was unable to break through the 0.618 Fibonacci retracement at 3,399 USD, leading to a sharp pullback.
- The current structure suggests the formation of a potential head and shoulders pattern, which would confirm if the market breaks below the 3,300 USD support zone.
Key Support and Resistance Levels
- Major resistance: 3,383 – 3,400 USD (Fibonacci 0.5–0.618 zone, high-volume area)
- Immediate support: 3,300 – 3,310 USD (historical reaction zone and 0.618 retracement of the recent bullish leg)
- Deeper support: 3,223 USD – previous swing low and a key target if the bearish trend confirms
Potential Scenarios
- Bearish scenario: If the price sustains below 3,350 USD and decisively breaks 3,300 USD, it may signal the start of a medium-term downtrend, with targets near 3,200 USD or even lower.
- Bullish scenario: A bounce from the 3,300 USD support could trigger a short-term recovery, but traders should closely watch the reaction near the 3,383 – 3,400 USD resistance zone to assess supply pressure.
RSI and Momentum Indicators
- The 14-period RSI is trading below the 50 level and pointing downward, indicating that bearish momentum remains dominant.
- The RSI has also crossed below its moving average, reinforcing the negative outlook.
Ps: XAUUSD is currently in a critical phase as it tests the 3,300 USD support level. A break below this level could confirm further downside and strengthen the bearish trend. Traders are advised to remain cautious, wait for clear price action confirmation, and apply strict risk management as volatility increases.

XAUUSD Breaks Trend – Deeper Correction Ahead?Gold (XAUUSD) has just broken below its rising H4 trendline and the key support zone around 3,340 – a strong signal for a potential short-term downtrend. A sharp bearish candle with high volume confirms sellers are now in control.
The 3,360–3,365 zone has flipped into resistance and may act as a retest area before further declines.
If price fails to hold 3,320,
the next targets are 3,300–3,280,
possibly down to 3,260.
Volume Profile indicates money is leaving the upper range, reducing the chance of a strong rebound.
Preferred strategy: wait for a pullback to 3,355–3,365,
set SL above 3,370,
and aim for TP at 3,300–3,280.
Caution: the Fed’s “higher for longer” stance and USD strength are applying pressure on gold. Long positions are risky at this stage. Monitor the 3,300 level closely for potential buyer reaction.

Gold Short Term OutlookYesterday’s chart idea is playing out as analysed.
Gold failed to break above the $3,395 resistance and has now pulled back, currently testing the first support zone — aligned with the 4H 200MA and Daily 50MA.
If this area fails to hold, price is likely to head toward the next key support zone, where we expect a potential reaction.
To resume bullish momentum, we need to see a strong close above $3,346. Key bullish zones remain $3,375 and $3,395.
📌 Key Levels to Watch:
Resistance:
$3,375 • $3,395 • $3,418 • $3,439
Support:
$3,361 • $3,346 • $3,330 / $3,306
$3,287 – Critical demand zone
🧠 Fundamental Focus:
All eyes are on Fed Chair Powell’s testimony today, which may offer clues about the Fed’s rate outlook and inflation stance. Any hint of continued hawkishness could weigh on gold, while dovish commentary may trigger renewed upside interest.
Expect heightened intraday volatility around his remarks — stay cautious.

GOLD Intraday Chart Update For 24 June 2025Hello Traders, As you can see that GOLD fell sharply this morning due to Israel- Iran Cease fire scenario
Further more FED Chair POWELL Testifies Starts from Today and end on Tomorrow make sure to manage you trading accordingly
Right now GOLD is in Strong Bearish Trend only clear Breakout of 3368 level for the day below this market remains Bearish
All eyes on 3300 Psychological Digit for now if market breaks 3300 Successfully then it will move towards 3250 soon
Disclaimer: Forex is Risky
