Gold (XAU/USD) Analysis - 24 June 2025📊 4-Hour Chart: Supply & Demand Structure
1. 📐 Market Structure & Bias
Gold has bounced off the $3,340–3,350 demand area multiple times—confirming a strong support structure on the 4H timeframe .
Following this bounce, gold made a higher-low, reinforcing a bullish trend.
Overall bias remains bullish, as long as prices hold above the $3,340 region. A break below this zone may bring deeper correction.
2. 🔍 Demand Zones (Buy Areas)
Zone A – $3,340 to $3,350
Comes with trendline support and prior consolidation.
Volume and price action confirm institutional buying interest.
Zone B – $3,300 to $3,310
A more significant base zone for deeper pullbacks or additional liquidity running.
3. ⚠️ Supply Zones (Sell Areas)
Zone C – $3,380 to $3,390
Shallow zone where recent rallies have stalled—ideal for supply fade strategies.
Zone D – $3,400 to $3,410
Major resistance zone—historical retracement area with institutional selling.
🔍 1-Hour Chart: Intraday Entry Zones (Aligned with 4H Bias)
Below are premium-level intraday buy setups made for quick execution within the bullish structure:
Entry Type Zone ($) Description
1. Buy the Dip 3,340 – 3,345 Touches 4H demand + trendline — watch for bullish rejection wicks or volume pickup.
2. Quick Dip Buy 3,350 – 3,355 Opportunistic entry higher in demand zone — quicker reentries with lighter pullback.
3. Deep Bounce 3,300 – 3,310 For deeper intraday swings only—requires strong confirmation from lower timeframes.
(Optional) Sell Supply Fade 3,380 – 3,390 Aggressive fade only if strong price rejection appears—caution advised.
Tips for Entry Confirmation:
Look for bullish pin bars, engulfing candles, volume confirmation, or trendline bounces within these zones. Only trade entries with clear price action confirmation.
Xauusd(w)

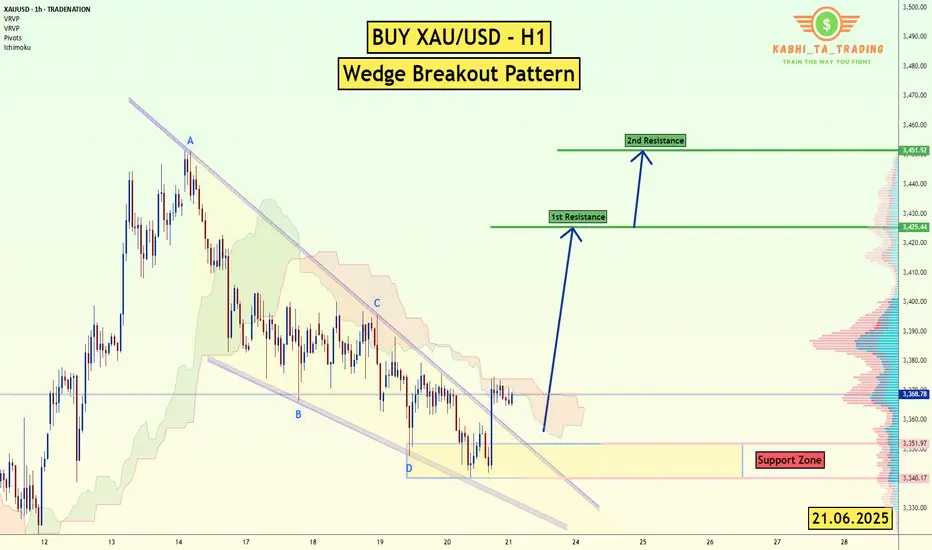
XAU/USD (Gold) - H1 - Wedge Breakout (21.06.2025)The XAU/USD pair on the H1 timeframe presents a Potential Buying Opportunity due to a recent Formation of a Wedge Breakout Pattern. This suggests a shift in momentum towards the upside and a higher likelihood of further advances in the coming Days.
Possible Long Trade:
Entry: Consider Entering A Long Position around Trendline Of The Pattern.
Target Levels:
1st Resistance – 3425
2nd Resistance – 3451
🎁 Please hit the like button and
🎁 Leave a comment to support for My Post !
Your likes and comments are incredibly motivating and will encourage me to share more analysis with you.
Best Regards, KABHI_TA_TRADING
Thank you.
Disclosure: I am part of Trade Nation's Influencer program and receive a monthly fee for using their TradingView charts in my analysis.
XAUUSD Sideways – Breakout Setup FormingGold is currently in a clear consolidation phase on the 4-hour chart, moving within the range of 3,320 to 3,393. After a pullback from the 3,460 peak, the price has repeatedly formed ParSE and ParLE patterns, indicating a strong tug-of-war between buyers and sellers. This suggests that the market is building pressure for a potential breakout in the coming sessions.
Technically, the 3,393 – 3,400 zone remains a key resistance as price has been rejected multiple times there.
Meanwhile, the 3,320 – 3,330 area is holding as solid support, showing strong bullish reactions in previous touches.
The 3,342 – 3,350 range is acting as a neutral zone where price is accumulating before making its next move.
There are two optimal trading strategies at this stage.
The first is range trading: look to buy near 3,320 – 3,330 and target profits at 3,350 – 3,370; conversely, consider selling around 3,390 – 3,393 with take-profit targets back at 3,350 – 3,365. The second is breakout trading: if the price closes a 4H candle above 3,393 with strong volume, it opens up long opportunities targeting 3,420 – 3,445.
On the flip side, a clear break below 3,320 may lead to further downside toward 3,285 – 3,260.
From a macroeconomic perspective, traders should closely monitor US inflation data and upcoming Fed policy signals. Any hints of easing from the Fed could act as a strong bullish catalyst for gold. Additionally, geopolitical developments and USD trends remain crucial as they directly influence safe-haven flows into gold.
In summary, this is a key phase to observe and prepare for decisive action when the market breaks out of consolidation. Patience, disciplined entries, and strict risk management are essential in the current environment.
Follow for daily updates and actionable strategies as the setup unfolds.

Will gold pull back today?During the Asian trading session, spot gold fluctuated lower, once breaking below the 3,350 level to $3,333.16 per ounce. This followed U.S. President Trump's announcement that Israel and Iran had fully reached an agreement to implement a comprehensive ceasefire, leading to a rapid cooling of market concerns over the Middle East situation and suppressing gold's safe-haven demand. The conclusion of the ceasefire agreement has dispelled market fears of conflict escalation, causing gold, silver, and crude oil prices to decline accordingly.
After yesterday's repeated oscillations, gold failed to break through the 3,400 resistance level last night. Instead, it tested the support at 3,340 in today's early trading. From the current price chart, the hourly candlestick has pierced the 3,340 level, but the candlestick body has not closed below 3,340. The prior downward test of support indicates that the market remains weak for now. The temporary effective lower support lies at 3,333, and a break below this level could lead to a move toward 3,280. The effective resistance is at 3,375, and a breakthrough above this level may target 3,405.
you are currently struggling with losses,or are unsure which of the numerous trading strategies to follow,You have the option to join our VIP program. I will assist you and provide you with accurate trading signals, enabling you to navigate the financial markets with greater confidence and potentially achieve optimal trading results.
Trading Strategy:
sell@3360-3365
TP:3335-3340

Gold Trading Strategy June 23The last two D1 candles have continuously drawn out the wicks. The Sellers may no longer be interested in dominating the market.
Currently, Gold is moving sideways in a wide range. 3345 and 3375 are the two Breakout zones of the gold price in today's trading day. When breaking out of the breakout zone, the price will continue its strong trend. Limit trading against the trend when the price breaks out.
Trading signals may also appear if there is confirmation from the candle that does not break out of this breakout zone.
Resistance and support zones remain the same as last week.
Resistance 3400-3415-3443
Support 3322-3296
Break out: 3375-3345
Recommended good trading signals
SELL 3399-3401 Stoploss 3405
BUY 3322-3320 Stoploss 3306

XAUUSD – Holding Support, Potential Rebound in SightOn the H4 chart, gold recently dropped over 1,250 pips, but is now showing signs of stabilizing around the key support zone at 3,303 USD. Although price temporarily broke below the ascending trendline, current price action suggests a possible false breakout. If support holds, a rebound toward the 3,418 USD resistance – aligning with the previous trendline and an unfilled FVG – becomes likely.
Yesterday’s decline was largely triggered by news that the U.S. carried out airstrikes on Iranian nuclear sites, boosting the USD and pressuring gold. However, the broader market remains sensitive, with traders awaiting crucial U.S. data – including Q1 GDP and Core PCE, the Fed’s preferred inflation gauge.
If these upcoming releases signal economic slowdown or easing inflation, gold may regain upside momentum. As long as 3,303 USD holds, the technical structure favors a short-term bullish scenario.

XAUUSD H1 I Bearish Reversal Based on the H1 chart, the price is approaching our sell entry level at 3359.79, a pullback resistance that aligns with the 38.2% Fib retracement.
Our take profit is set at 3328.25, a pullback support that aligns with the 78.6% Fib retracement and the 127.2% Fib extension.
The stop loss is set at 3377.59, a pullback resistance.
High Risk Investment Warning
Trading Forex/CFDs on margin carries a high level of risk and may not be suitable for all investors. Leverage can work against you.
Stratos Markets Limited (tradu.com ):
CFDs are complex instruments and come with a high risk of losing money rapidly due to leverage. 63% of retail investor accounts lose money when trading CFDs with this provider. You should consider whether you understand how CFDs work and whether you can afford to take the high risk of losing your money.
Stratos Europe Ltd (tradu.com ):
CFDs are complex instruments and come with a high risk of losing money rapidly due to leverage. 63% of retail investor accounts lose money when trading CFDs with this provider. You should consider whether you understand how CFDs work and whether you can afford to take the high risk of losing your money.
Stratos Global LLC (tradu.com ):
Losses can exceed deposits.
Please be advised that the information presented on TradingView is provided to Tradu (‘Company’, ‘we’) by a third-party provider (‘TFA Global Pte Ltd’). Please be reminded that you are solely responsible for the trading decisions on your account. There is a very high degree of risk involved in trading. Any information and/or content is intended entirely for research, educational and informational purposes only and does not constitute investment or consultation advice or investment strategy. The information is not tailored to the investment needs of any specific person and therefore does not involve a consideration of any of the investment objectives, financial situation or needs of any viewer that may receive it. Kindly also note that past performance is not a reliable indicator of future results. Actual results may differ materially from those anticipated in forward-looking or past performance statements. We assume no liability as to the accuracy or completeness of any of the information and/or content provided herein and the Company cannot be held responsible for any omission, mistake nor for any loss or damage including without limitation to any loss of profit which may arise from reliance on any information supplied by TFA Global Pte Ltd.
The speaker(s) is neither an employee, agent nor representative of Tradu and is therefore acting independently. The opinions given are their own, constitute general market commentary, and do not constitute the opinion or advice of Tradu or any form of personal or investment advice. Tradu neither endorses nor guarantees offerings of third-party speakers, nor is Tradu responsible for the content, veracity or opinions of third-party speakers, presenters or participants.

Gold eased slightly as Middle East risk receded
Safe-haven demand for gold eased slightly as geopolitical risks in the Middle East subsided. However, the downside was limited by a weaker dollar. Market sentiment around a potential escalation in regional tensions also softened, particularly as the likelihood of a Strait of Hormuz blockade declined despite preemptive US strikes. Looking ahead, gold prices may exhibit heightened volatility depending on Fed Chair Powell’s upcoming congressional testimony and the release of the May PCE inflation data.
XAUUSD failed to reenter the ascending channel and retreated below 3360. EMA21 is narrowing its gap with EMA78, signaling a potential shift toward a bearish structure. If XAUUSD breaks below the support at 3320, the price may decline further to 3280. Conversely, if XAUUSD reenters the channel, the price could gain upward momentum toward the resistance at 3400.

Gold: Breakout and Potential Retrace!!Hey Traders, in today's trading session we are monitoring XAUUSD for a selling opportunity around 3,390 zone, Gold was trading in an uptrend and successfully managed to break it out. Currently is in a correction phase in which it is approaching the retrace area at 3,390 support and resistance zone.
Trade safe, Joe.

XAUUSD – Gold Forming Higher Lows with Range Bound CeilingGold remains bullish on the higher timeframes, holding a long-term ascending trendline from the daily.
However, price action has respected a clear horizontal resistance zone around 3392, forming a multi-tap ceiling.
On lower timeframes, we’re seeing a series of higher lows, suggesting buyers are still stepping in — but without clean breakouts, the market remains range-bound between 3345 and 3392.
⸻
🧠 Bias:
Neutral-Bullish
– Price is coiling into the triangle
– A breakout above 3392 could open doors toward 3450
– But if we fail to hold the rising trendline, a deeper pullback toward 3294 is likely
⸻
🎯 Trade Ideas:
📌 Break & Retest above 3392 = bullish continuation
📌 Break below trendline = short toward 3345 / 3294
⸻
⚠️ Key Levels to Watch:
• Resistance: 3392 → 3450
• Support: 3345 → 3294
• Daily Trendline Support (in play)
⸻
💡 Gold is compressing — breakout incoming. Watch the reaction at 3392 for directional clarity.

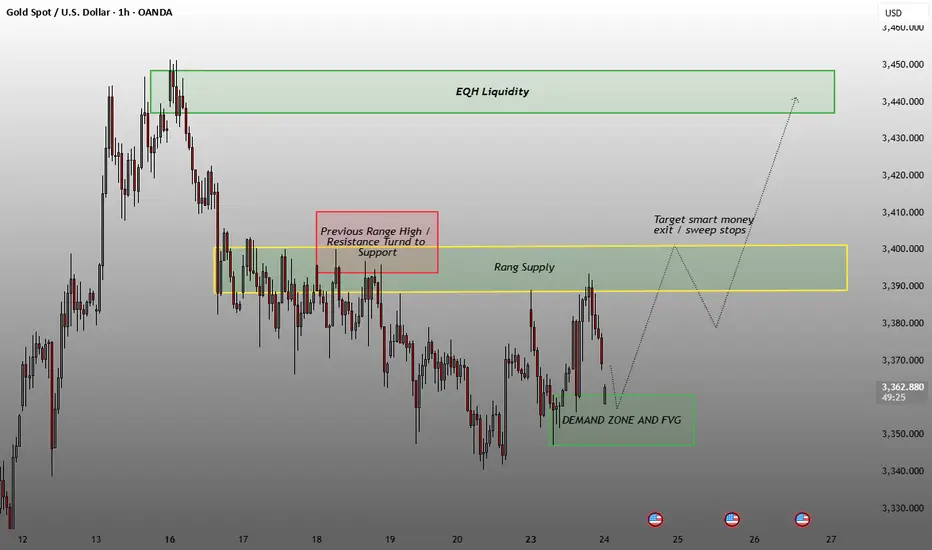
Demand Zone and FVG (Fair Value Gap) (Green Box at the bottom)This is identified as a potential buy zone where institutional demand may lie.
Price recently tapped into this zone, indicating a potential reversal or long entry area.
Rang Supply / Resistance Area (Yellow Box in the middle):
Previous range high that acted as resistance, and now may turn into support upon retest.
Labeled as "Previous Range High / Resistance Turned to Support".
EQH Liquidity (Equal High Liquidity) (Green Box at the top):
A liquidity pool where equal highs suggest buy-side liquidity.
Price is expected to move up to grab liquidity, targeting this zone.
📈 Market Structure:
Price made a higher low at the demand zone, suggesting potential bullish continuation.
Expected movement:
Bullish move from the demand zone.
Temporary reaction or rejection from the supply zone.
Final liquidity sweep toward EQH (Equal Highs) at the top.
🎯 Target & Strategy:
Target: 3,440–3,450 range — aligned with the EQH Liquidity zone.
Smart Money Exit: Noted near 3,400 — a zone where stop losses and liquidity might be collected.
Strategy Implication: Ideal for buy setups from the demand zone toward the EQH liquidity zone, with a potential scale-out near mid-supply.
Market Structure AnalysisMarket Structure Analysis
HH (Higher High) and HL (Higher Low) labels indicate the prior uptrend structure.
The recent price action shows consolidation and potential trend reversal or correction.
🟦
Highlighted Zones
Supply Zones (resistance): Marked in light teal rectangles near the top of price action (e.g., around 3,400).
Demand Zones (support): Marked below the current price (e.g., around 3,360 and lower near 3,320).
🔄
Ch0CH (Change of Character)
A “Ch0CH” label is marked — this typically signals a potential shift in market structure (e.g., from bullish to bearish).
This is further supported by the price breaking below a previous higher low.
📉
Trade Setup
Red Zone: Indicates the stop-loss region.
Green Zone: Indicates the take-profit target.
A short (sell) position is implied here, expecting price to drop from the current level to the lower demand zone.
🔁
Projected Price Path
A dotted white line projects a potential bearish move, with a minor retracement before continuation down to ~3,328.

SPY/QQQ Plan Your Trade For 6-23 : Afternoon UpdateWhat happened to the CRUSH pattern?
Everyone wants to know why the CRUSH pattern didn't show up today. Well, I keep telling all of you these SPY Cycle Patterns are based on GANN, Tesla and Fibonacci price structures. They do not take into consideration news, global events, or anything outside of PRICE.
They are predictive - meaning they attempt to predict potential price shapes/patterns weeks, months, and years in advance.
The markets, obviously, are seeking some normalcy after the Iran conflict. I thought the CRUSH pattern would have been a perfect fit for today - but obviously the markets didn't agree.
If you have been following my videos, you know I keep saying the US stock market is acting as a global hedge for risks. Traders are pouring capital into the US stock market as a way to avoid global risk factors.
Traders are also pouring capital into Gold/Silver. Demand for physical metals is through the roof right now.
Time will tell if my Excess Phase Peak pattern plays out as I expect or if we rally to new ATHs.
Obviously, this sideways rollover topping pattern could present a breakaway in either direction.
Again, my patterns are not correlated based on news or other events. They are strictly price-based.
Get some...
#trading #research #investing #tradingalgos #tradingsignals #cycles #fibonacci #elliotwave #modelingsystems #stocks #bitcoin #btcusd #cryptos #spy #gold #nq #investing #trading #spytrading #spymarket #tradingmarket #stockmarket #silver

Gold bottoms out and tests resistance, long positions at night📰 Impact of news:
1. Bowman hinted at a July rate cut
2. Fed Governor Kugler and FOMC permanent voting member and New York Fed President Williams hosted the "Fed Listening" event.
📈 Market analysis:
Gold will maintain a short-term volatile trend. Although the United States intervenes in the conflict between Iran and Israel, the geopolitical situation will affect the market trend to a certain extent. However, the remarks of Federal Reserve Board member Bowman hinting at a rate cut in July have eased market volatility to a certain extent. Gold maintains a narrow range of fluctuations at the 4H level, and the technical pattern is gradually adjusted. The K-line stands firmly on the short-term moving average. The short-term trend shows that it is necessary to observe the second opportunity for pull-up after the confirmation of the retracement. At the hourly level, the short-term moving average diverges upward, and the short-term volatile and strong pattern is maintained. In the evening, pay attention to the upper resistance area of 3395-3405, focus on the suppression of the 3405 line, pay attention to 3375-3365 below, and further pay attention to the 3345 support line if it breaks through.
🏅 Trading strategies:
SELL 3385-3395-3405
TP 3370-3365-3345
BUY 3375-3365-3355
TP 3390-3400-3405
If you agree with this view, or have a better idea, please leave a message in the comment area. I look forward to hearing different voices.
TVC:GOLD FXOPEN:XAUUSD FOREXCOM:XAUUSD FX:XAUUSD OANDA:XAUUSD

XAUUSD (GOLD), bullish setup activeXAUUSD (GOLD), bullish setup active. 1H timeframe has given me the confirmation for a bullish setup. If you want to have higher R:R, wait for the pullback to be completed and then enter around 3351-56. Also look at my yesterdays setup in 5-15m timeframe.
Cheers
Bullish Momentum Expected Next Week, With Geopolitical tensions 🌍 Fundamental Catalyst – Middle East Tensions Driving Gold Higher
Gold is gaining strong safe-haven demand due to escalating geopolitical tensions between Iran and Israel, further amplified by a recent U.S. military strike on Iran. These developments have sparked fears of a broader regional conflict, pushing investors to seek the stability that gold traditionally offers during periods of uncertainty. We may again see an All-Time New High of gold because things are getting closer to a new WWIII, which we never want, so these tensions will boost the gold prices.
Key Fundamentals Supporting Bullish Gold:
🛡️ Safe-Haven Demand: Gold historically rallies during military conflict and political instability.
💥 Risk-Off Sentiment: Equities may weaken while commodities like gold attract capital inflow.
🔐 Market Uncertainty: Any further escalation will likely trigger another wave of buying pressure in gold.
With this level of geopolitical uncertainty, we may soon witness a new all-time high (ATH) in gold prices. If further military actions occur, we could potentially see an explosive move of 600 to 1000 pips as early as tomorrow.
At the same time, while we analyze the market and act accordingly, our hope remains that peace will soon prevail. These conflicts are deeply painful and harmful to humanity. Let’s all hope for de-escalation and the return of stability — not just for the markets, but for the well-being of people across the world.
Technical Overview:
> The chart shows a descending channel pattern, which is still valid, but the thing is now gold will follow fundamental, not technical levels.
> Don't need to wait for the breakout of this channel, you can enter to buy a trade from here once the market opens.
> Regarding the targets we mentioned below.
>> TP1: 3400 <<
>> Final Target Zone: 3445–3450 <<
: NOTE
Given the geopolitical backdrop and historical behavior of gold in such environments, a bullish trend is expected in the coming sessions. Traders and investors should monitor developments closely, as any further escalation may act as a strong catalyst for gold to surge.
Thank you traders, for reading our idea. If any of you want to suggest something, must comment here as we can explore more. If you agreed with my idea, so must support us for more updates.

XAUUSD Hey traders
I can see BUY setup XAUUSD Pair in 4hr time frame
wait for market to come entry point
Also use proper money management
Always wait for confirmation/strong setup for open a trade.
Thank you and Good Luck!
Happy trading.

GOLD Growth Ahead! Buy!
Hello,Traders!
GOLD is trading along the
Rising support and is already
Making a bullish rebound so
As we are bullish biased due
To the strong uptrend we
Will be expecting a further
Bullish move up on Gold
Buy!
Comment and subscribe to help us grow!
Check out other forecasts below too!
Disclosure: I am part of Trade Nation's Influencer program and receive a monthly fee for using their TradingView charts in my analysis.

XAUUSD #Xau #goldLooking for buys at 3310-3280 region potential because market is bullish, price will react from weekly levels in discounts
XAUUSD Daily Sniper Plan – Monday, June 23, 2025Current Price: 3368.76
Trend: Bearish on H4 | Corrective on H1 | Weak Bullish Attempt on M15
Market Context: Gold is consolidating under EMA pressure after FOMC. Price is pinned inside a key flip zone, awaiting Monday’s fundamental triggers.
🔸 HTF Overview (D1, H4, H1)
📰 Macro + Economic Context – Week of June 23–28:
This is a high-impact week for USD with Fed speeches, inflation, and growth data. Monday opens with caution:
Monday, June 23
🟠 FOMC Member Waller Speaks
🔴 Flash Manufacturing & Services PMI
🟠 Existing Home Sales
Tuesday, June 24
🔴 Fed Chair Powell Testifies
🟠 CB Consumer Confidence
🟠 Richmond Manufacturing Index
Wednesday, June 25
🔴 Powell Testimony (Day 2)
🟠 New Home Sales
Thursday, June 26
🔴 Final GDP q/q
🔴 Unemployment Claims
🟠 Durable Goods Orders
🟠 Pending Home Sales
Friday, June 27
🔴 Core PCE Price Index
🟠 Revised UoM Consumer Sentiment
📌 Monday is lighter in impact, but PMI data and Waller’s speech may spark the week’s directional bias. Avoid trading blindly into PMI spikes.
H4 Structure & Bias:
Bearish trend intact: Lower High = 3418, Lower Low = 3311
EMAs (21/50/100) aligned downward — price capped below 3380
RSI still under 60 = no bullish momentum
Rejection zone remains valid at 3406–3420 (H4 OB)
Strong demand expected at 3340–3352 and extreme at 3310–3288
🔸 LTF Precision (M30, M15)
Price compressing around 3365–3372
RSI around 56 → indecision
No bullish HH above 3380 = still within bearish control
EMA flattening → prepare for trap setups around NY open
🧭 Trade Scenarios
🔻 Sell Zone – 3406–3420
H4 OB, FVG top, liquidity above 3405
Entry: 3412
SL: 3426
TP1: 3312
TP2: 3288
TP3: 3265
🧠 Wait for sweep or strong bearish reaction — no early entries.
⚠️ Flip Zone – 3360–3380
No-trade zone: EMA cluster + mid-FVG
Only use for confirmations, not entries
🟢 Buy Zone – 3340–3352
OB + demand + Fib retracement
Entry: 3348
SL: 3334
TP1: 3448
TP2: 3472
TP3: 3490
🟢 Buy Zone – 3310–3288
Below LL sweep (3311)
Deep liquidity + OB demand
Entry: 3298
SL: 3280
TP1: 3365
TP2: 3405
TP3: 3440
📍 Key Structural Levels – June 23
Level Type Role
3460 Bull Trap Limit Irrational spike area
3445 FOMC Unfilled wick – trap zone
3426 Sell Zone Risk protection above OB
3418 H4 LH Confirmed bearish structure
3410 OB Midpoint Micro-rejection inside OB
3395 Previous HH Inducement target
3384 FVG Top Minor LTF rejection
3360–3380 ⚠️ Flip Zone MA/FVG compression – avoid entries
3352 OB entry edge Buy Zone 1 upper limit
3340 OB base Buy Zone 1 key level
3311 H4 LL Confirms bear structure
3300 Round Level Psychological + liquidity
3288 OB base Final demand structure zone
3265 Final TP Bearish extension only
✅ Final Action Plan
📉 Stay bearish below 3380 unless a clean HH + OB support forms
⚠️ Avoid trading inside 3360–3380 flip zone during NY PMI data
🛒 Longs valid only from 3340 or 3310 with confirmation (RSI, PA, OB)
🧠 Focus on structure integrity and clean OB rejections only
💬 Will you fade the 3412 OB or wait for the sniper bounce at 3348?
🔔 Follow and 🚀@GoldFxMinds for premium breakdowns, macro updates, and real-time sniper execution guidance.
🔹 Disclosure: As part of Trade Nation’s Influencer Program, we receive monthly compensation for using their charts.
GoldFxMinds

Conflict breaks out, risk aversion rises, can 3400 be broken?Bowman's dovish comments in the afternoon eased the market, by which time risk aversion was deepening as sudden geopolitical conflicts continued to deepen. Will the USA make a corresponding response to this matter? This series of events has once again put gold into a complicated situation. Can gold hit the 3,400 mark today?
Free trading strategies are updated daily🌐. All trading strategies released since this month have been verified and can serve as a good reference📈.👇 I sincerely hope that these strategies can be helpful to you👇.
OANDA:XAUUSD FX:XAUUSD FOREXCOM:XAUUSD FXOPEN:XAUUSD TVC:GOLD

Gold Market Analysis: Key Levels and Trends 23/June/2025 Core Themes
1. Geopolitical Drivers: Escalating tensions in the Middle East, particularly U.S. airstrikes on Iranian nuclear facilities, are fueling gold's "flight to safety" narrative. Analysts anticipate sustained demand for gold amid potential regional conflict.
2. Technical Bullish Bias: Gold is in an uptrend, respecting key support levels and forming higher lows within an ascending channel. Breakouts above resistance (e.g., $3,439–$3,501) could validate further gains.
3. Correction vs. Continuation: While short-term pullbacks are expected (e.g., testing $3,320–$3,200), the broader bullish structure suggests corrections are temporary.
---
Key Technical Levels
Support:
- Immediate: $3,320 (lower channel boundary)
- Deeper: $3,200 (critical level; break could extend corrections)
Resistance:
- Short-term: $3,378–$3,382 (upper channel boundary)
- Mid-term: $3,439 (previous resistance; target for bullish continuation)
- Long-term: $3,501 (potential next resistance; requires strong momentum)
Fibonacci Retracements:
- 23.6%: $3,360–$3,370 (support zone for long entries)
- 50.0%: $3,400 (conservative take-profit target)
- 61.8%: $3,415 (key golden ratio level; likely Wave (5) peak)
- 100%: $3,435–$3,440 (aggressive target; upper channel line)
---
Trade Setups & Strategies
1. Long Entry:
- Target: $3,400–$3,435 (Fibonacci extensions)
- Stop-Loss: Below $3,315 (break of key support)
- Entry Zone: $3,360–$3,370 (near ascending channel support and 23.6% Fib)
2. Bullish Confirmation:
- Breakout Above $3,378: Validates continuation toward $3,439 and $3,501.
- Volume Increase: Confirms strength at key levels (e.g., $3,360–$3,370).
---
Risk Management & Key Risks
- Stop-Loss Placement:
- Longs: Below $3,315 (protects against deeper corrections).
- Shorts: Above $3,350 (avoids false breakouts).
- Volatility: Monitor geopolitical developments (e.g., U.S.-Iran escalation) that could trigger rapid price swings.
- Correction Risks: If gold fails to hold $3,320, a drop to $3,200 may occur, requiring tighter stops.
---
Fundamental Outlook
- Safe-Haven Demand: Rising tensions are likely to sustain gold's appeal.
- Inflation & Rate Outlook: Persistent inflation concerns and potential rate cuts (if economic data weakens) could further support gold.
- Negotiation Risk: De-escalation or Iran's concessions may pause the bullish momentum, leading to a reversal toward $3,340–$3,320.
---
Conclusion
Gold is in a strong bullish phase, driven by geopolitical risks and technical structure. Traders should focus on buying dips near $3,320–$3,370 with targets toward $3,439–$3,501. However, monitor the $3,320 support and geopolitical developments closely. If the trend breaks, a retest of $3,200 could follow. Always use stop-losses to manage risk.
Final Note: The market is highly volatile, so position sizing and risk management are critical. Stay alert for news updates and technical confirmations (e.g., closes above $3,378)

GOLD ROUTE MAP UPDATEHey Everyone,
Great start to the week with our new 1H chart playing out to perfection!!!
We started with a gap on market open clearing our Bullish target. We then got our bearish target at 3348, followed with no ema5 cross and lock confirming the rejection into our bullish target 3376.
We now have ema5 cross and lock above 3376 opening 3395.
We will see levels tested side by side until one of the weighted levels break and lock to confirm direction for the next range.
We will keep the above in mind when taking buys from dips. Our updated levels and weighted levels will allow us to track the movement down and then catch bounces up.
We will continue to buy dips using our support levels taking 20 to 40 pips. As stated before each of our level structures give 20 to 40 pip bounces, which is enough for a nice entry and exit. If you back test the levels we shared every week for the past 24 months, you can see how effectively they were used to trade with or against short/mid term swings and trends.
The swing range give bigger bounces then our weighted levels that's the difference between weighted levels and swing ranges.
BULLISH TARGET
3376 - DONE
EMA5 CROSS AND LOCK ABOVE 3376 WILL OPEN THE FOLLOWING BULLISH TARGETS
3395
EMA5 CROSS AND LOCK ABOVE 3395 WILL OPEN THE FOLLOWING BULLISH TARGET
3419
EMA5 CROSS AND LOCK ABOVE 3419 WILL OPEN THE FOLLOWING BULLISH TARGET
3440
BEARISH TARGETS
3348 - DONE
EMA5 CROSS AND LOCK BELOW 3348 WILL OPEN THE SWING RANGE
3330
3306
EMA5 CROSS AND LOCK BELOW 3306 WILL OPEN THE SECONDARY SWING RANGE
3288
3271
As always, we will keep you all updated with regular updates throughout the week and how we manage the active ideas and setups. Thank you all for your likes, comments and follows, we really appreciate it!
Mr Gold
GoldViewFX
