Gold Market Analysis: Key Levels and Trends 23/June/2025 Core Themes
1. Geopolitical Drivers: Escalating tensions in the Middle East, particularly U.S. airstrikes on Iranian nuclear facilities, are fueling gold's "flight to safety" narrative. Analysts anticipate sustained demand for gold amid potential regional conflict.
2. Technical Bullish Bias: Gold is in an uptrend, respecting key support levels and forming higher lows within an ascending channel. Breakouts above resistance (e.g., $3,439–$3,501) could validate further gains.
3. Correction vs. Continuation: While short-term pullbacks are expected (e.g., testing $3,320–$3,200), the broader bullish structure suggests corrections are temporary.
---
Key Technical Levels
Support:
- Immediate: $3,320 (lower channel boundary)
- Deeper: $3,200 (critical level; break could extend corrections)
Resistance:
- Short-term: $3,378–$3,382 (upper channel boundary)
- Mid-term: $3,439 (previous resistance; target for bullish continuation)
- Long-term: $3,501 (potential next resistance; requires strong momentum)
Fibonacci Retracements:
- 23.6%: $3,360–$3,370 (support zone for long entries)
- 50.0%: $3,400 (conservative take-profit target)
- 61.8%: $3,415 (key golden ratio level; likely Wave (5) peak)
- 100%: $3,435–$3,440 (aggressive target; upper channel line)
---
Trade Setups & Strategies
1. Long Entry:
- Target: $3,400–$3,435 (Fibonacci extensions)
- Stop-Loss: Below $3,315 (break of key support)
- Entry Zone: $3,360–$3,370 (near ascending channel support and 23.6% Fib)
2. Bullish Confirmation:
- Breakout Above $3,378: Validates continuation toward $3,439 and $3,501.
- Volume Increase: Confirms strength at key levels (e.g., $3,360–$3,370).
---
Risk Management & Key Risks
- Stop-Loss Placement:
- Longs: Below $3,315 (protects against deeper corrections).
- Shorts: Above $3,350 (avoids false breakouts).
- Volatility: Monitor geopolitical developments (e.g., U.S.-Iran escalation) that could trigger rapid price swings.
- Correction Risks: If gold fails to hold $3,320, a drop to $3,200 may occur, requiring tighter stops.
---
Fundamental Outlook
- Safe-Haven Demand: Rising tensions are likely to sustain gold's appeal.
- Inflation & Rate Outlook: Persistent inflation concerns and potential rate cuts (if economic data weakens) could further support gold.
- Negotiation Risk: De-escalation or Iran's concessions may pause the bullish momentum, leading to a reversal toward $3,340–$3,320.
---
Conclusion
Gold is in a strong bullish phase, driven by geopolitical risks and technical structure. Traders should focus on buying dips near $3,320–$3,370 with targets toward $3,439–$3,501. However, monitor the $3,320 support and geopolitical developments closely. If the trend breaks, a retest of $3,200 could follow. Always use stop-losses to manage risk.
Final Note: The market is highly volatile, so position sizing and risk management are critical. Stay alert for news updates and technical confirmations (e.g., closes above $3,378)
Xauusd(w)

GOLD ROUTE MAP UPDATEHey Everyone,
Great start to the week with our new 1H chart playing out to perfection!!!
We started with a gap on market open clearing our Bullish target. We then got our bearish target at 3348, followed with no ema5 cross and lock confirming the rejection into our bullish target 3376.
We now have ema5 cross and lock above 3376 opening 3395.
We will see levels tested side by side until one of the weighted levels break and lock to confirm direction for the next range.
We will keep the above in mind when taking buys from dips. Our updated levels and weighted levels will allow us to track the movement down and then catch bounces up.
We will continue to buy dips using our support levels taking 20 to 40 pips. As stated before each of our level structures give 20 to 40 pip bounces, which is enough for a nice entry and exit. If you back test the levels we shared every week for the past 24 months, you can see how effectively they were used to trade with or against short/mid term swings and trends.
The swing range give bigger bounces then our weighted levels that's the difference between weighted levels and swing ranges.
BULLISH TARGET
3376 - DONE
EMA5 CROSS AND LOCK ABOVE 3376 WILL OPEN THE FOLLOWING BULLISH TARGETS
3395
EMA5 CROSS AND LOCK ABOVE 3395 WILL OPEN THE FOLLOWING BULLISH TARGET
3419
EMA5 CROSS AND LOCK ABOVE 3419 WILL OPEN THE FOLLOWING BULLISH TARGET
3440
BEARISH TARGETS
3348 - DONE
EMA5 CROSS AND LOCK BELOW 3348 WILL OPEN THE SWING RANGE
3330
3306
EMA5 CROSS AND LOCK BELOW 3306 WILL OPEN THE SECONDARY SWING RANGE
3288
3271
As always, we will keep you all updated with regular updates throughout the week and how we manage the active ideas and setups. Thank you all for your likes, comments and follows, we really appreciate it!
Mr Gold
GoldViewFX

XAUUSD Analysis todayHello traders, this is a complete multiple timeframe analysis of this pair. We see could find significant trading opportunities as per analysis upon price action confirmation we may take this trade. Smash the like button if you find value in this analysis and drop a comment if you have any questions or let me know which pair to cover in my next analysis.

Gold is moving upward. Testing the ultimate pressure.Gold opened high at around 3397 and then quickly retreated. After hitting the lowest point of around 3346 in the European session, it continued to rebound. It fluctuated in a large range around 3360-80 many times, which also added a lot of confusion to the market.
After retreating to around 3355 again, it continued to move upward, reaching a high of around 3389. At present, the market still has upward momentum, and the key pressure above is maintained at 3400, which is also the previous high point and the last line of defense for the bears. If this position continues to be broken, the bulls may continue to move upward without resistance in the later period, with the target price around 3430-3450. The key support below is still maintained in the range of 3355-3340.
Judging from the current market, the short-term fluctuations may continue to expand, and the ultimate target above is maintained at around 3400. This position is likely to be broken, but the probability of continuing to rise is small. The current bulls may still be in a form of enticing more.
Operation strategy:
Short near 3395, stop loss 3410, profit near 3375.
If it continues to break below 3370, it will be seen around 3340. If it breaks through the extreme pressure level of 3400, we need to consider stopping the loss in time. .

USDJPY H2 Best Level to SHORT/HOLD TP +100/+200 pips🏆USDJPY H2 Market Update H2 chart
📊 Technical Outlook
🔸trading in well defined range
🔸trading near range highs now
🔸range highs set 148.40/148.80
🔸range lows set at 140.80/141.40
🔸strategy: SHORT SELL from resistance
🔸SL 60 pips TP1 +100 pips TP2 +200 pips
🔸swing trade setup for patient traders
🌍 FX Market Snapshot — June 2025
🇪🇺 EUR/USD (~1.1500)
Euro climbs near 1.15 as eurozone inflation cools and ECB turns more dovish.
Stable German sentiment provides support, but softer CPI could limit gains.
🔑 Support: 1.1445 | Resistance: 1.1550
🇬🇧 GBP/USD (~1.3435)
Pound slips toward 1.34 after recent highs, as UK data remains mixed.
Manufacturing picks up, but falling inflation boosts BoE rate cut bets.
🔑 Support: 1.3400–1.3420 | Resistance: 1.3500
🇺🇸 DXY (US Dollar Index, ~99.14)
Dollar edges higher as investors seek safety amid geopolitical tensions.
Mixed US economic signals; eyes on upcoming job data.
🔑 Support: 98.80 | Resistance: 100.00
🇯🇵 USD/JPY (~147.4)
Dollar rallies above 147 as yen weakens; BOJ stays ultra-loose.
Oil price spikes add extra pressure on JPY.
🔑 Support: 145.0 | Resistance: 148.5
📊 Quick View
Pair Rate Support Resistance Key Theme
🇪🇺 EUR/USD ~1.1500 1.1445 1.1550 Dovish ECB, soft CPI
🇬🇧 GBP/USD ~1.3435 1.3400–1.3420 1.3500 Mixed UK data
🇯🇵 USD/JPY ~147.4 145.0 148.5 Yen weakness
🇺🇸 DXY ~99.14 98.80 100.00 Geopolitical risks

XAU/USD Technical Analysis (Gold Spot vs USD):
📊 XAU/USD Technical Analysis (Gold Spot vs USD)
Current Price: 3,388.240 USD
Bias: Bullish breakout in progress
Methodology Used: Volume Profile + Ichimoku Cloud + Price Action
✅ Key Technical Highlights:
🟫 1. Price Breakout Through Ichimoku Cloud
Price has successfully broken above the Kumo (cloud), indicating the first sign of a potential trend reversal.
The bullish breakout is supported by a strong bullish candle closing above the red cloud (Senkou Span A/B), confirming momentum shift to buyers.
📉 2. Kumo Twist Ahead
The cloud ahead is thin and flipping, which often allows easy passage for price continuation upward.
The future cloud is turning green, suggesting potential trend formation or early-stage uptrend.
📈 3. Volume Profile Support
Price action is bouncing from a low-volume node and is now entering a higher-volume area, which typically accelerates moves due to stronger interest.
🟢 4. Target Zone
The expected price move (marked with a curved projection) shows a retest of cloud support followed by a sharp rally toward ~3,420 USD.
This level aligns with prior structural highs and likely liquidity pools, making it a smart target zone.
🧠 Market Psychology Behind the Move:
Extended consolidation below cloud = accumulation
Break above cloud = trigger for trend followers
Thin future Kumo = low resistance
Target aligns with breakout traders and stop hunt zones
📌 Trading View Summary:
Parameter Details
Trend Bias Bullish (short-term breakout)
Support Zone 3,360 – 3,365 USD
Cloud Base (Kijun) Acting as dynamic support
Target Area 3,420 USD
Invalidation Daily close back below 3,355 USD with rejection
📢 Conclusion:
Gold (XAU/USD) is showing a bullish reversal pattern supported by Ichimoku signals and strong structure breakout. A short pullback is expected into the cloud (retest), followed by a sharp upward rally. Traders should watch for confirmation candles and volume spikes above 3,390 for a solid long entry.

Gold Strongly Builds a Bottom to Test ResistanceDespite the U.S. air strikes on three Iranian nuclear facilities intensifying geopolitical tensions on Monday, the U.S. dollar stabilized at high levels supported by hawkish expectations of the Federal Reserve, restricting gold bulls. Although geopolitical risks should theoretically boost gold's safe-haven demand, the market showed relative caution, partly due to recent hawkish remarks from Fed officials. While the dot plot implies two possible rate cuts this year, only one rate cut is expected for 2026 and 2027 respectively, a prospect that limits gold's upside potential.
The market is currently focused on the upcoming release of U.S. June PMI data, which will serve as a key barometer for the economic outlook. If the data comes in strong, it will further strengthen the long-dollar stance, and gold may continue to be under pressure. Conversely, if the PMI falls short of expectations, gold is expected to gain short-term support. Gold opened gap-up today but then trended lower, stabilizing and rebounding after touching $3,346, and once again hovering around the high of $3,388. The market outlook still focuses on high-level adjustments.
you are currently struggling with losses,or are unsure which of the numerous trading strategies to follow,You have the option to join our VIP program. I will assist you and provide you with accurate trading signals, enabling you to navigate the financial markets with greater confidence and potentially achieve optimal trading results.
Trading Strategy:
buy@3350-3360
TP:3380-3390

GOLD - WAVE 5 BULLISH TO $3,622 (UPDATE)We’ve been seeing heavy pump & dumps since last night on Gold, which is no surprise as I told you all last week we are currently in a ‘buying accumulation phase’.
Overall, buyers are holding strong above our Wave 2 zone & above the 0.618% Fib.

GOLD - AnalysisHello Traders,
Gold is still consolidating in this range 3350 to 3390. Long term we're targeting 3450 buys.
Currently in buys from 3362.
Trade with care. Note that this is not a trading call.
Thanks

XAUUSD Channel Up bottomed, giving a strong buy signal.Gold (XAUUSD) has been trading within a 1-month Channel Up since the May 20 low and right now it is consolidating within and just outside the 4H MA50 (blue trend-line) and 4H MA100 (green trend-line) zone. At the same time, it has touched the bottom of the Channel Up.
This is exactly the kind of price action the pattern had during its previous bottom formation following a Higher Low (June 9-11). With the 4H RSI having also formed a Higher Low pattern consistent with all previous 3 Lows, we expect the price to start its new Bullish Leg now. Our Target is 3495 (+4.75% from the bottom).
-------------------------------------------------------------------------------
** Please LIKE 👍, FOLLOW ✅, SHARE 🙌 and COMMENT ✍ if you enjoy this idea! Also share your ideas and charts in the comments section below! This is best way to keep it relevant, support us, keep the content here free and allow the idea to reach as many people as possible. **
-------------------------------------------------------------------------------
Disclosure: I am part of Trade Nation's Influencer program and receive a monthly fee for using their TradingView charts in my analysis.
💸💸💸💸💸💸
👇 👇 👇 👇 👇 👇

Gold price PMI positive, slight increase⭐️GOLDEN INFORMATION:
Gold prices (XAU/USD) edge higher toward $3,375 in early Asian trading on Monday, driven by heightened geopolitical tensions following US President Donald Trump’s decision to intervene militarily in the Israel-Iran conflict. The move significantly escalates the situation in the Middle East, fueling demand for safe-haven assets like gold.
The US launched airstrikes on three Iranian nuclear facilities early Sunday, marking a direct entry into the conflict despite Trump’s prior pledges to avoid new overseas wars. The intensifying turmoil has sparked a wave of risk aversion, supporting bullion prices amid rising uncertainty. Meanwhile, investors will closely monitor the preliminary S&P Global US Purchasing Managers’ Index (PMI) for June, due later in the day, for further market direction.
⭐️Personal comments NOVA:
Gold prices continue to be supported around the 3340 mark, positive with today's US PMI news data
⭐️SET UP GOLD PRICE:
🔥SELL GOLD zone: 3380- 3382 SL 3387
TP1: $3370
TP2: $3360
TP3: $3350
🔥BUY GOLD zone: $3318-$3316 SL $3311
TP1: $3326
TP2: $3338
TP3: $3349
⭐️Technical analysis:
Based on technical indicators EMA 34, EMA89 and support resistance areas to set up a reasonable BUY order.
⭐️NOTE:
Note: Nova wishes traders to manage their capital well
- take the number of lots that match your capital
- Takeprofit equal to 4-6% of capital account
- Stoplose equal to 2-3% of capital account

GOLD What Next? SELL!
My dear friends,
My technical analysis for GOLD is below:
The market is trading on 3376.9 pivot level.
Bias - Bearish
Technical Indicators: Both Super Trend & Pivot HL indicate a highly probable Bearish continuation.
Target - 3366.2
Recommended Stop Loss - 3383.0
About Used Indicators:
A pivot point is a technical analysis indicator, or calculations, used to determine the overall trend of the market over different time frames.
Disclosure: I am part of Trade Nation's Influencer program and receive a monthly fee for using their TradingView charts in my analysis.
———————————
WISH YOU ALL LUCK
Breakout from Demand Zone🟡 XAU/USD – 2H Chart Analysis
Title: “Compression Breakout From Demand Zone – Room to Revisit Highs”
Bias: Bullish (Momentum Confirmation)
Timeframe: 2H
Chart Reference: MJTrading – June 23, 2025
📍 Context & Structure:
Gold has just broken out of a multi-candle compression range after tapping into a well-defined demand zone between $3,333 – $3,346. This area acted as the launchpad for previous rallies and is now showing fresh signs of accumulation.
Two EMAs (15 & 60) are attempting a bullish crossover, supporting a shift in momentum.
📈 Trade Setup (Long Bias):
Entry: ✅ Market or retest at $3,366
Stop Loss: 🔴 Below the recent demand base at $3,330
Target 1: 🟢 $3,415 (local swing high)
Target 2: 🟢 $3,460–$3,480 (upper major supply / range top)
R/R Ratio: 🔁 ~2
🔍 Why It Matters:
✅ Price defended key demand zone
✅ Strong engulfing candle with decent volume signals a reversal
⚖️ MJTrading Note:
“Gold thrives on uncertainty — and this bounce from a high-confluence demand zone could be the beginning of a push back toward the highs, especially if macro data shifts in favor.”
#MJTrading #Gold #XAUUSD #Forex #chart #signal #buy #long

SPY/QQQ Plan Your Trade For 6-23 : CRUSH PatternToday's CRUSH pattern suggests the markets will struggle to find any support for a rally. A CRUSH pattern is usually a large breakdown type of price bar that moves aggressively against the dominant trend.
Som, today I'm expecting some fairly large price action and I believe the markets may start a breakdown move this week as we continue to get more news related to the Israel/Iran/US conflict.
This week will be a "resettling" week in my opinion. Buyers will start to actively liquidate and reposition assets as we move deeper into this conflict. When buyers turn into sellers (to get out), the markets usually react very aggressively in trend.
Metals continue to hold up without making any big moves. I believe the increased FEAR level could play out as a moderate rally for metals over the next 15-30+ days.
BTCUSD broke down very hard (more than 6%) over the past 3-4+ days. This is a big move downward for Bitcoin and could suggest US technology stocks/sectors could also collapse on fear of a "rollover top" in the US stock market.
Smart traders will hedge and pull capital away from this potential top - just like I've been suggesting for the past 2-3+ weeks.
Oddly enough, if we do get a rollover/top this week because of the Iran conflict, it plays right into my Excess Phase Peak pattern and the predictions I've been making over the past 4+ months.
No, I don't foresee events like this Israel/US/Iran conflict. I can't see into the future.
What I can do, and continue to try to deliver, is the best analysis I can offer without becoming BIASED by indicators, comments, or other inputs.
I just read the chart and will tell you what I see as the most likely outcome.
Get some..
#trading #research #investing #tradingalgos #tradingsignals #cycles #fibonacci #elliotwave #modelingsystems #stocks #bitcoin #btcusd #cryptos #spy #gold #nq #investing #trading #spytrading #spymarket #tradingmarket #stockmarket #silver

Gold opens high and moves lower, focus on 3340 support📰 Impact of news:
1. Federal Reserve Board member Bowman speaks on monetary policy and the banking industry
2. The United States intervenes in the Iran-Israel conflict and pays attention to the geopolitical situation
📈 Market analysis:
In the early Asian session, gold prices surged but failed to break through the key watershed of 3405. The current risk aversion conflict failed to break through the key resistance level, so the short-term trend is still weak and bearish. On the hourly chart, gold continues to retreat. As the current short-selling momentum continues to gain momentum, we will first look at whether the double bottom support of 3340 is effective. If it fails to break through while retreating, we can consider a short-term upward rebound in the support and consider going long. Looking at the second decline point at 3370-3375, unless the news stimulates the gold trend, you can still consider placing short orders if it touches the 3370-3380 line! On the whole, pay attention to the resistance line of 3370-3380 above and the support line of 3345-3335 below.
🏅 Trading strategies:
BUY 3350-3345-3335
TP 3360-3370-3380
SELL 3370-3380
TP 3360-3350-3345
If you agree with this view, or have a better idea, please leave a message in the comment area. I look forward to hearing different voices.
OANDA:XAUUSD FX:XAUUSD FOREXCOM:XAUUSD FXOPEN:XAUUSD TVC:GOLD

Trade Idea: Long XAUUSD (BUY STOP)1️⃣ Multi-Timeframe Structure
• 1 Hour (Macro):
• Trend: Bullish. 20 SMA is riding above the 50 SMA .
• Price has broken above the prior resistance at 3374.50 and is now retesting it as support.
• 15 Minute (Tactical):
• After a clear push down into 3340.37, price rallied back above 3374.50.
• SMAs have flipped back bullish, and volume during the retest shows absorption of selling pressure.
• 3 Minute (Entry Precision):
• Micro-green candle wicks show a small scratch of buyers stepping in just above 3374.50.
• Momentum is picking up to the upside, but we want confirmation of strength before committing.
⸻
2️⃣ Trade Execution
▶️ Entry: Buy Stop at 3379.50
• Wait for a clean 3 m/15 m push above the short-term swing high (~3379) to confirm buyers are in control.
✂️ Stop Loss: 3374.50
• Just below the broken resistance-turned-support level.
• True structural invalidation of this bullish thesis.
🎯 Take Profit: 3394.50
• Targets the next logical resistance cluster (round number area and prior swing highs) for ~15 pt gain.
Risk-Reward ≈ 1:3 (SL = 5 pts, TP = 15 pts)
⸻
3️⃣ Invalidation & Expiry
❌ Cancel the pending Buy Stop at 3379.50 if either:
1. A full 15 m candle closes below 3374.50 before entry.
2. It’s not triggered by 8:30 AM PST.

Gold INTRADAY moving higher on Geopolitical riskGold price action signals bullish bias, with a recent intraday move higher. The possibility of further geopolitical escalation between the US and Iran could trigger increased demand for gold as a safe haven.
Gold’s price action sentiment remains bullish, underpinned by a well-established rising trend. However, recent intraday movement suggests a corrective pullback or short-term consolidation, likely in response to overbought conditions or short-term profit-taking.
Key Technical Levels:
Support:
3,330 – Key short-term support and previous consolidation zone; the critical pivot level for trend continuation.
3,315 – Secondary support; minor structural level.
3,300 – Psychological and technical support; near-term bearish target on a breakdown.
Resistance:
3,390 – Immediate upside target on a bullish continuation.
3,420 – Medium-term resistance; aligns with prior highs.
3,450 – Longer-term target, marking the upper boundary of the current bullish channel.
Scenario Analysis:
Bullish Continuation (Base Case):
If Gold maintains above the 3,330 level and confirms a bullish bounce, the broader uptrend is expected to resume, with upside targets at 3,390, followed by 3,420 and 3,450 over time.
Bearish Reversal (Alternative Scenario):
A daily close below 3,330 would negate the short-term bullish structure, exposing the market to deeper retracements toward 3,315 and 3,300, where further demand could emerge.
Conclusion:
Gold remains in a bullish trend, with the current pullback seen as corrective. The 3,330 level is a critical inflection point: holding above it supports further upside momentum, while a breakdown below this level would challenge the bullish outlook and potentially signal a deeper retracement. Traders should monitor price action around this zone for directional confirmation.
This communication is for informational purposes only and should not be viewed as any form of recommendation as to a particular course of action or as investment advice. It is not intended as an offer or solicitation for the purchase or sale of any financial instrument or as an official confirmation of any transaction. Opinions, estimates and assumptions expressed herein are made as of the date of this communication and are subject to change without notice. This communication has been prepared based upon information, including market prices, data and other information, believed to be reliable; however, Trade Nation does not warrant its completeness or accuracy. All market prices and market data contained in or attached to this communication are indicative and subject to change without notice.

Gold Market Analysis and Trading Recommendations for TodayLast Friday, the overall gold price on the technical side continued to be under pressure, retracing and oscillating in adjustment. Eventually, it stabilized at the 3340 level before the close, rebounding and oscillating to close. The daily K-line reported an oscillating digital K. The overall gold price continued the recent suppressed oscillating consolidation.
However, over the weekend, the US military attacked Iranian nuclear facilities, intensifying geopolitical tensions in the Middle East, and market risk-aversion sentiment heated up. This morning, the gold price gapped up, piercing the 3390 level, reaching a high of around 3398 before retracing and falling into oscillation.
In the short term, it is highly probable that the gold price will continue to operate in a wide-ranging oscillating interval between long and short positions, continuing to trade time for space. Although the gold price opened high and moved low, it still has not broken the long-term trend channel. Looking for opportunities to go long on retracement is also the current trend.
From the current market trend, today's technical support on the downside focuses on around 3350 - 3345, and the short-term resistance on the upside is around 3380 - 3385, with a key focus on the 3395 - 3405 level. For the day, first, rely on this interval to maintain the main tone of participating in the long - short cycle. For positions in the middle range, always observe more and trade less, and be cautious about chasing trades. Patiently wait for key points to enter the market.
XAUUSD
buy@3345-3355
tp:3370-3390-3410
Investment itself is not the source of risk; it is only when investment behavior escapes rational control that risks lie in wait. In the trading process, always bear in mind that restraining impulsiveness is the primary criterion for success. I share trading signals daily, and all signals have been accurate without error for a full month. Regardless of your past profits or losses, with my assistance, you have the hope to achieve a breakthrough in your investment.

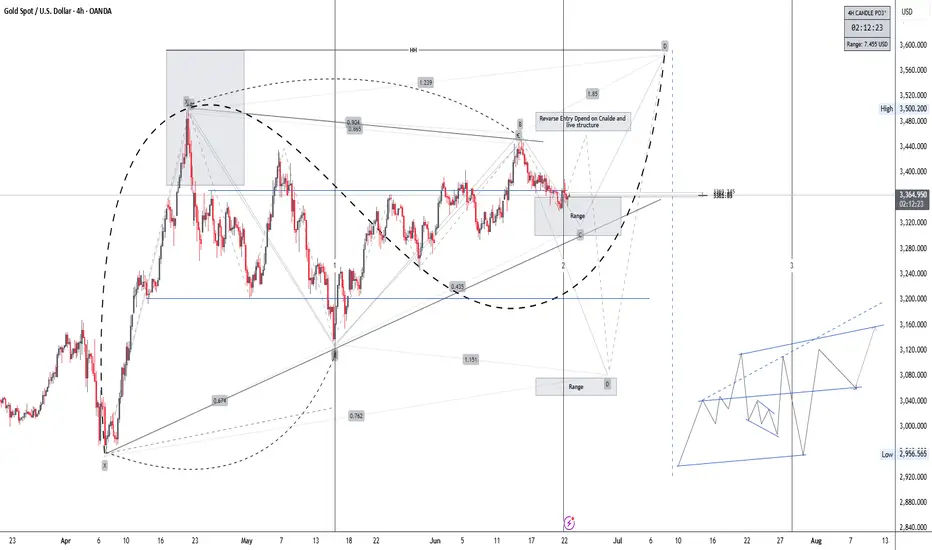
XAUUSD H4Gold is forming a bullish structure on the 4H chart. Price is consolidating at a key reversal zone (Point C). If we get bullish confirmation, I’m targeting:
$3,400 short-term
$3,500 next
$3,560+ final leg (Point P)
Support at $3,300 must hold—below that, I’ll re-evaluate.
Watching closely for a breakout and retest above the trendline before entering.
Not financial advice – just my view.
XAUUSD and USOILHesitation Geopolitical factors have led to the escalation of relations between several countries. The Middle East is in chaos. Although this is a trading market, the relationship between the two is too close. This is why the Asian market XAUUSD reached a high of 3400.
But it is not stable. Because after the news that stimulated the rise in gold prices over the weekend, there were some negative news. For example, peace talks, time differences, negotiations and other factors have eased the tense atmosphere. Then the gold price fell with the trend, reaching a low of 3347.
From the overall situation, the market still has the momentum to rise in the short term. But this depends on Iran's response. Including the impact of the Strait of Hormuz. This is the key factor in the rise or fall of oil prices. Investors with larger funds can arrange long orders in advance.
The view on XAUUSD is to buy at low levels. The impact of geopolitics is too huge. On the basis of interest rate cuts, buying is the key to profit. But everyone's financial situation is different, so when trading, remember to control the position ratio. Prevent trading errors from leading to account liquidation.

DeGRAM | GOLD bullish takeover from support📊 Technical Analysis
● The XAUUSD 4-hour chart, as shown in the upper right corner, presents a clear bullish structure within a well-defined rising channel. Price action has consistently respected both the lower and upper boundaries of this channel, with multiple bounces off support levels reinforcing the trend. Recently, the chart highlights a “bullish takeover” after a brief pullback, where price found support at 3,345.47 and quickly reclaimed ground above the channel’s median. The forecasted path, illustrated by the projected arrows, suggests a continuation toward the resistance zone at 3,431.14, with the channel’s upper boundary acting as a dynamic target. The presence of higher lows and the swift recovery from the latest dip further confirm the underlying bullish momentum.
● The technical setup is strengthened by the clear identification of support and resistance levels. The 3,293.50 area has repeatedly served as a strong base, while the 3,431.14 level is marked as the next significant resistance. The rising channel itself provides a visual framework for the ongoing uptrend, and the recent bullish engulfing pattern at support signals renewed buying interest. The chart’s structure, with its clean trendlines and labeled zones, points to a high-probability scenario for further gains as long as price remains within the channel.
💡 Fundamental Analysis
● Recent fundamentals support the technical case for continued upside in gold. As of June 22-23, 2025, gold is trading near 3,364, with market sentiment buoyed by ongoing geopolitical tensions in the Middle East and persistent global economic uncertainty. While Citi has revised its long-term gold forecasts downward, Bank of America maintains a bullish outlook, citing safe-haven demand amid US military actions and inflation concerns. Additionally, the latest data shows that gold remains above key moving averages, and the Relative Strength Index (RSI) is holding near neutral, suggesting room for further upside. The combination of technical resilience and supportive macro factors continues to attract buyers to gold as a hedge against volatility.
✨ Summary
● XAUUSD is poised for a move toward 3,431.14, with the rising channel and recent bullish takeover pattern supporting the case for further gains. The bullish scenario remains valid as long as price holds above 3,345.47, with 3,293.50 serving as a critical support. A sustained break above resistance could open the path to new highs, while a drop below channel support would warrant a reassessment of the trend.
-------------------
Share your opinion in the comments and support the idea with a like. Thanks for your support!

XAUUSD: Market Analysis and Strategy for June 23Gold technical analysis
Daily chart resistance 3450, support 3338
4-hour chart resistance 3395, support 3342
1-hour chart resistance 3373, support 3345
Today's gold trend, due to the geopolitical risk aversion caused by the weekend news, the gold price quickly rose and then fell, opening high and moving low. Today, the gold price fell to a low of 3347 and rebounded. At present, the gold price remains in the range of fluctuations. The trend of short-term gold prices fluctuates and falls. In terms of operation, don't rush to chase high prices. Although conflicts in the Middle East have been frequent recently, it seems that the impact on gold prices has also begun to weaken! The short-term key support position below is near 3340, and the important pressure position is near 3370-75
SELL:3372near
SELL:3400near
BUY:3350near

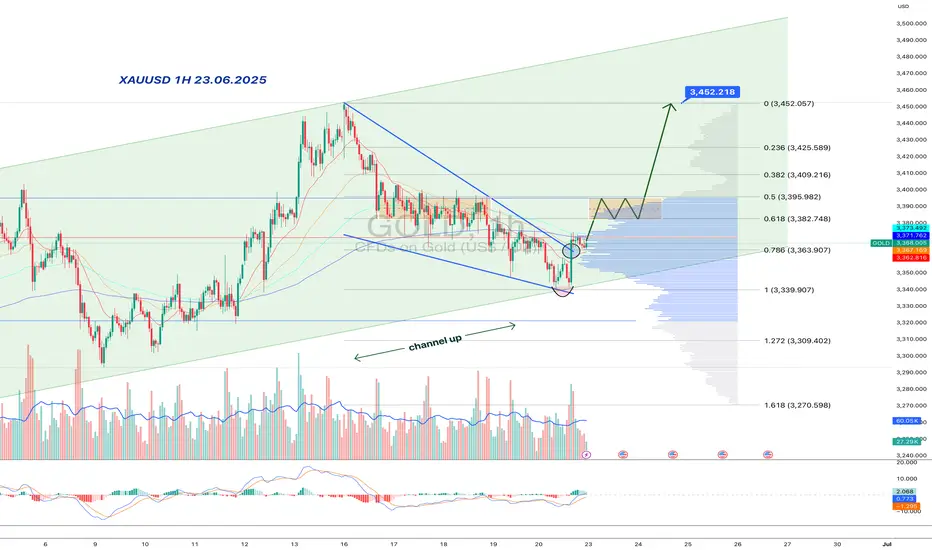
Gold:bullish wedge inside a rising channel-double trap for bearsInside the major upward channel, gold formed a falling wedge — and, of course, faked a breakdown. But the move reversed quickly: price reclaimed the wedge, surged on volume, and held above the key 3363–3368 area. This isn't just a bounce — it's a structural reclaim in line with the broader trend.
Price is now in the upper part of the rising channel and has broken a local downtrend line, reinforcing the bullish signal. Consolidation around 3380–3395 might be the last pause before acceleration. Above that lies a volume gap — no resistance until 3452.
MACD is flipping bullish, RSI turning upward, and volume confirms smart money presence. Classic: trap below, breakout above. As long as 3363 holds — longs remain in control.