XAUUSD – Is Gold About to Break Out of Balance? Market Overview As the U.S. dollar maintains its upward momentum fueled by expectations that the Federal Reserve will keep interest rates elevated for an extended period, gold (XAUUSD) is currently trading near the key Point of Control (POC) for June. The consolidation around the $3,350–$3,360 zone indicates a temporary balance of supply and demand, and the market appears to be gearing up for a strong directional breakout in the upcoming sessions.
Detailed Technical Analysis ✅ Volume Profile & Price Structure
POC (highest volume level): $3,360 – the central volume area for the week/month
Current price: $3,353 – just below the POC, reflecting selling pressure dominance
Price is reacting to the demand zone at $3,343–$3,345, with significant volume support below
Short-term reversal signals from ParLE and ParSE indicators suggest a potential market shift
🔍 Key Resistance Levels:
$3,360 – POC and immediate resistance zone
$3,398 – previous supply zone with strong rejection history
$3,451 – Fibonacci extension high and the strongest resistance for the month
🔍 Key Support Levels:
$3,345 – high-volume support cluster
$3,343 – Fibonacci and dynamic support zone
$3,276 – final support before mid-term structure breakdown
🎯 XAUUSD Trading Strategy for Today (June 23, 2025) 🔻 Primary Scenario: SHORT based on short-term bearish structure
Entry: $3,358–$3,360 (on POC retest + bearish rejection candle)
Stop Loss: $3,370
Take Profits:
TP1: $3,345
TP2: $3,343
TP3: $3,327
Probability: High, if price remains below POC
🔺 Alternative Scenario: LONG if price holds $3,343 support
Entry: $3,343–$3,345 (strong bullish candlestick setup in demand zone)
Stop Loss: $3,330
Take Profits:
TP1: $3,360 (POC)
TP2: $3,383
TP3: $3,398
⚠️ Risk Warning & Macro Factors to Watch
The USD Index is surging – applying downward pressure on gold
Fed's short-term rate projections (FedWatch Tool) reflect “no cut” expectations through Q3
Traders should maintain tight risk management within high-volume zones to avoid false breakouts
Follow @Henrybillion ” to stay updated with the most accurate and actionable XAUUSD trading ideas every day!
Xauusd(w)

Gold Short Term OutlookGold is currently trading around $3,368, caught between dynamic moving average resistance and an intraday resistance zone.
Price must break and hold above the $3,378 resistance to open the path toward $3,395. A confirmed break above the key $3,395 level could signal the start of the next bullish leg.
However, repeated failure to break above $3,395 — or even $3,378 — may drag gold lower into key support zones.
📌 Key Levels to Watch:
Resistance:
$3,375 • $3,395 • $3,418 • $3,439
Support:
$3,361 • $3,346 • $3,330 / $3,306
$3,287 – Critical demand zone
🧠 Fundamental Insight:
Gold remains supported amid rising geopolitical tensions. Over the weekend, U.S. airstrikes targeted Iranian nuclear sites, escalating concerns over a broader conflict in the Middle East. This has reignited safe-haven demand, with gold catching a bid despite recent technical pullbacks.
Meanwhile, traders are weighing softer U.S. inflation signals against the Fed’s cautious stance. If tensions persist and economic data weakens, gold could benefit from both risk-off flows and increased speculation around potential rate cuts.

XAUUSD – Are the Bulls Back? Key Reversal Zone in PlayXAUUSD – Are the Bulls Back? Key Reversal Zone in Play
Gold has been consolidating in a tight range for several sessions, but both macro and technical indicators are pointing to a potential breakout. With volatility expected to rise, traders should keep a close eye on these high-probability zones.
🌍 Macro Overview – Is the Tide Turning for Gold?
📉 The Fed remains hawkish, but market sentiment has shifted, with over 65% probability priced in for a rate cut in September. This adds pressure on the dollar and offers upside potential for gold.
💸 10-year US Treasury yields are stabilizing, reducing the opportunity cost of holding gold and reigniting interest from risk-averse investors.
⚠️ Ongoing geopolitical risks in the Middle East and Eastern Europe continue to fuel demand for safe-haven assets.
🏦 Central banks, especially in China and India, are steadily increasing their gold reserves — a bullish long-term signal for the market.
📊 Technical Outlook – Watch the Fair Value Gap (FVG)
The 3325–3327 support zone aligns with an unfilled FVG on H1-H4 charts, providing a key area for bullish momentum to resume.
Sustained price action above this level may open a path toward 3360 and beyond.
Conversely, if price reaches the 3398–3400 resistance area and shows signs of exhaustion, it could trigger a short-term pullback.
✅ Trade Setup
🟢 BUY ZONE: 3327 – 3325
SL: 3320
TP Targets: 3330 → 3335 → 3340 → 3345 → 3350 → 3355 → 3360 →
🔴 SELL ZONE: 3398 – 3400
SL: 3405
TP Targets: 3395 → 3390 → 3386 → 3380 → 3375 → 3370 → 3360
⚠️ Final Thoughts
The gold market is approaching a decision point... With the PCE and US GDP data due this week, traders should expect a potential volatility spike.
Risk management remains key — wait for confirmation at key levels, stick to your plan, and don’t let emotions override discipline. This week could offer strong directional moves for gold, but only for those prepared.

XAU/USD: Market Dynamics Analysis and Trading StrategiesI. Market Trends and Sentiment Analysis
Driven by the U.S. military intervention in the Middle East conflict, gold exhibited violent fluctuations of "gap-up opening followed by rapid correction" in early trading:
- Price Performance: After gapping up to $3,395/oz, the intraday maximum decline approached $50, hitting a low of $3,347 and currently trading around $3,355—reflecting intense battles between bulls and bears at key levels.
- Sentiment Drivers: While risk aversion boosted safe-haven demand, short-term corrections were jointly triggered by profit-taking from prior long positions and institutional market-washing maneuvers. Note that the weekly "bull-bear alternating" volatility pattern remains intact, with no unilateral trend established yet.
II. Technical Key Levels and Trend Qualification
1. Support & Resistance Structure
- Strong Support: $3,340–$3,350 range (confluence of May’s low and 60-day moving average), a bottom platform tested three times in the past two weeks with robust buying support.
- Short-term Resistance: $3,375–$3,380 (lower edge of the early gap + 4-hour Bollinger Band midline), with a breakthrough targeting the $3,400 psychological level.
2. Cycle Pattern Analysis
- Weekly Frame: Two consecutive weeks of alternating bull/bear candlesticks, with RSI anchored in the 50–60 neutral zone, indicating ongoing tug-of-war between long/short forces.
- Daily Frame: Today’s correction held above the prior low of $3,340, forming a "long lower-shadow bearish candlestick"—signaling active buying at lows and suggesting the correction may be nearing conclusion.
III. Trading Strategy: Capitalize on Correction Entries
- Entry Zone: Layered long positions at $3,340–$3,350, with $3,340 as the invalidation stop (shift to neutral if breached).
- Target Levels: Initial target at $3,375–$3,380 (short-term profit-taking), with a break above eyeing $3,400 (mid-to-long-term target).
- Trading Logic: Support validity + weekly range-bound bullish bias, with corrections viewed as benign within the broader trend.
IV. Risk Controls & Operational Notes
- No Chasing Shorts: The current correction is a technical retracement within the uptrend; chasing shorts risks falling into a "bear trap".
- Dynamic Monitoring: Closely track the $3,340 support threshold and evolving Middle East developments.
XAUUSD
buy@3340-3350
tp:3365-3375
I am committed to sharing trading signals every day. Among them, real-time signals will be flexibly pushed according to market dynamics. All the signals sent out last week accurately matched the market trends, helping numerous traders achieve substantial profits. Regardless of your previous investment performance, I believe that with the support of my professional strategies and timely signals, I will surely be able to assist you in breaking through investment bottlenecks and achieving new breakthroughs in the trading field.

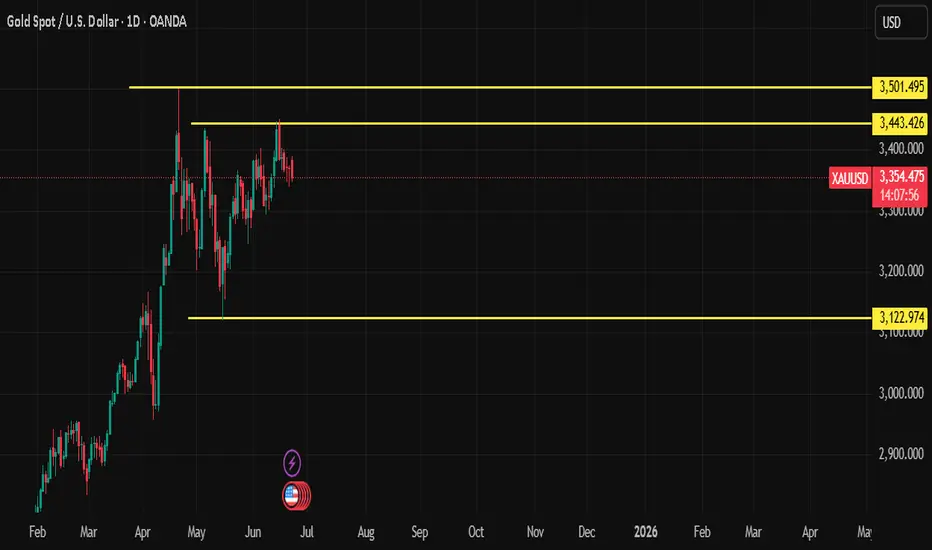
Gold Medium Term OutlookGold is currently trending within a rising channel after rejecting the $3,439 resistance zone, which marked a new Higher High (HH). Price is respecting the ascending channel support and is now testing the 50MA. The uptrend remains intact, with a sequence of Higher Lows (HL) and Higher Highs (HH) forming within the channel.
A break and hold above $3,378 could open the path for a re-test of $3,439 and potentially $3,501. However, failure to hold the rising channel support may shift momentum bearish, with $3,303 and $3,226 as the next major downside targets.
📌 Key Levels to Watch This Week:
Resistance: $3,378 • $3,439 • $3,501
Support: $3,303 • $3,226 • $3,171
🧠 Fundamental Insight:
Gold remains supported amid rising geopolitical tensions. Over the weekend, U.S. airstrikes targeted Iranian nuclear sites, escalating concerns over a broader conflict in the Middle East. This has reignited safe-haven demand, with gold catching a bid despite recent technical pullbacks.
Meanwhile, traders are weighing softer U.S. inflation signals against the Fed’s cautious stance. If tensions persist and economic data weakens, gold could benefit from both risk-off flows and increased speculation around potential rate cuts.

GOLD/USDGold is in a range on the daily time frame, and if you know how to trade in a range market, use this analysis.
GOLD/USDGold is in a range on the daily time frame, and if you know how to trade in a range market, use this analysis.

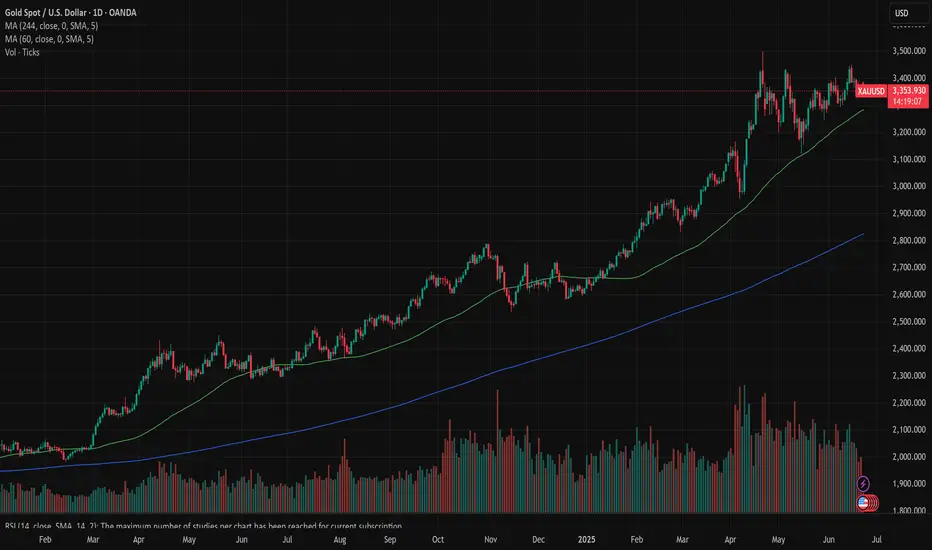
Gold: waiting the U.S. decisionGold was traded in a relaxed manner during the previous week, as investors are anticipating the final decision of the U.S. Administration, regarding their involvement in the Middle East conflict. On the other hand, the Fed held interest rates unchanged at the FOMC meeting during the previous week. The price of gold reached its highest weekly level at the start of the week, at $3.446 and for the rest of the week was traded in a modestly negative sentiment, ending the week at $3.368.
The RSI continues to move between levels of 60 and 53. This shows that investors are still not certain which side to trade. The indicator is still holding more close toward the overbought market side. There is still no change with MA 50 and MA 200 lines as they continue to move in parallel with an uptrend. Still, charts are showing that the price of gold found a supporting line with MA50, since April this year.
Analysts are noting that central banks continue to be one of major gold buyers. Considering high geopolitical and economic uncertainties, the price of gold has the potential to go even higher from current levels. However, for the week ahead, charts are showing that some further corrections might be possible, at least till the level of $3,2K. Some stronger corrections should not be expected. The price of gold also has equal opportunities for a move toward the upside, where the level of $3.430 might be tested for one more time. There is also the potential for higher grounds, but it is unclear whether it will occur in the week ahead or probably at a longer time frame.
GOLD Price Forecast: Is the Pullback Over? | Weekly OutlookWill XAUUSD resume its bullish trend, or is more downside ahead?
In this video, I break down last week’s gold price movement and the current market reaction to rising geopolitical tensions between Iran and Israel, now with the U.S. joining the conflict. We also assess the impact of the Fed’s recent rate hold, weak retail sales, and upcoming high-impact U.S. economic events like PMI, GDP, and Core PCE.
💡 Here’s what you’ll learn:
✅What caused gold’s pullback last week
✅Why institutional traders shake out retail buyers
✅Key fundamentals driving gold right now
✅How to position yourself smartly for the upcoming trading week
🔔 Don’t forget to like the video in support of this work.
Disclaimer:
Based on experience and what I see on the charts, this is my take. It’s not financial advice—always do your research and consult a licensed advisor before trading.
#goldanalysis, #xauusd, #goldforecast, #goldpriceprediction, #forexanalysis, #fundamentalanalysis, #forextrading, #tradinggold, #goldnews, #federalreserve, #marketpsychology, #tradingstrategy, #geopoliticalrisk, #usdata, #iranisraeltensions, #goldbullish, #goldbearish, #forexmentor, #xauusdforecast, #tradingview

GOLD Intraday H1 Chart Update For 23 June 25 GOLD Intraday Chart show mid term Bearish move for now
For Today keep an eyes on 3368 level Breakout for Buy Scalping for long trade we may wait for dip around 3330-3340 zone SL remains possibly 100 pips
As long as market sustains below 3400 Psychological Level it will remains Bearish and will try to move towards 3200-30 Psychological

Gold (XAU/USD) 4H Analysis-23 June 2025Gold (spot XAU/USD) is currently trading around $3,358. On the 4-hour chart, price has been range-bound between $3,356 and $3,400. Recently, gold attempted to break higher (up to around $3,394) but quickly reversed — a sign that the breakout may have been a smart money trap. Technically, the structure saw a break below $3,380 in mid-June, leading to a push toward the $3,323 region. This reflects a short-term bearish wave followed by stabilization near the lows.
Bias: The market is currently neutral-to-bullish, depending on key supports. As long as price holds above the $3,322–$3,330 swing-lows, dips are considered buying opportunities. Notably, an order block/demand zone around $3,357–$3,360 appears to be holding well and attracting buyers. On the upside, $3,400 acts as a strong resistance level. A break above $3,400 would shift the bias firmly bullish, while a break below $3,338 would suggest bearish momentum returning.
🔑 Key 4H Support & Resistance Levels
Resistance:
• $3,400 – Major round number and recent high
• $3,434–$3,435 – Next resistance above $3,400
• $3,451–$3,452 – Recent swing top
• $3,500 – All-time-high level
Supply Zone:
• $3,388–$3,394 – Minor resistance and previous support turned supply
Demand Zone (Order Block):
• $3,357–$3,360 – Major 4H demand area showing strong buyer interest
Support:
• $3,338 – Critical support level below the order block
• $3,322–$3,323 – Multi-source key swing support
• $3,280–$3,300 – Lower targets if support fails
• $3,260 or below – Worst-case downside projection if breakdown accelerates
📈 1-Hour Intraday Trade Setups
Buy the Dip
• Entry: $3,357–$3,360
• Confirmation: Bullish reversal candle on 1H
• Stop Loss: Below $3,336
• Targets: $3,380 → $3,400
Sell a Rejected Rally
• Entry: Near $3,400 (only if clear rejection is seen)
• Confirmation: Bearish reversal candle or price stalling
• Stop Loss: Above $3,400
• Targets: $3,360 → $3,330
Breakdown Short
• Entry: If price breaks below $3,338 with strong 1H close
• Stop Loss: Above $3,345
• Targets: $3,323 → $3,300
Bullish Breakout Trade
• Entry: Break and retest above $3,400
• Confirmation: Clean 1H close above $3,400
• Stop Loss: Just below $3,400
• Targets: $3,434 → $3,452
✅ Final Takeaway
Gold is currently trading inside a $3,330–$3,400 range. The best intraday opportunity is to buy dips into the $3,357–$3,360 demand zone with a stop below $3,330, targeting $3,400+. If support breaks, flip to short toward $3,320–$3,300.

GOLD recovers market overview, key outlookOANDA:XAUUSD is under downward pressure, and ended last week's trading session with a decline. With tensions in the Middle East easing slightly and the Federal Reserve giving a hawkish signal, the safe-haven demand in the gold market tends to weaken, and investors' profit-taking intentions increase, these are the main reasons why gold recorded a significant correction this week.
Gold prices fell last week as safe-haven demand weakened as tensions in the Middle East temporarily eased. President Trump said he would decide on military action against Iran in the next two weeks, a concession that helped ease fears of an escalation. Although Iran continued to launch missiles at Israel, the situation has not spread. However, the Middle East conflict remains risky and is unlikely to end completely.
Gold prices are under pressure due to the Fed's hawkish tone. Although the Fed kept interest rates unchanged, Chairman Powell warned of inflation risks, especially from Trump's new tax policies. At the same time, Mr. Chris Waller's statement showed that the possibility of a July interest rate cut also depends on the inflation situation, causing market expectations to decrease and negatively affecting gold - a non-interest-bearing asset.
Central banks and institutions maintain bullish medium- and long-term expectations
Despite short-term pressures, most institutions maintain positive medium-term expectations for gold. Goldman Sachs reiterated its target of $4,000/oz by 2025, while Citigroup believes gold could fall below $3,000/oz by 2026.
Technical Outlook Analysis OANDA:XAUUSD
Gold has once again bounced from the EMA21 and reached its initial upside target at the 0.236% Fibonacci retracement of $3,371, as noted in previous editions. For now, for gold to qualify for its next upside target at the raw price of $3,400, it needs to sustain price action above the 0.236% Fibonacci level, which means the 0.236% Fibonacci level is also the closest resistance at present.
Once gold breaks above the raw price point of $3,400, it will be in a position to continue its short-term rally with a target of around $3,435, rather than the all-time high of $3,500.
In terms of overall structure, gold still has a bullish outlook with the price channel as the main trend and RSI remaining above 50 and well away from the overbought zone, suggesting that there is still plenty of upside ahead.
In the case of a sell-off, if gold is sold below the EMA21, it could test the $3,320 support in the short term, more so the 0.382% Fibonacci retracement level converging with the lower edge of the price channel. Therefore, early long positions may be considered in terms of volume as well as protection of open positions.
Finally, technically, gold is still trending with an overall bullish outlook, with notable positions listed as follows.
Support: $3,350 – $3,320 – $3,300
Resistance: $3,371 – $3,400 – $3,435 – $3,500
SELL XAUUSD PRICE 3406 - 3404⚡️
↠↠ Stop Loss 3410
→Take Profit 1 3398
↨
→Take Profit 2 3392
BUY XAUUSD PRICE 3312 - 3314⚡️
↠↠ Stop Loss 3308
→Take Profit 1 3320
↨
→Take Profit 2 3326

Gold Slumps Sharply – Has the Rate-Cut Hope Faded?Gold prices are under intense selling pressure after the Bank of England, the Swiss National Bank, and the Federal Reserve all decided to keep interest rates elevated. This unified stance underscores persistent inflation concerns, driving up the opportunity cost of holding non-yielding assets like gold. As a result, investors rushed to take profits, sending XAUUSD down over 200 pips in just one session.
Adding fuel to the fire, the Fed’s latest monetary policy report to Congress warned that inflation could rise to 3% by year-end, higher than previous projections. Moreover, the Fed trimmed expectations for rate cuts in 2025 and beyond, signaling a longer road to policy easing.
🔎 What does this mean for gold's short-term outlook?
With high rates here to stay and the Fed's cautious stance, gold remains vulnerable to further downside in the near term. However, if upcoming U.S. economic data shows signs of significant weakness, gold may regain favor as a safe-haven asset.
At the time of writing, XAUUSD is trading around $3,347, a critical zone that may determine whether the current drop continues or finds a bottom.
Do you believe this dip will deepen—or is it a golden opportunity to buy the pullback? Share your thoughts below!
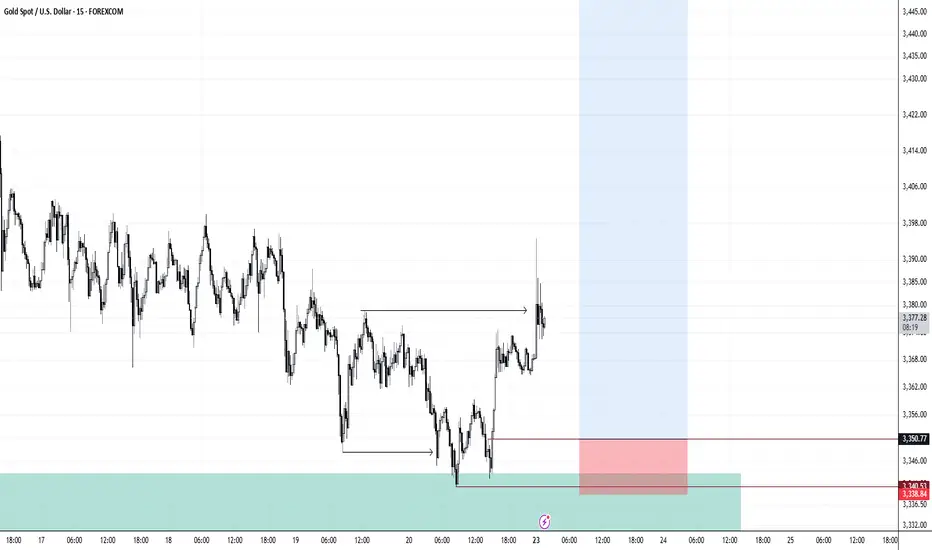
XAUUSD M15 I Bearish ReversalBased on the M15 chart, the price is trading near our sell entry level at 3367-3365, a pullback resistance that aligns closely with the 38.2% Fib retracement.
Our take profit is set at 3346.73, a pullback support.
The stop loss is set at 3384.55, a pullback resistance.
High Risk Investment Warning
Trading Forex/CFDs on margin carries a high level of risk and may not be suitable for all investors. Leverage can work against you.
Stratos Markets Limited (tradu.com ):
CFDs are complex instruments and come with a high risk of losing money rapidly due to leverage. 63% of retail investor accounts lose money when trading CFDs with this provider. You should consider whether you understand how CFDs work and whether you can afford to take the high risk of losing your money.
Stratos Europe Ltd (tradu.com ):
CFDs are complex instruments and come with a high risk of losing money rapidly due to leverage. 63% of retail investor accounts lose money when trading CFDs with this provider. You should consider whether you understand how CFDs work and whether you can afford to take the high risk of losing your money.
Stratos Global LLC (tradu.com ):
Losses can exceed deposits.
Please be advised that the information presented on TradingView is provided to Tradu (‘Company’, ‘we’) by a third-party provider (‘TFA Global Pte Ltd’). Please be reminded that you are solely responsible for the trading decisions on your account. There is a very high degree of risk involved in trading. Any information and/or content is intended entirely for research, educational and informational purposes only and does not constitute investment or consultation advice or investment strategy. The information is not tailored to the investment needs of any specific person and therefore does not involve a consideration of any of the investment objectives, financial situation or needs of any viewer that may receive it. Kindly also note that past performance is not a reliable indicator of future results. Actual results may differ materially from those anticipated in forward-looking or past performance statements. We assume no liability as to the accuracy or completeness of any of the information and/or content provided herein and the Company cannot be held responsible for any omission, mistake nor for any loss or damage including without limitation to any loss of profit which may arise from reliance on any information supplied by TFA Global Pte Ltd.
The speaker(s) is neither an employee, agent nor representative of Tradu and is therefore acting independently. The opinions given are their own, constitute general market commentary, and do not constitute the opinion or advice of Tradu or any form of personal or investment advice. Tradu neither endorses nor guarantees offerings of third-party speakers, nor is Tradu responsible for the content, veracity or opinions of third-party speakers, presenters or participants.

After the support at 3,340 for gold, a rebound may be expected.The gold price rebounded after falling from the all-time high of 3,500 to 3,120. It opened at 3,433 last week, dipped to the low of 3,340 before rebounding to close at 3,368. The weekly candlestick was bearish but held above the 5-week moving average. The daily chart shows a doji star with a bearish alignment, yet it maintained the support of the middle Bollinger Band. The 4-hour chart remains within the upward channel, with the support near 3,340 proving effective, indicating short-term signs of stabilizing. This morning, it gapped up to 3,398 and then slightly corrected. The market's safe-haven position replenishment demand supports the gold price. In terms of operation, it is recommended to focus on going long on pullbacks.
you are currently struggling with losses,or are unsure which of the numerous trading strategies to follow,You have the option to join our VIP program. I will assist you and provide you with accurate trading signals, enabling you to navigate the financial markets with greater confidence and potentially achieve optimal trading results.
Trading Strategy:
buy@3350-3360
TP:3390-3395

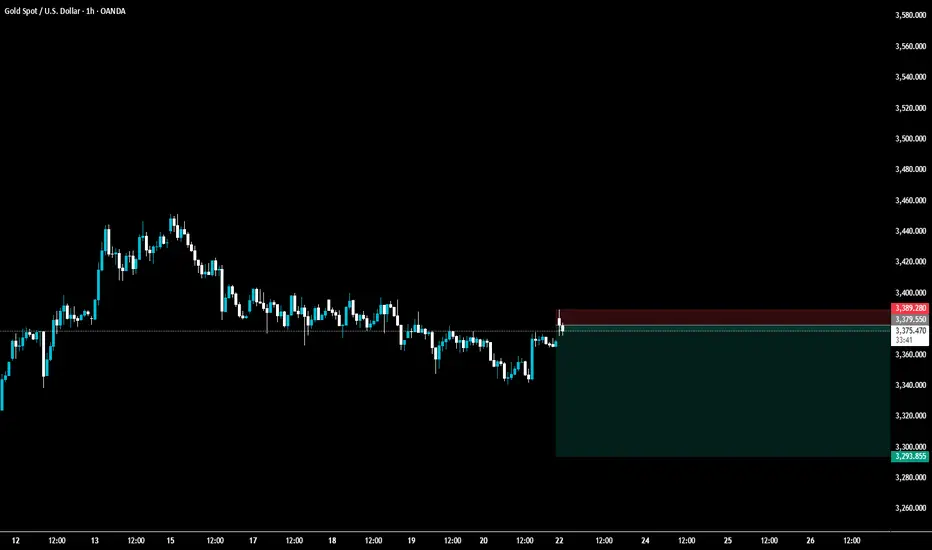
Gold 1H Intra-Day Chart 23.06.2025Huge push up on Gold on market open due to Israel- U.S. war tension.
Option 1: Gold rejects from CMP and moves higher towards $3,416.
Option 2: Gold keeps dropping lower towards $3,290 for a deep liquidity grab.
Which scenario do you find more likely?

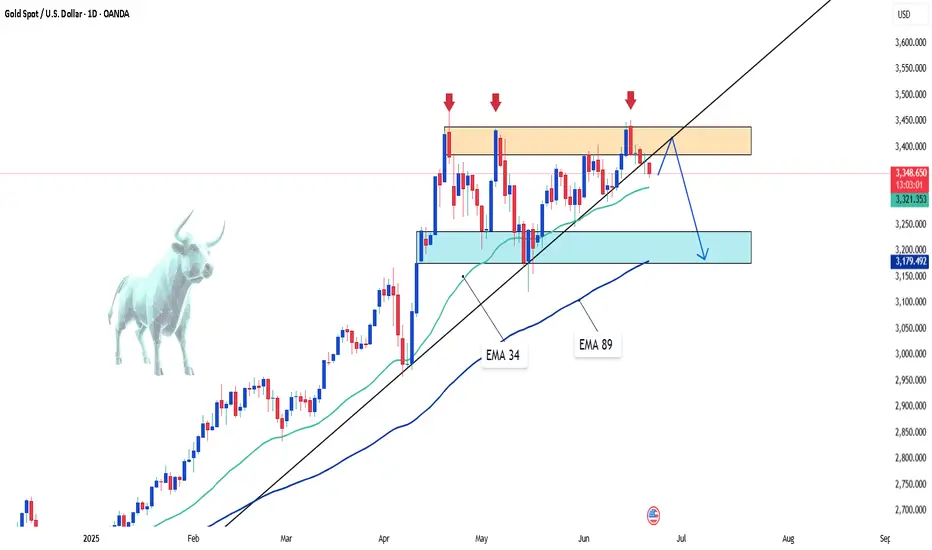
"XAUUSD – Hidden Strength Within the Accumulation Zone"Hello everyone, how are you currently evaluating XAUUSD?
Yesterday, gold remained relatively stable without major volatility, yet continued to be supported by a favorable macro environment. Escalating tensions between Israel and Iran have sustained safe-haven demand. While the U.S. has yet to make a direct military move, President Trump’s emergency meeting and firm stance have increased market caution, which in turn boosted interest in gold.
At the time of writing, gold is trading around $3,368, and the long-term trend still favors the bulls. But why do I say that?
From both a technical and macro perspective, gold is in a healthy accumulation phase. Although it hasn’t broken above the record high, XAUUSD remains safely above key support zones — especially above the EMA 34 — which continues to affirm its bullish structure.
EMA 34 remains a strong dynamic support, with a clear separation from EMA 89, reinforcing the momentum. Even if we see short-term pullbacks in the next few sessions, they are more likely technical retests rather than signs of reversal.
Adding to that, the rising trendline, higher support levels, and bullish candlestick patterns all strengthen the case for continued upward movement. These combined factors paint a positive technical outlook for gold in the medium to long term.
From my perspective, I remain confident in gold’s long-term uptrend. What about you? Feel free to share your thoughts!

Gold BuysH4 structure we are bullish, M15 we chOch and wait for pullback then continue with buys. With the iraq wars, investors are looking for a save haven and saving their cash in gold. We are bullish for the week
#XAUUSD #GOLD 4H#XAUUSD 4H Trade Update
Gold continues to respect its bullish market structure, with clear Breaks of Structure (BOS) and formation of higher lows. Currently, price is consolidating around a key ascending trendline and demand zone.
📍 Entry Zone: 3,340 – 3,345
🎯 Targets: 3,370 / 3,390 / 3,400
❌ Stop-Loss: Below 3,315
This setup was shared yesterday and has since been perfectly activated as price tapped into our marked demand zone.
#Gold #Silver #ForexTrading #XAUUSD #PriceAction

Gold Eyes $3486 as Middle East Tensions Spark Flight to SafetyGOLD | Set to Surge Amid Escalating Geopolitical Tensions
Gold prices are poised for a sharp rally as geopolitical tensions in the Middle East intensify, following reports of a U.S. airstrike on Iranian nuclear facilities. This has triggered a strong flight-to-safety response, pushing investors toward safe-haven assets.
Analysts now forecast a broader upside range, with gold potentially trading between $3,500 and $3,700, driven by both geopolitical instability and persistent inflation concerns.
Technical Outlook:
Gold is expected to open with a bullish gap, with an initial move toward the key resistance at 3404. A confirmed 1H/4H close above this level would open the path toward 3448, and ultimately 3486, as long as geopolitical risk remains elevated.
However, any signs of de-escalation or negotiations from Iran could halt the bullish momentum and trigger a reversal toward 3340.
Key Levels:
• Pivot Zone: 3365, 3379
• Resistance: 3404, 3448, 3486
• Support: 3348, 3339, 3281

Can 6 Holes in a mountain move gold this week? 23-27 June 2025Hello fellow traders of OANDA:XAUUSD
All about last week here
Since Israel's attack on Iran on Friday, June 13th, aimed at destroying all facilities for potential nuclear weapons production, the gold price initially rose to $3450. This surge lasted until Monday, June 16th, during the European session, but then began to fall from there. 📉🔻
Signs of potential peace talks and a swift end to the conflict largely made investors hesitant to invest. Throughout the week, the gold price mostly reacted negatively to higher prices due to investor uncertainty. This was further exacerbated by the fact that the US had not yet entered this war, which Israel initiated. 🕊️😟
However, since the US attack with bunker-busting bombs on the nuclear facilities on June 21st, they are now part of the conflict. Not least for this reason, they might become the target of retaliatory strikes, as already announced by the Iranian regime. 💣💥
If one looks at the timeline of news and announcements regarding potential US involvement in this war, and the two-week waiting period announced by President Trump, it will certainly become clear that this was nothing more than tactics. It was foreseeable that the US would become involved in the conflict, not least because the Israelis lack the appropriate weapons. The possibility of the US providing these weapons to the Israelis was also in the news; however, it then became clear that this specific bomb could only be used by the Stealth Bomber B2. This made it evident that it was only a matter of timing when it would happen, and they naturally wanted to keep that secret – anything else would be nonsensical anyway. 🤫✈️
What's to be expected next? Regarding this conflict, I hope for a swift end. 🕊️🙏 As for the gold price, well, I still believe in a new All-Time High (ATH). 🚀🌟 Will it come this week? Possibly. But the much more important question is whether the Iranian regime will truly dare to attack the US and exact revenge. 🤔⚔️
Market Structure:
The chart shows a clear shift from bullish 🐂 to bearish 🐻 structure. We see a significant high around June 13th at approximately $3,451, followed by a break of structure with lower highs and lower lows forming. 📉
Key Levels: 🔑
Premium levels: The area around $3,440-$3,451 represents premium pricing where institutional selling likely occurred. 💎
Fair Value Gaps: There appear to be several imbalances/gaps that price may seek to fill, particularly around the $3,380-$3,400 zone. 🎯
Order Blocks: The consolidation areas around $3,320-$3,340 and $3,380-$3,400 represent potential institutional order blocks. 🧱
Institutional Levels: 🏦
Psychological resistance: $3,450 level acted as significant resistance. 🚧
Current support cluster: $3,320-$3,340 area showing multiple touches. 🛡️
Liquidity zones:
The recent lows around $3,293 represent buy-side liquidity that institutions may target. 💧
Fibonacci Analysis: 📏
Based on the major swing from the low around June 9th ($3,300) to the high on June 13th ($3,451):
50% retracement: ~$3,375 (already tested and failed) 📉
61.8% retracement: ~$3,357 (near current price action) ✨
78.6% retracement: ~$3,337 (aligns with support cluster) ✅
Gann Concepts: 🔢
The timing shows potential significance around the June 13th high, with subsequent price action following geometric price relationships. The current price action around $3,328 suggests we're testing important Gann square relationships from the cycle highs. 📐
Cycle Timing: ⏰
The approximately 10-day cycle from low to high to current retracement suggests we may be in a corrective phase that could extend into late June, with potential for cycle lows around the June 25-27 timeframe based on typical precious metals cycles. 🗓️
Current Assessment:
Price appears to be in a corrective phase testing the $3,320-$3,340 institutional support zone. A break below could target the cycle lows, while a hold here with reclaim of $3,380 could indicate accumulation for the next leg higher. ⚖️🔍
Please take the time to let me know what you think about this. 💬
-------------------------------------------------------------------------
This is just my personal market idea and not financial advice! 📢 Trading gold and other financial instruments carries risks – only invest what you can afford to lose. Always do your own analysis, use solid risk management, and trade responsibly.
Good luck and safe trading! 🚀📊

Natural Gas | Oil | Dollar | Silver | Gold Price Forecast.Natural Gas | Oil | Dollar | Silver | Gold Price Forecast.
NYMEX:NG1! NYMEX:CL1! COMEX:GC1! COMEX:SI1!
